| Param | Original file | Final file |
|---|---|---|
| Filename | modeM0/AS1G05_233T10_9000000570_04554cztM0_level2.evt | modeM0/AS1G05_233T10_9000000570_04554cztM0_level2_quad_clean.evt |
| Size (bytes) | 514,555,200 | 82,800,000 |
| Size | 490.7 MB | 79.0 MB |
| Events in quadrant A | 3,875,716 | 517,233 |
| Events in quadrant B | 3,284,354 | 525,378 |
| Events in quadrant C | 3,727,423 | 508,946 |
| Events in quadrant D | 4,241,794 | 489,268 |
| Mode M9 | |||
|---|---|---|---|
| Quadrant | BADHDUFLAG | Total packets | Discarded packets |
| A | 0 | 9 | 0 |
| B | 0 | 9 | 0 |
| C | 0 | 9 | 0 |
| D | 0 | 9 | 0 |
| Mode M0 | |||
|---|---|---|---|
| Quadrant | BADHDUFLAG | Total packets | Discarded packets |
| A | 0 | 16194 | 3 |
| B | 0 | 14340 | 2 |
| C | 0 | 15772 | 2 |
| D | 0 | 17325 | 2 |
| Mode SS | |||
|---|---|---|---|
| Quadrant | BADHDUFLAG | Total packets | Discarded packets |
| A | 0 | 138 | 0 |
| B | 0 | 138 | 0 |
| C | 0 | 138 | 0 |
| D | 0 | 138 | 0 |
| Quadrant | Total seconds | Saturated seconds | Saturation percentage |
|---|---|---|---|
| A | 6679 | 254 | 3.802965% |
| B | 6679 | 69 | 1.033089% |
| C | 6679 | 210 | 3.144183% |
| D | 6679 | 353 | 5.285222% |
Noise dominated data is calculated using 1-second bins in cleaned event files. If a bin has >2000 counts, and if more than 50% of those come from <1% of pixels, then it is considered to be noise-dominated and hence unusable.
| Quadrant | # 1 sec bins | Bins with >0 counts | Bins with >2000 counts | High rate bins dominated by noise | Noise dominated (total time) | Noise dominated (detector-on time) | Marked lightcurve |
|---|---|---|---|---|---|---|---|
| A | 7654 | 6680 | 189 | 189 | 2.47% | 2.83% | 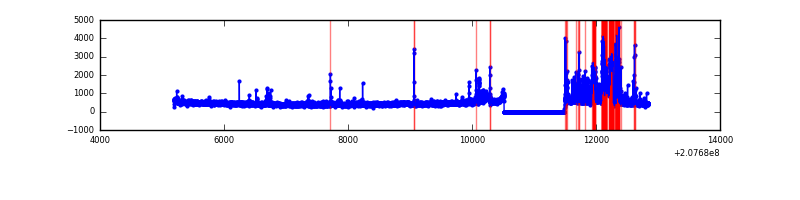 |
| B | 7654 | 6680 | 21 | 21 | 0.27% | 0.31% | 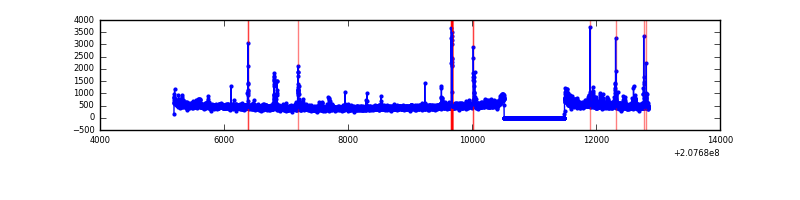 |
| C | 7654 | 6680 | 151 | 151 | 1.97% | 2.26% | 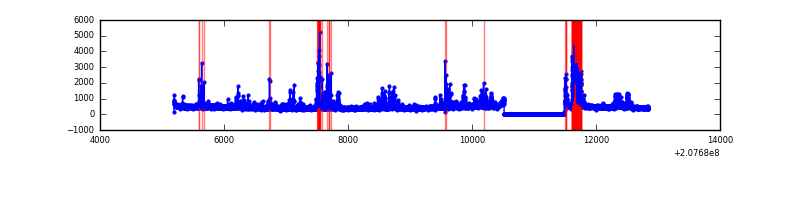 |
| D | 7654 | 6680 | 294 | 294 | 3.84% | 4.40% | 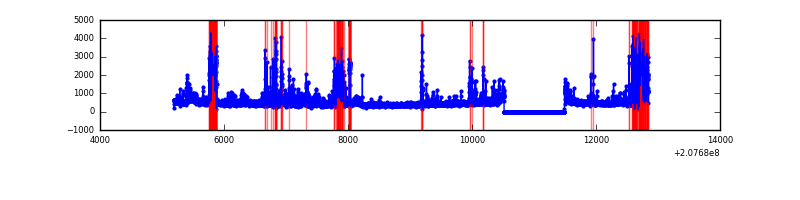 |
Top three noisy pixels from each quadrant. If the there are fewer than three noisy pixels in the level2.evt file, extra rows are filled as -1
| Pixel properties | Quadrant properties | ||||||
|---|---|---|---|---|---|---|---|
| Quadrant | DetID | PixID | Counts | Sigma | Mean | Median | Sigma |
| A | 0 | 31 | 671434 | 4421.12 | 747 | 731 | 151.7 |
| A | 10 | 253 | 135868 | 890.79 | 747 | 731 | 151.7 |
| A | 13 | 14 | 45583 | 295.65 | 747 | 731 | 151.7 |
| B | 4 | 80 | 73417 | 492.97 | 765 | 745 | 147.4 |
| B | 15 | 204 | 67758 | 454.58 | 765 | 745 | 147.4 |
| B | 10 | 16 | 53697 | 359.2 | 765 | 745 | 147.4 |
| C | 14 | 48 | 784244 | 4560.21 | 731 | 733 | 171.8 |
| C | 7 | 247 | 65205 | 375.24 | 731 | 733 | 171.8 |
| C | 9 | 54 | 14522 | 80.26 | 731 | 733 | 171.8 |
| D | 13 | 235 | 431261 | 2437.19 | 720 | 697 | 176.7 |
| D | 2 | 37 | 317574 | 1793.67 | 720 | 697 | 176.7 |
| D | 13 | 25 | 222365 | 1254.74 | 720 | 697 | 176.7 |
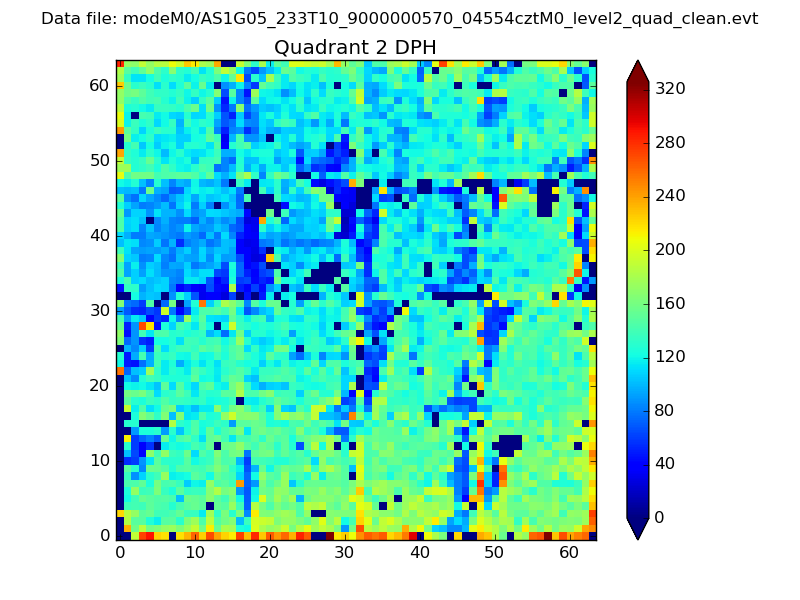
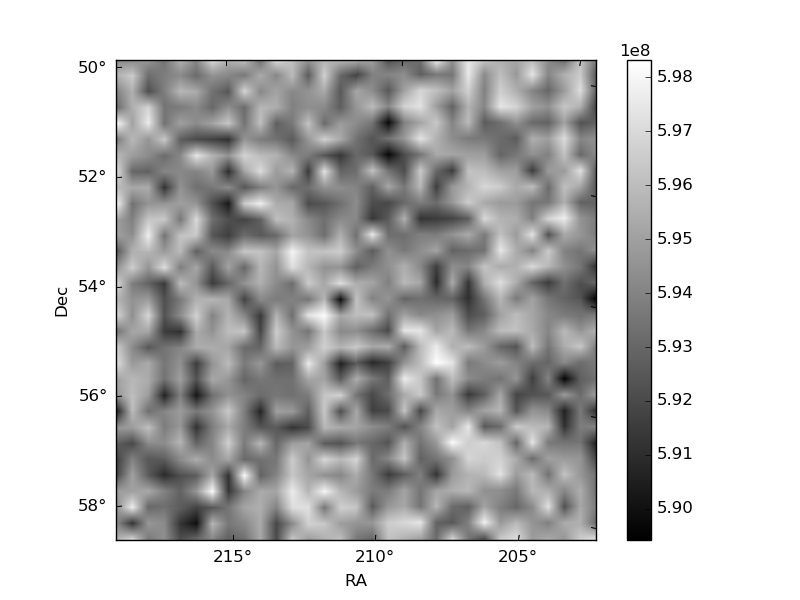
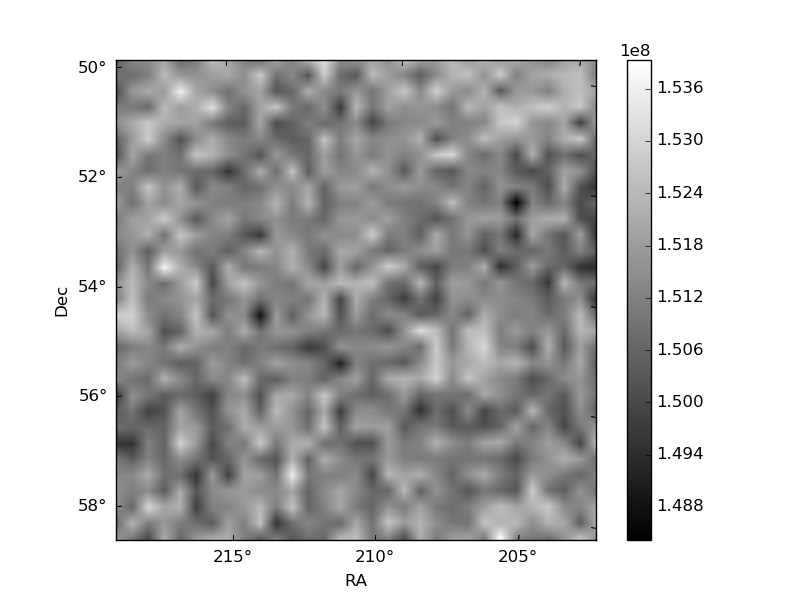
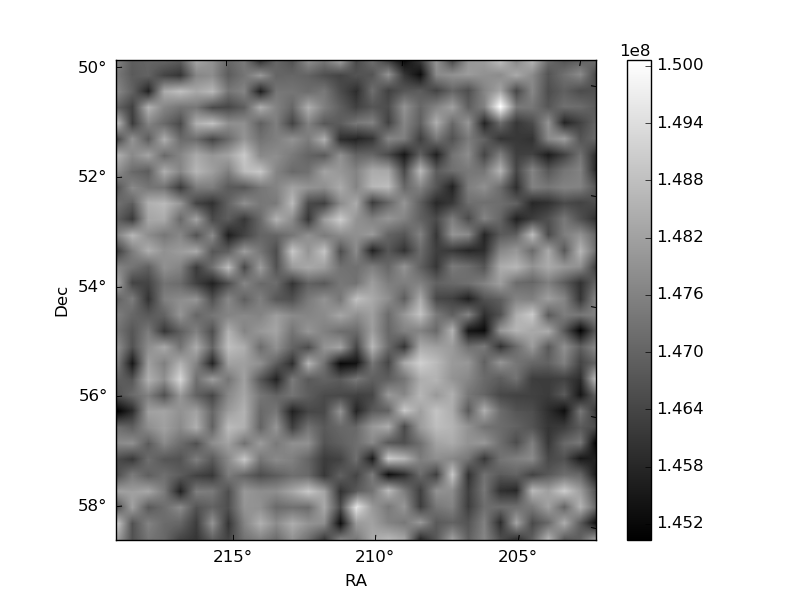
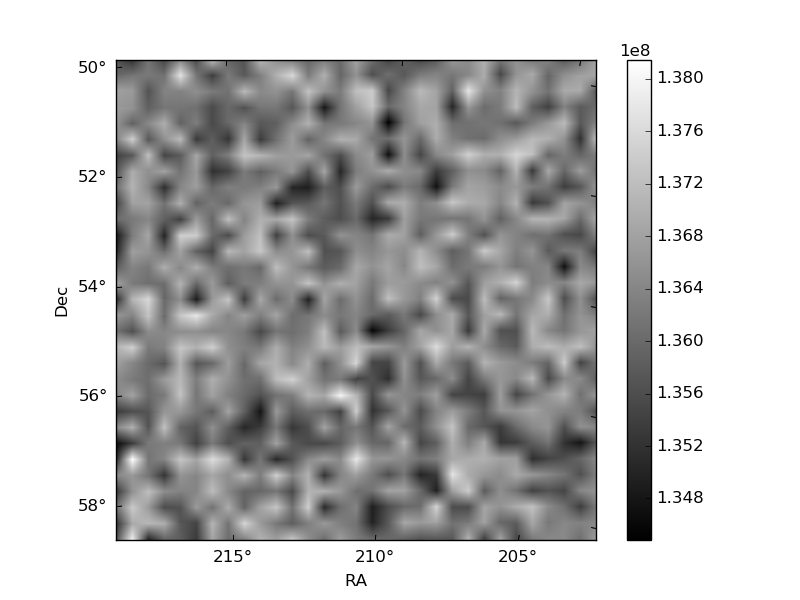
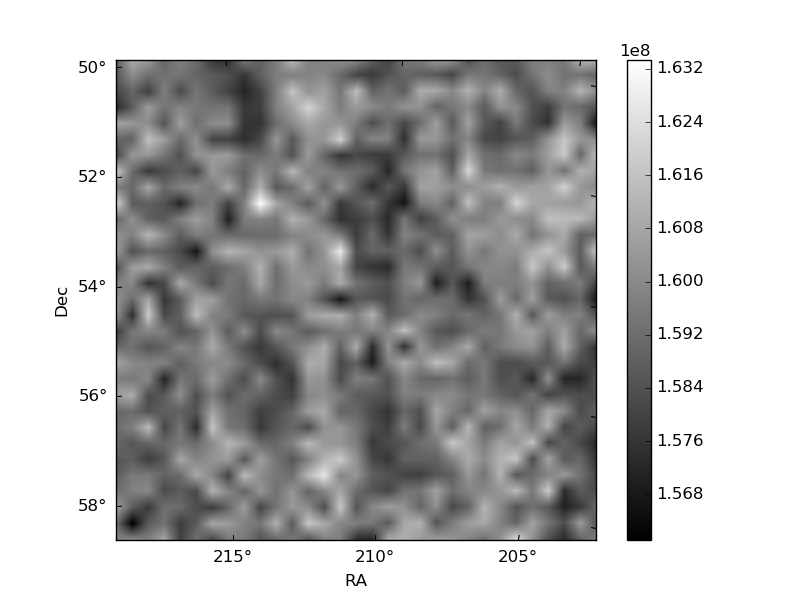
Histogram calculated using DETX and DETY for each event in the final _common_clean file
| Quadrant A | 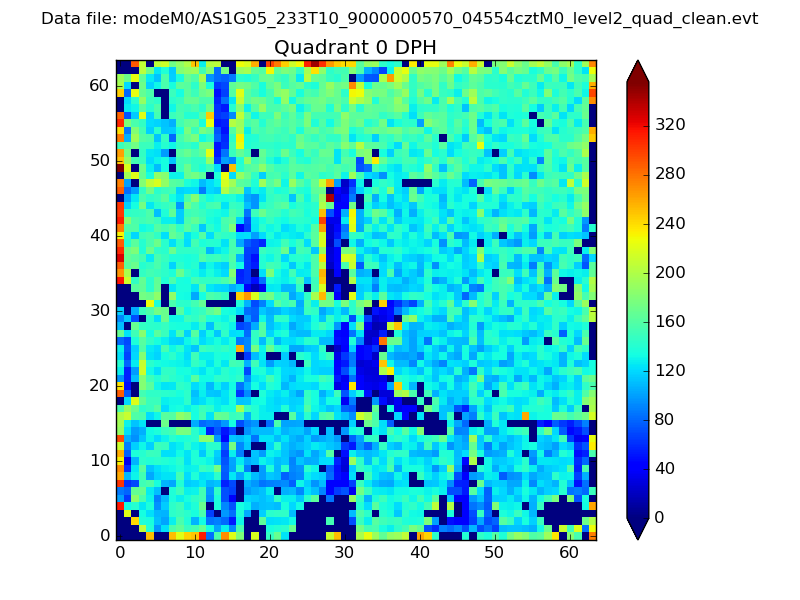 |
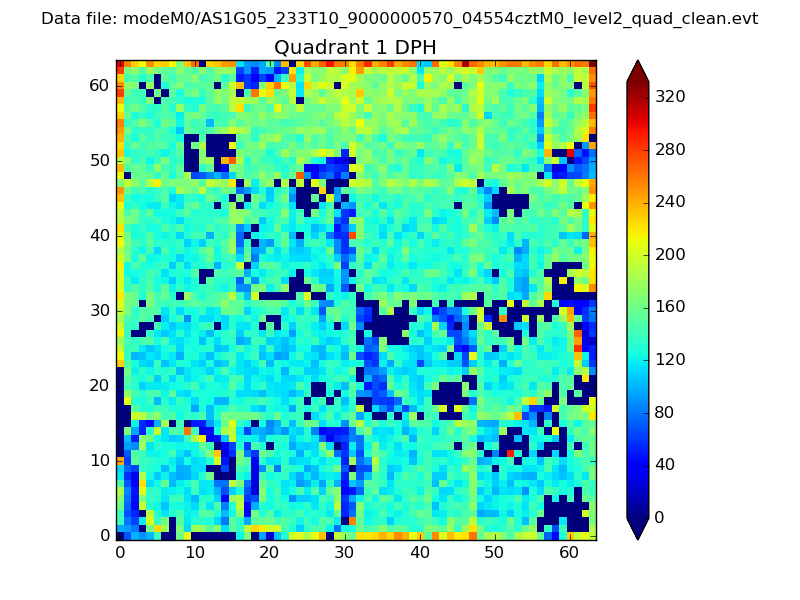 |
Quadrant B |
|---|---|---|---|
| Quadrant D | 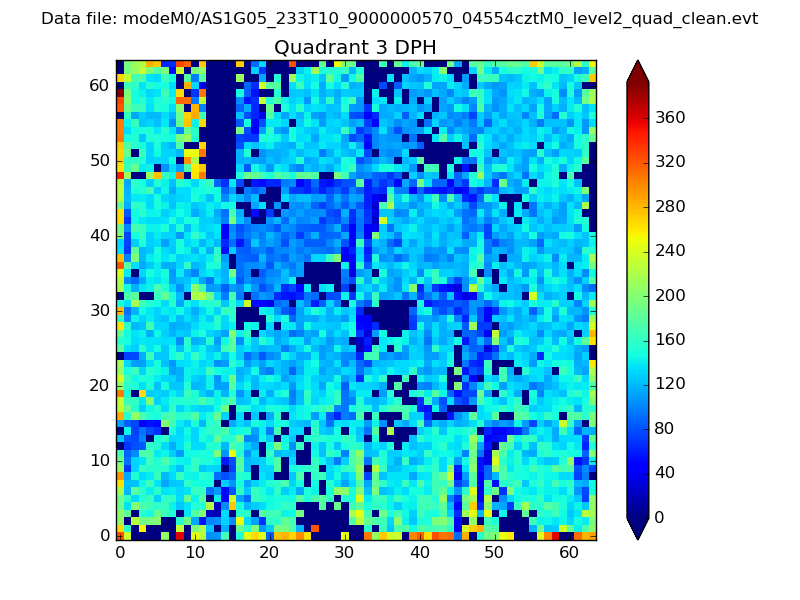 |
 |
Quadrant C |
| Plot type | Count rate plots | Images |
|---|---|---|
| Comparison with Poisson distribution Blue bars denote a histogram of data divided into 1 sec bins. Red curve is a Poisson curve with rate = median count rate of data. |
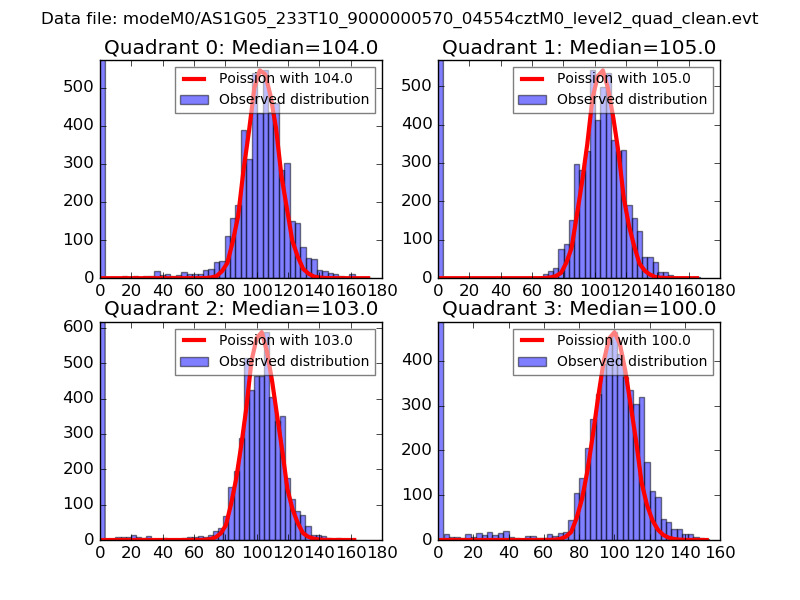 |
 |
| Quadrant-wise count rates Data is divided into 100 sec bins |
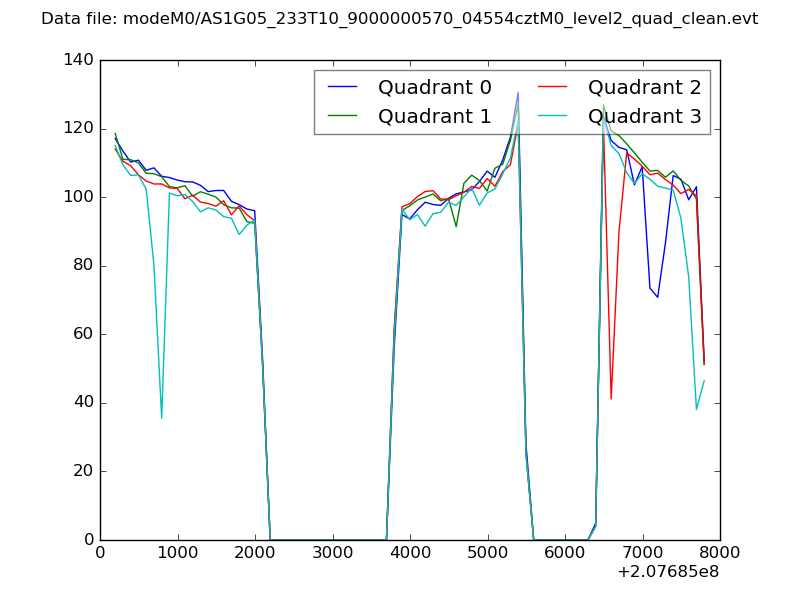 |
|
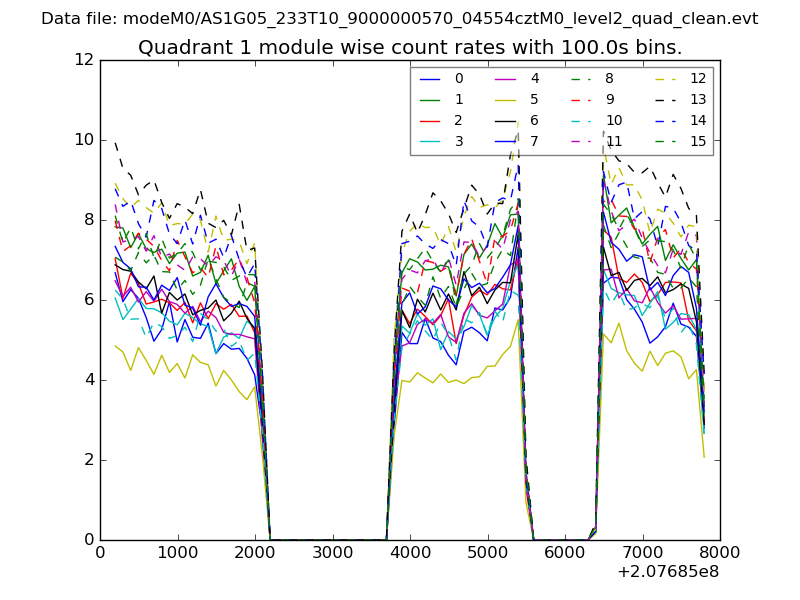
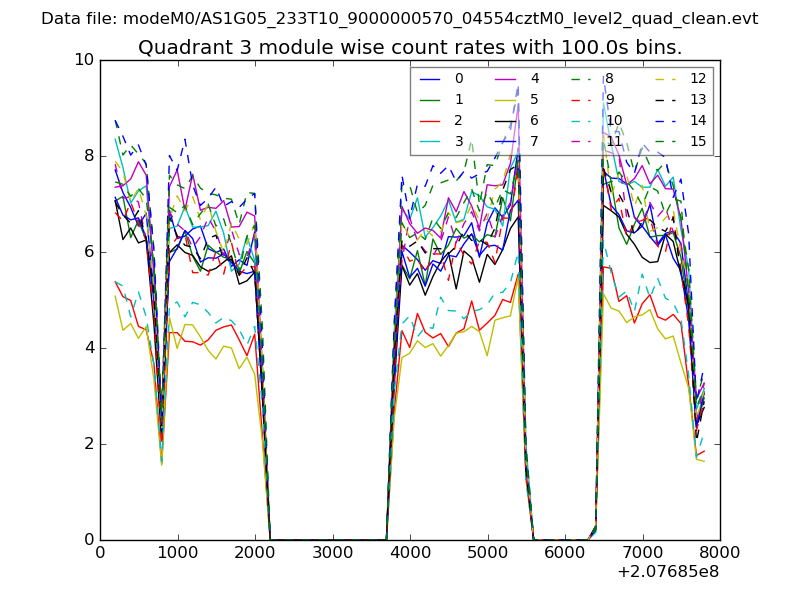
| Module-wise count rates for Quadrant A Data is divided into 100 sec bins |
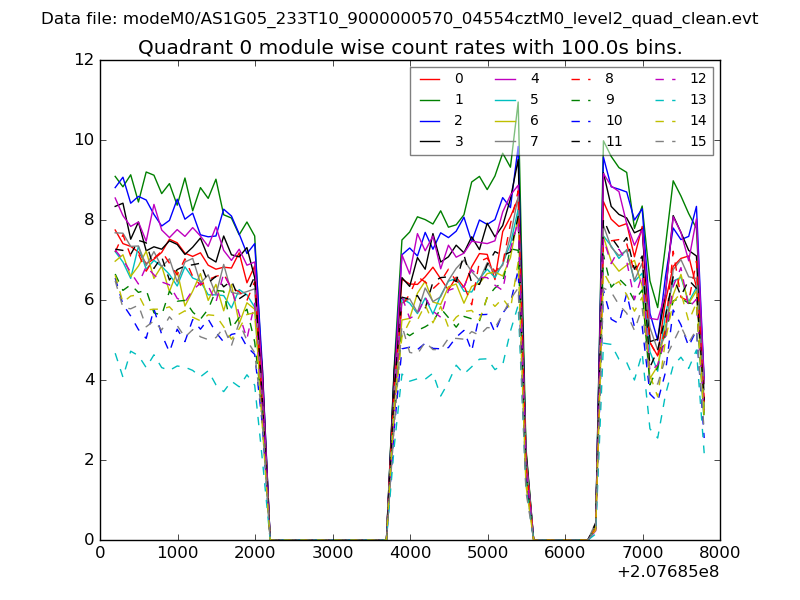 |
 |
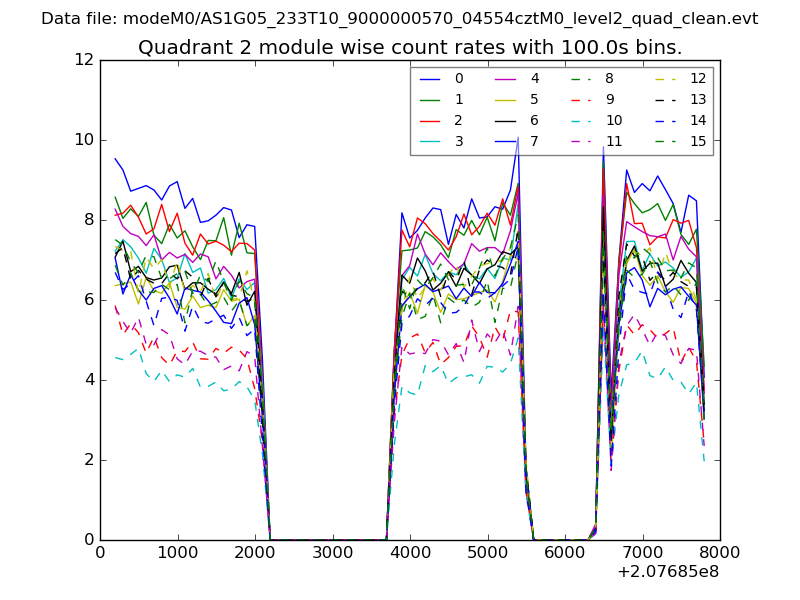
| Module-wise count rates for Quadrant B Data is divided into 100 sec bins |
 |
 |
| Module-wise count rates for Quadrant C Data is divided into 100 sec bins |
 |
 |
| Module-wise count rates for Quadrant D Data is divided into 100 sec bins |
 |
 |
| Parameter | Plot |
|---|---|
| CZT HV Monitor | 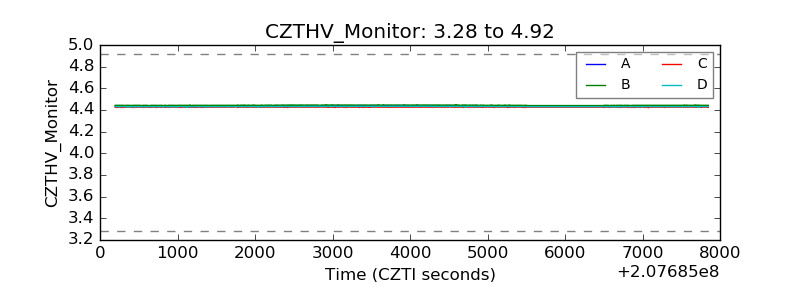 |
| D_VDD | 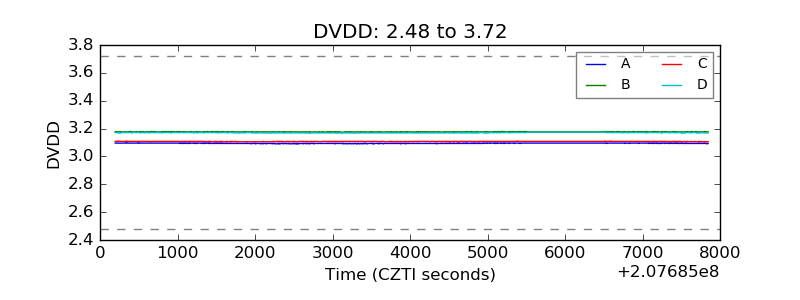 |
| Temperature 1 | 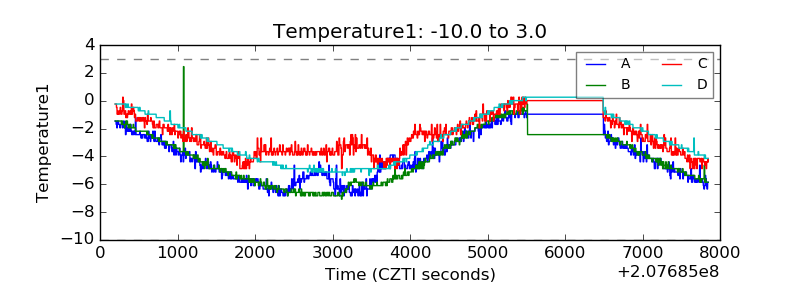 |
| Veto HV Monitor | 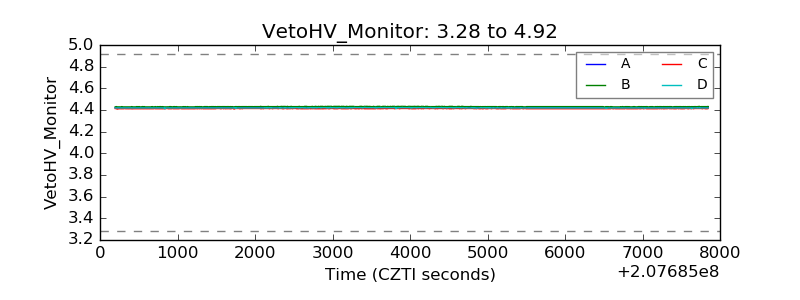 |
| Veto LLD | 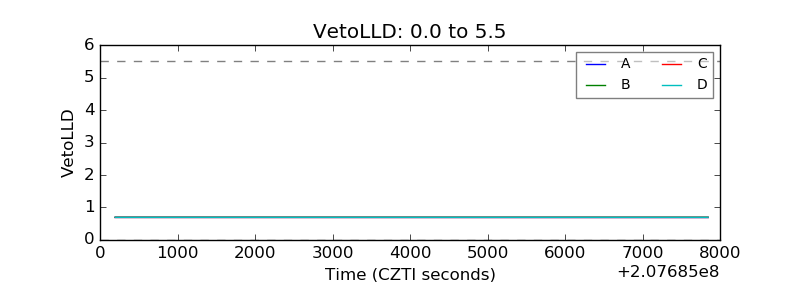 |
| Alpha Counter | 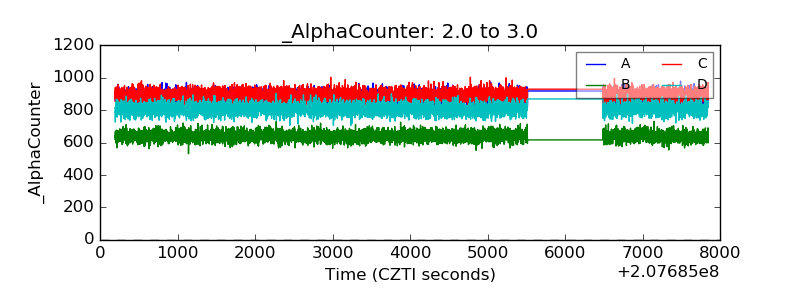 |
| _CPM_Rate | 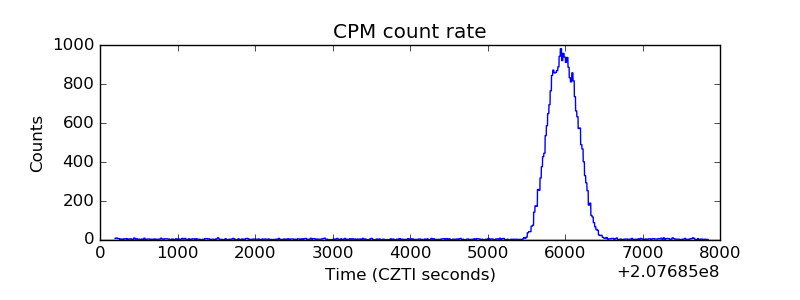 |
| CZT Counter | 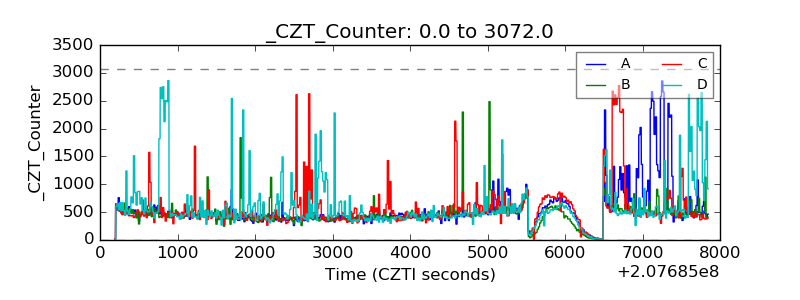 |
| +2.5 Volts monitor | 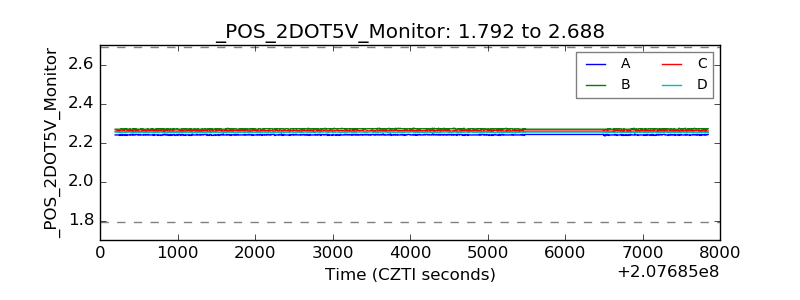 |
| +5 Volts monitor | 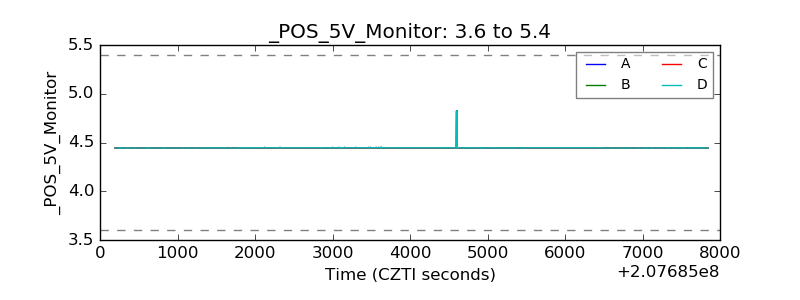 |
| _ROLL_ROT | 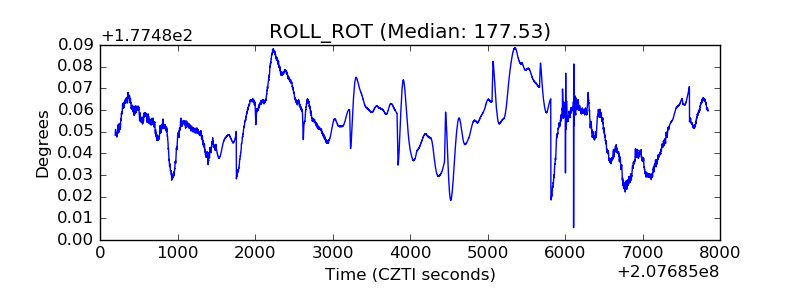 |
| _Roll_DEC | 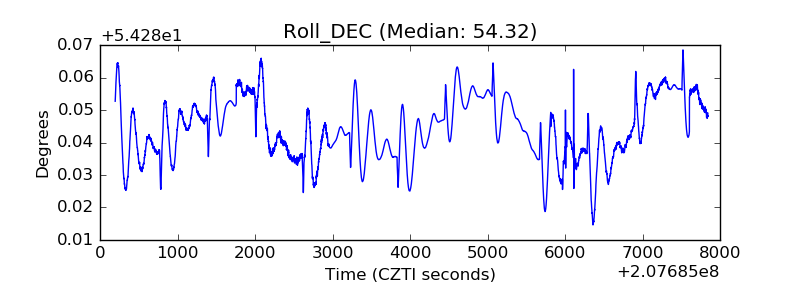 |
| _Roll_RA | 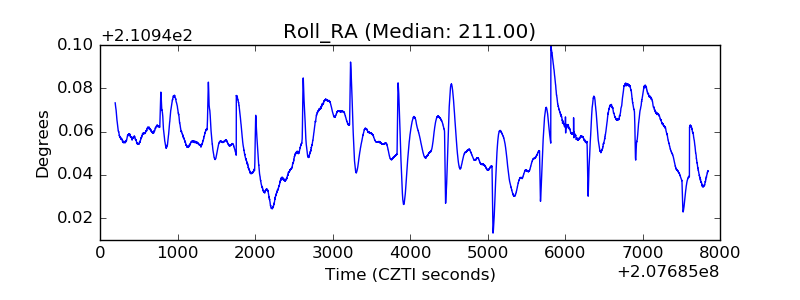 |
| Veto Counter | 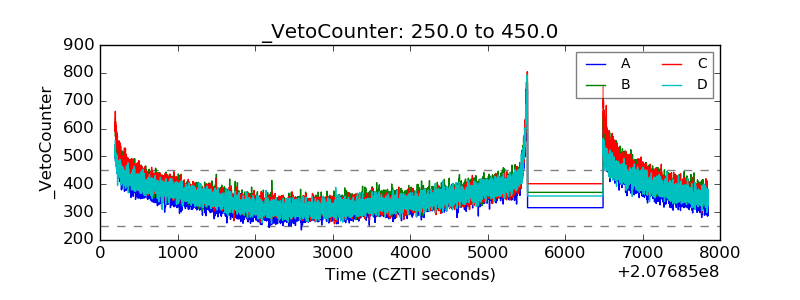 |