| Param | Original file | Final file |
|---|---|---|
| Filename | modeM0/AS1G05_233T10_9000000570_04556cztM0_level2.evt | modeM0/AS1G05_233T10_9000000570_04556cztM0_level2_quad_clean.evt |
| Size (bytes) | 556,430,400 | 77,947,200 |
| Size | 530.7 MB | 74.3 MB |
| Events in quadrant A | 4,706,509 | 474,912 |
| Events in quadrant B | 3,150,696 | 496,400 |
| Events in quadrant C | 3,395,820 | 479,719 |
| Events in quadrant D | 5,155,500 | 453,471 |
| Mode M9 | |||
|---|---|---|---|
| Quadrant | BADHDUFLAG | Total packets | Discarded packets |
| A | 0 | 13 | 0 |
| B | 0 | 13 | 0 |
| C | 0 | 13 | 0 |
| D | 0 | 14 | 0 |
| Mode M0 | |||
|---|---|---|---|
| Quadrant | BADHDUFLAG | Total packets | Discarded packets |
| A | 0 | 18479 | 3 |
| B | 0 | 13809 | 2 |
| C | 0 | 14749 | 2 |
| D | 0 | 19884 | 2 |
| Mode SS | |||
|---|---|---|---|
| Quadrant | BADHDUFLAG | Total packets | Discarded packets |
| A | 0 | 134 | 0 |
| B | 0 | 134 | 0 |
| C | 0 | 134 | 0 |
| D | 0 | 134 | 0 |
| Quadrant | Total seconds | Saturated seconds | Saturation percentage |
|---|---|---|---|
| A | 6524 | 498 | 7.633354% |
| B | 6524 | 33 | 0.505825% |
| C | 6524 | 184 | 2.820356% |
| D | 6524 | 663 | 10.162477% |
Noise dominated data is calculated using 1-second bins in cleaned event files. If a bin has >2000 counts, and if more than 50% of those come from <1% of pixels, then it is considered to be noise-dominated and hence unusable.
| Quadrant | # 1 sec bins | Bins with >0 counts | Bins with >2000 counts | High rate bins dominated by noise | Noise dominated (total time) | Noise dominated (detector-on time) | Marked lightcurve |
|---|---|---|---|---|---|---|---|
| A | 7659 | 6526 | 373 | 373 | 4.87% | 5.72% | 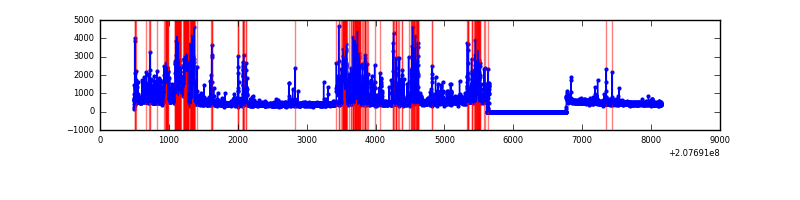 |
| B | 7659 | 6526 | 9 | 9 | 0.12% | 0.14% | 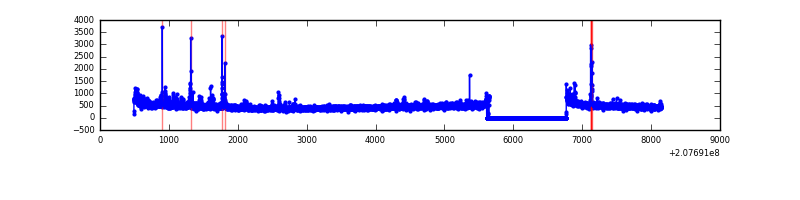 |
| C | 7659 | 6526 | 128 | 128 | 1.67% | 1.96% | 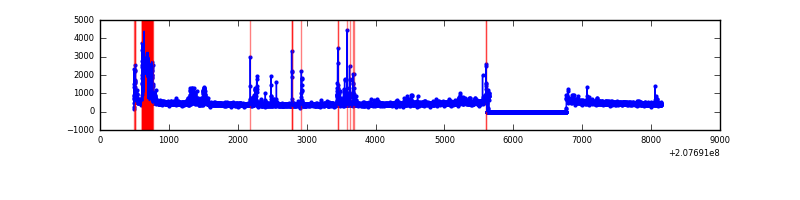 |
| D | 7659 | 6526 | 585 | 585 | 7.64% | 8.96% | 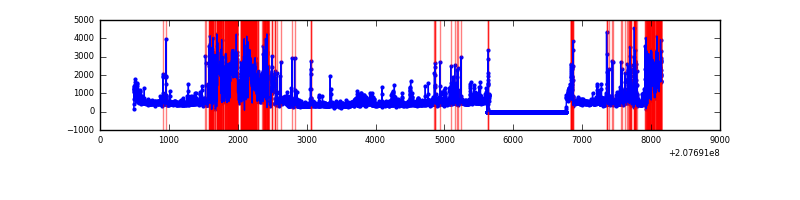 |
Top three noisy pixels from each quadrant. If the there are fewer than three noisy pixels in the level2.evt file, extra rows are filled as -1
| Pixel properties | Quadrant properties | ||||||
|---|---|---|---|---|---|---|---|
| Quadrant | DetID | PixID | Counts | Sigma | Mean | Median | Sigma |
| A | 10 | 253 | 856230 | 5767.78 | 724 | 706 | 148.3 |
| A | 0 | 31 | 765607 | 5156.82 | 724 | 706 | 148.3 |
| A | 0 | 118 | 113536 | 760.68 | 724 | 706 | 148.3 |
| B | 4 | 80 | 63254 | 432.21 | 757 | 738 | 144.6 |
| B | 15 | 204 | 60205 | 411.13 | 757 | 738 | 144.6 |
| B | 10 | 246 | 27653 | 186.08 | 757 | 738 | 144.6 |
| C | 14 | 48 | 496473 | 2939.91 | 720 | 723 | 168.6 |
| C | 7 | 247 | 65401 | 383.56 | 720 | 723 | 168.6 |
| C | 9 | 54 | 10270 | 56.62 | 720 | 723 | 168.6 |
| D | 2 | 37 | 931795 | 5555.72 | 693 | 671 | 167.6 |
| D | 13 | 235 | 923648 | 5507.11 | 693 | 671 | 167.6 |
| D | 13 | 25 | 394223 | 2348.2 | 693 | 671 | 167.6 |
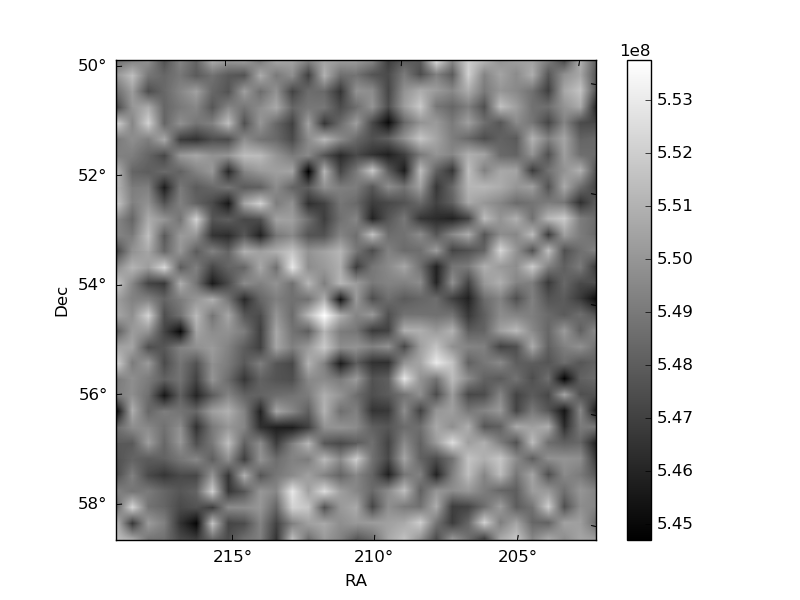
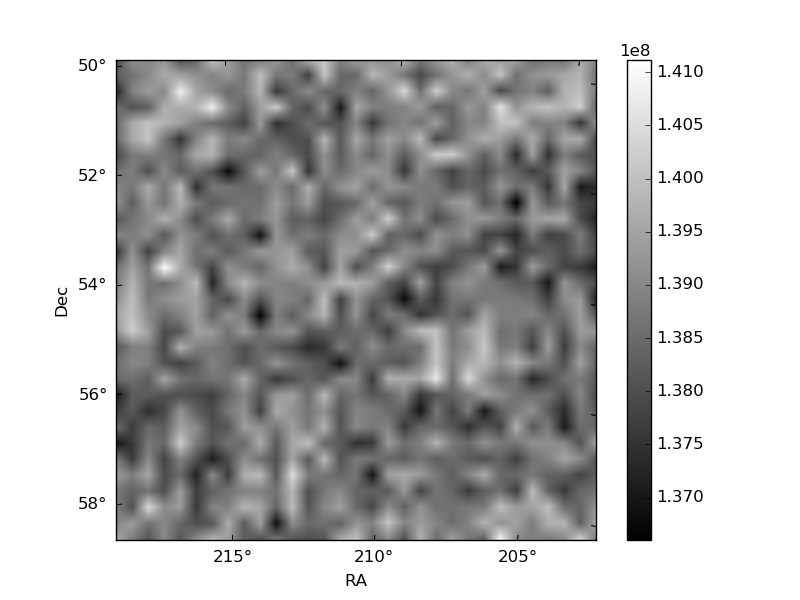
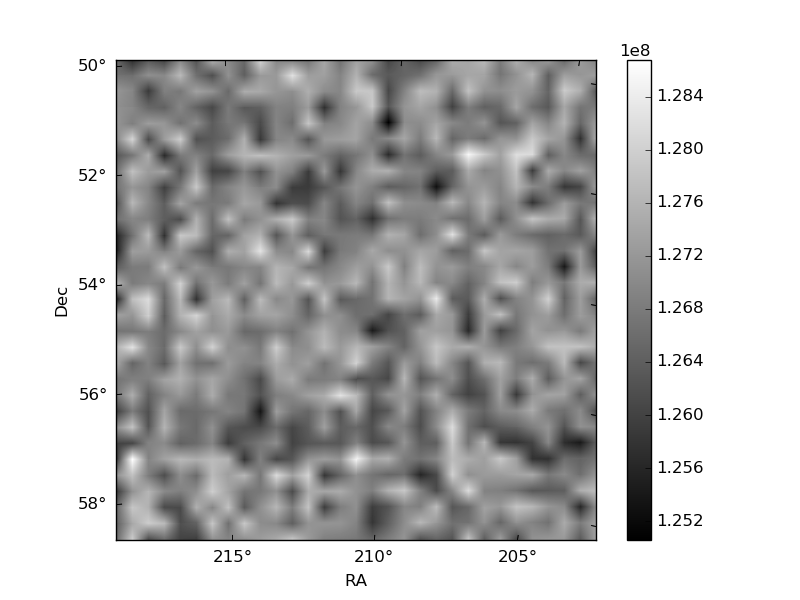
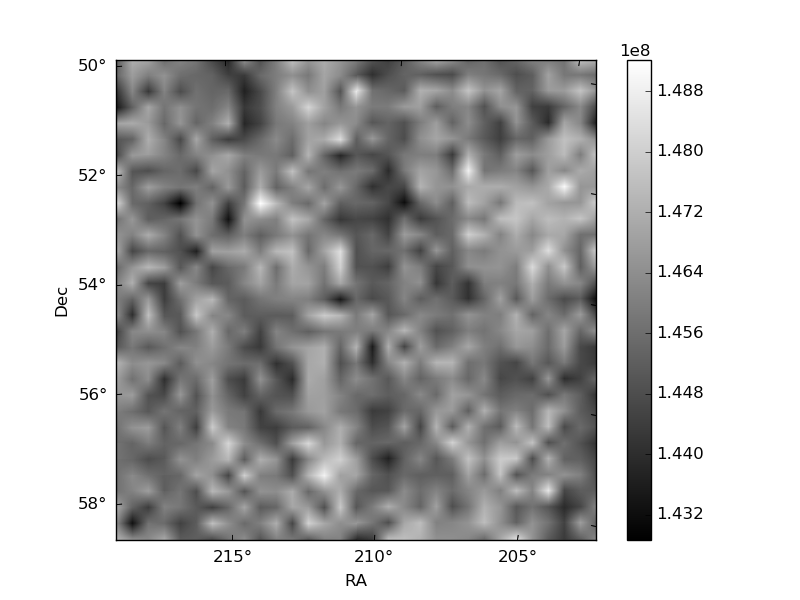
Histogram calculated using DETX and DETY for each event in the final _common_clean file
| Quadrant A | 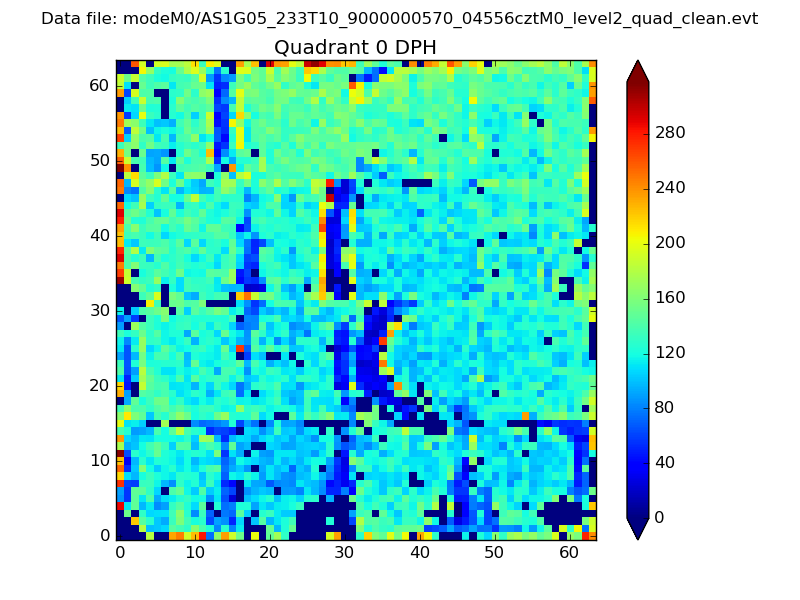 |
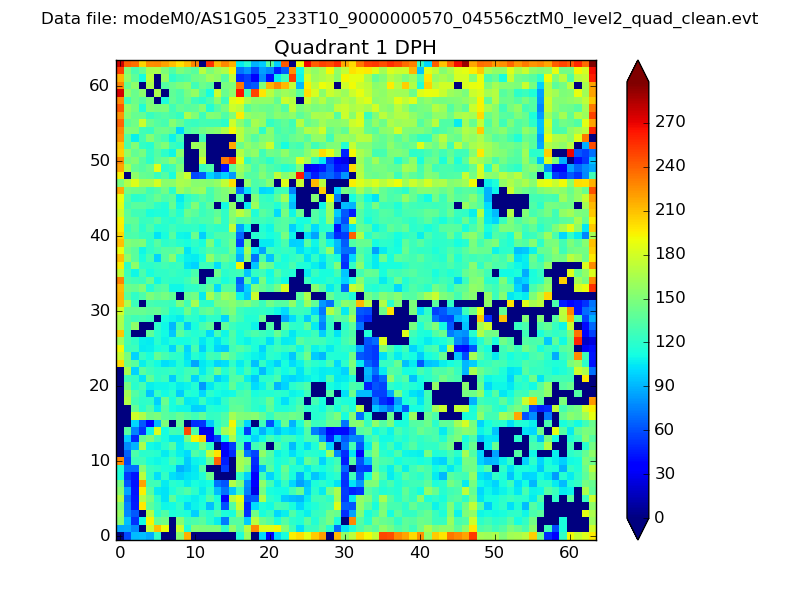 |
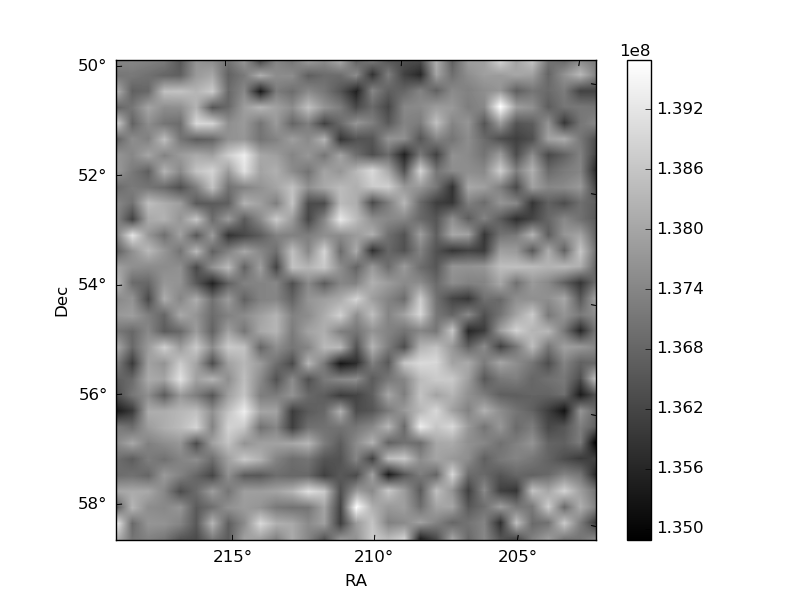
Quadrant B |
|---|---|---|---|
| Quadrant D | 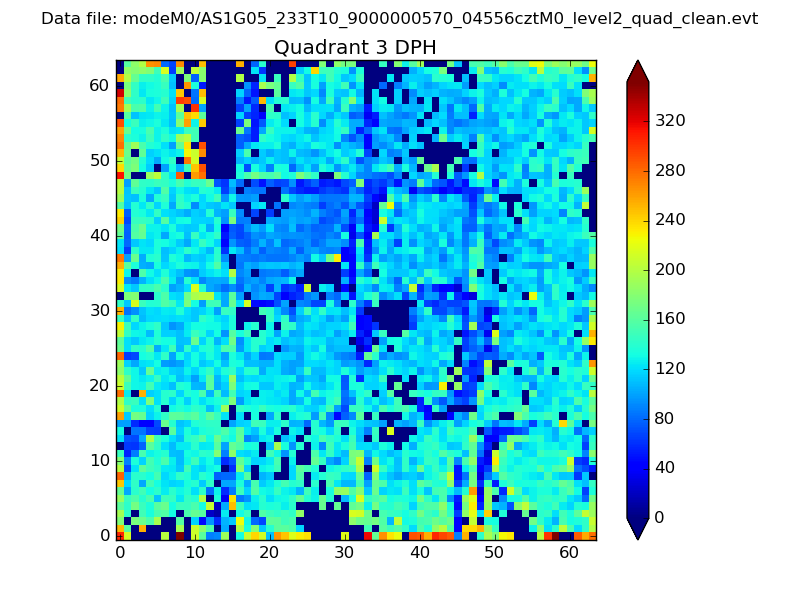 |
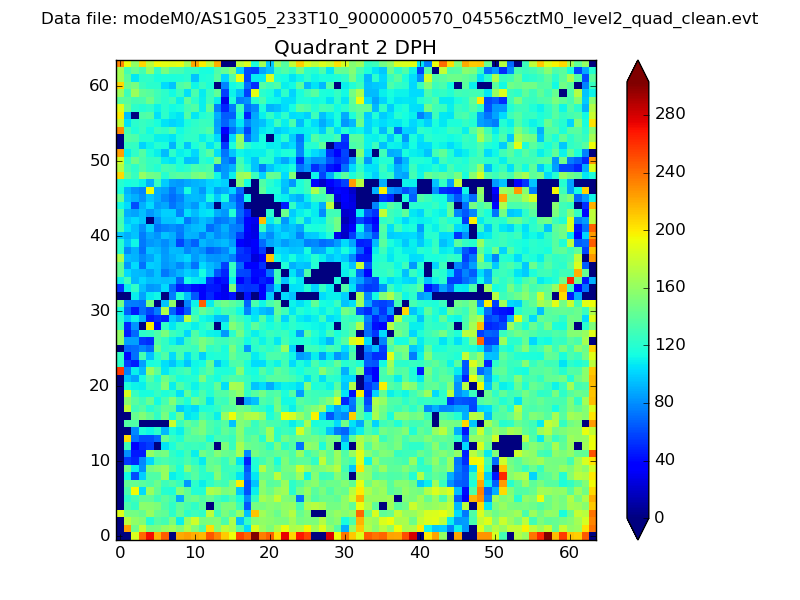 |
Quadrant C |
| Plot type | Count rate plots | Images |
|---|---|---|
| Comparison with Poisson distribution Blue bars denote a histogram of data divided into 1 sec bins. Red curve is a Poisson curve with rate = median count rate of data. |
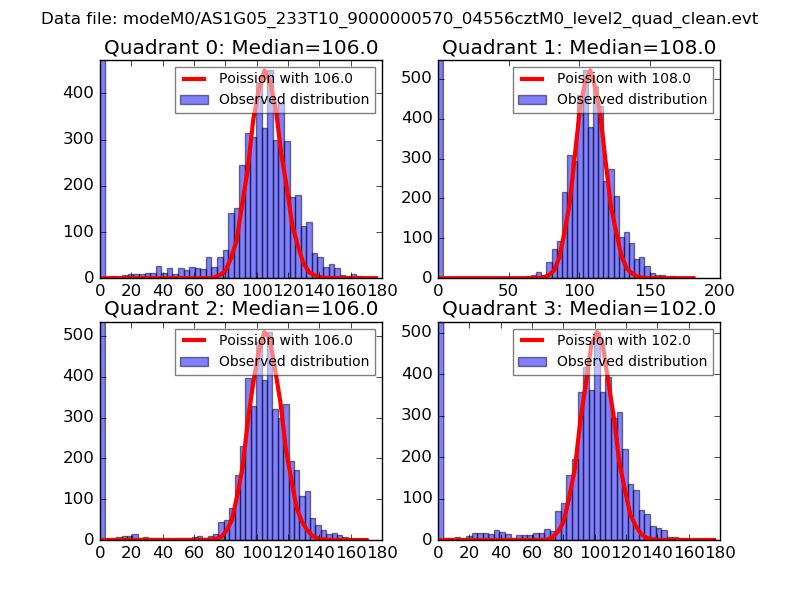 |
 |
| Quadrant-wise count rates Data is divided into 100 sec bins |
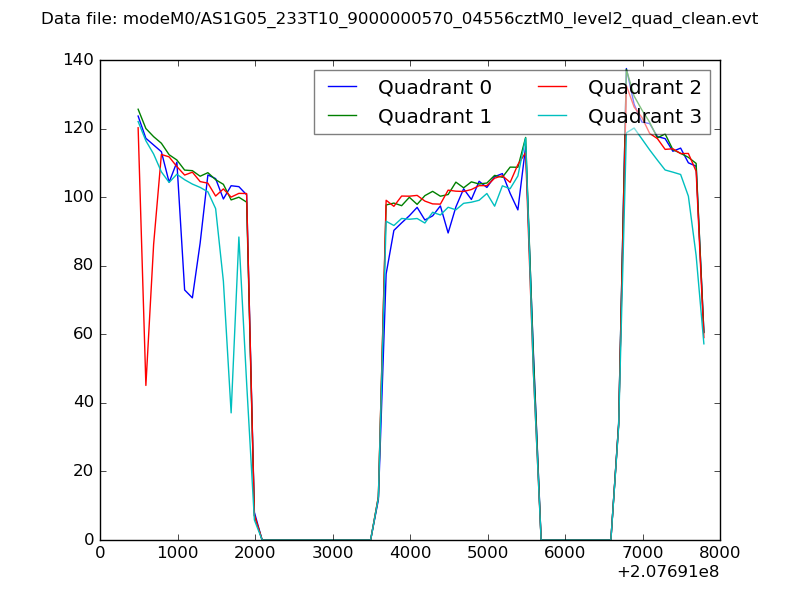 |
|
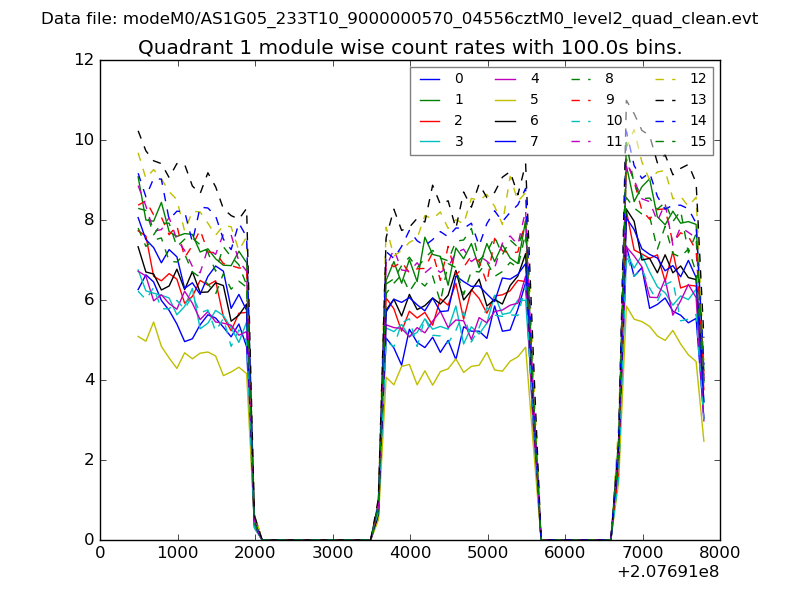
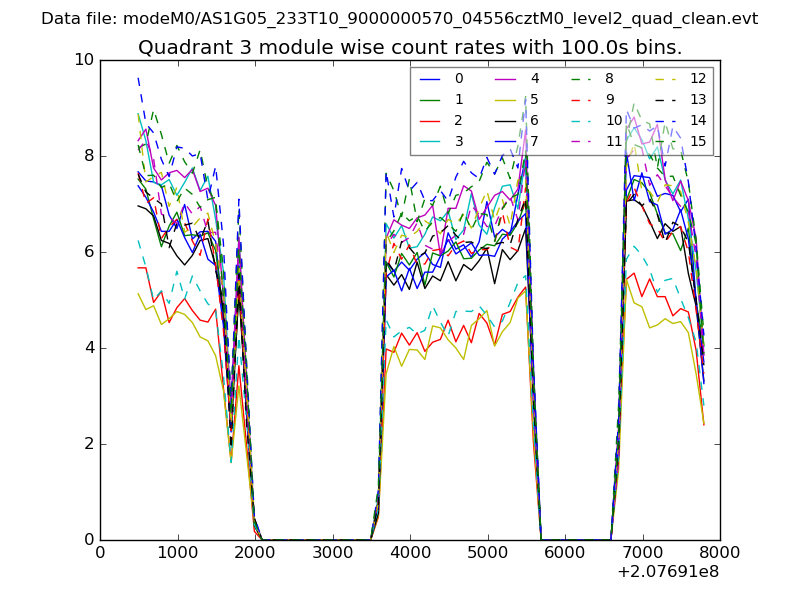
| Module-wise count rates for Quadrant A Data is divided into 100 sec bins |
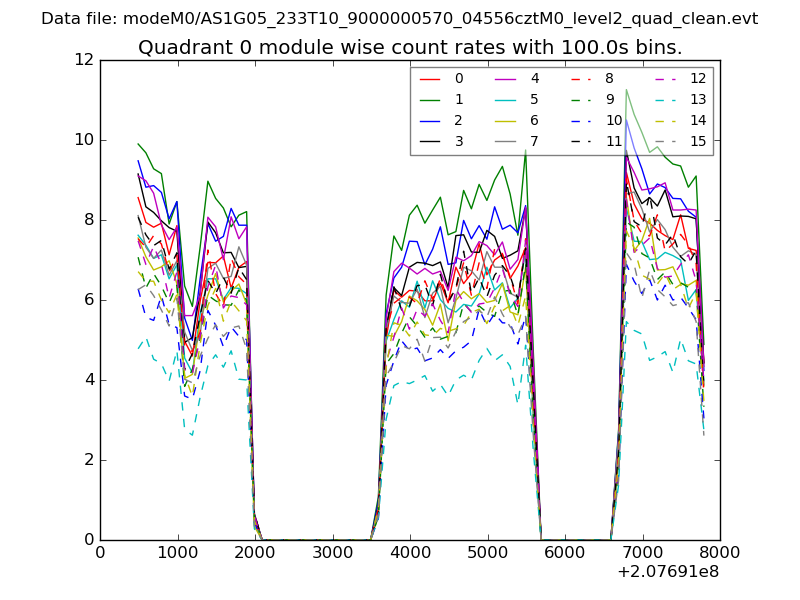 |
 |
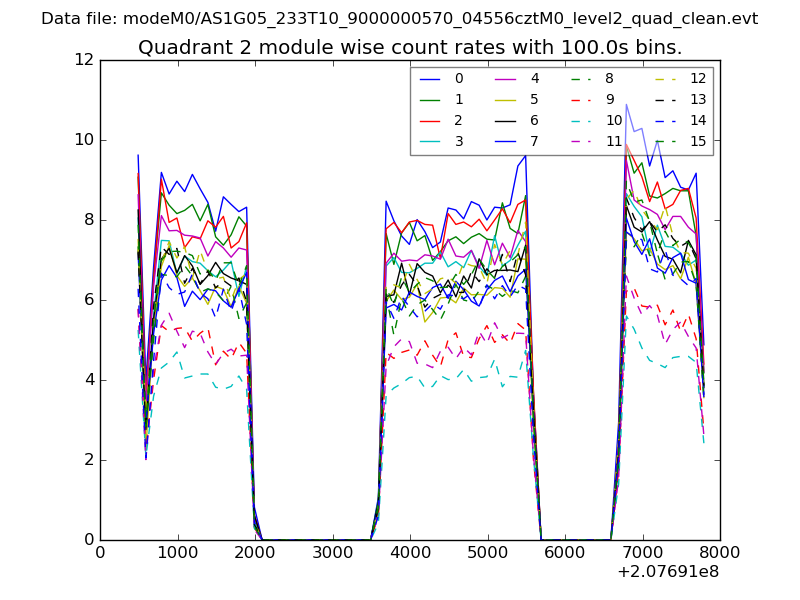
| Module-wise count rates for Quadrant B Data is divided into 100 sec bins |
 |
 |
| Module-wise count rates for Quadrant C Data is divided into 100 sec bins |
 |
 |
| Module-wise count rates for Quadrant D Data is divided into 100 sec bins |
 |
 |
| Parameter | Plot |
|---|---|
| CZT HV Monitor | 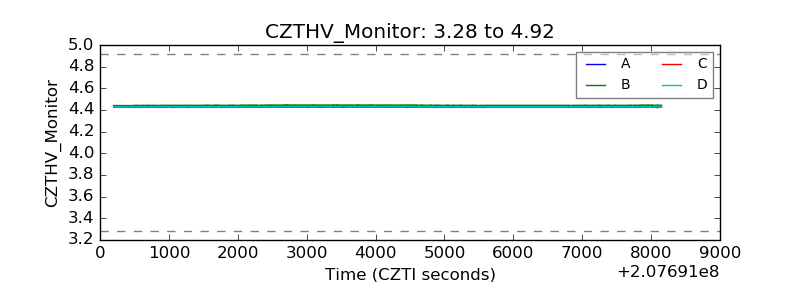 |
| D_VDD |  |
| Temperature 1 | 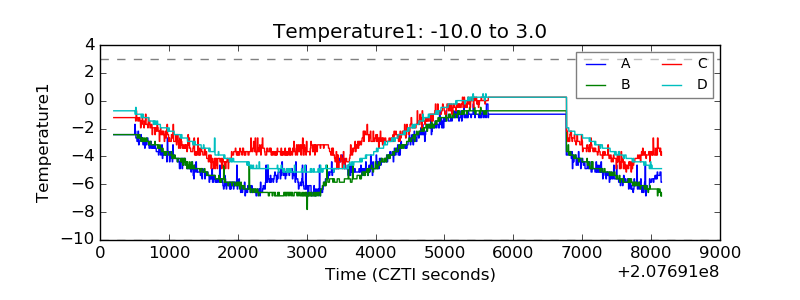 |
| Veto HV Monitor | 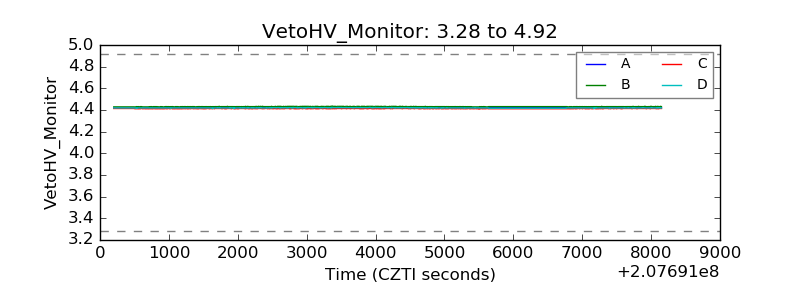 |
| Veto LLD | 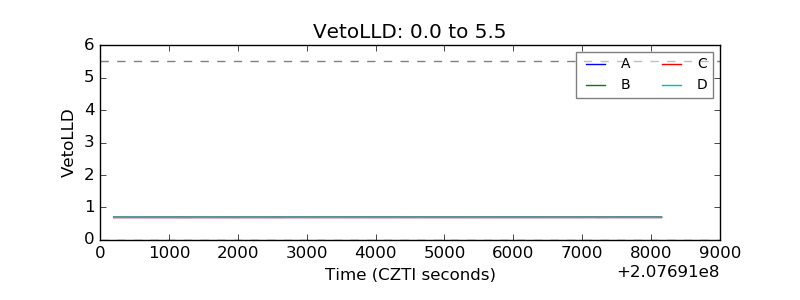 |
| Alpha Counter | 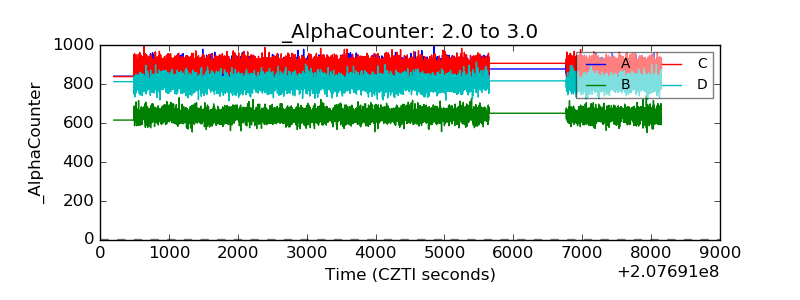 |
| _CPM_Rate | 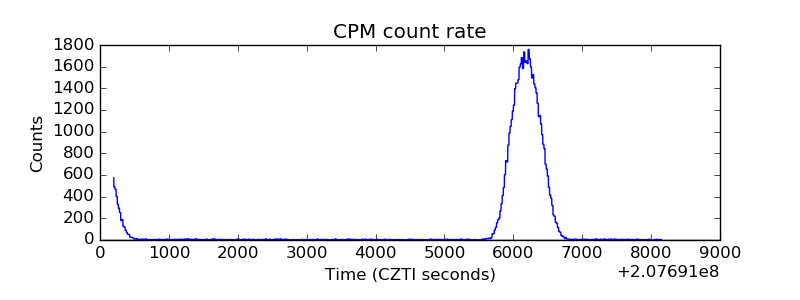 |
| CZT Counter | 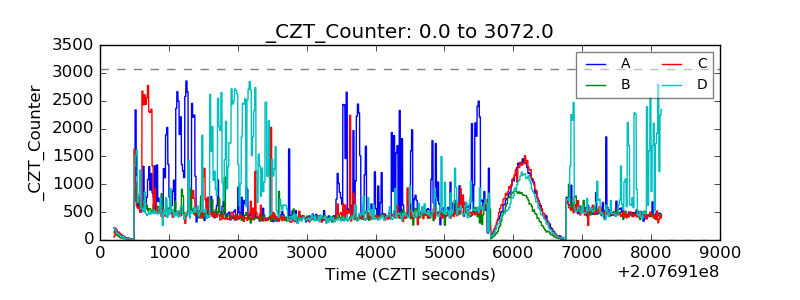 |
| +2.5 Volts monitor |  |
| +5 Volts monitor |  |
| _ROLL_ROT | 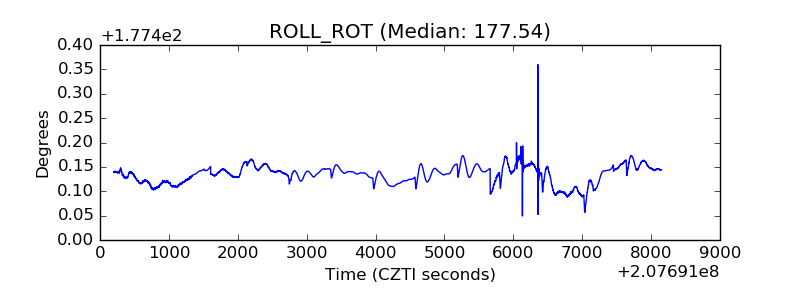 |
| _Roll_DEC | 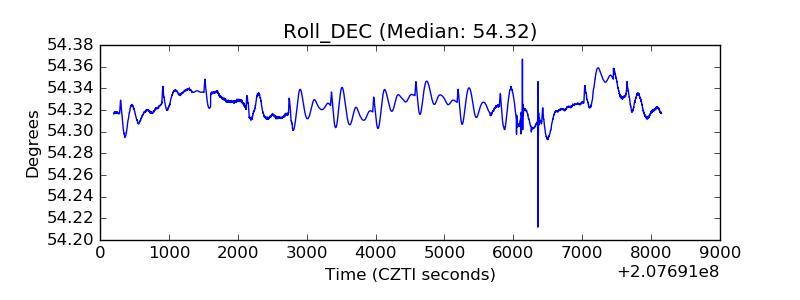 |
| _Roll_RA | 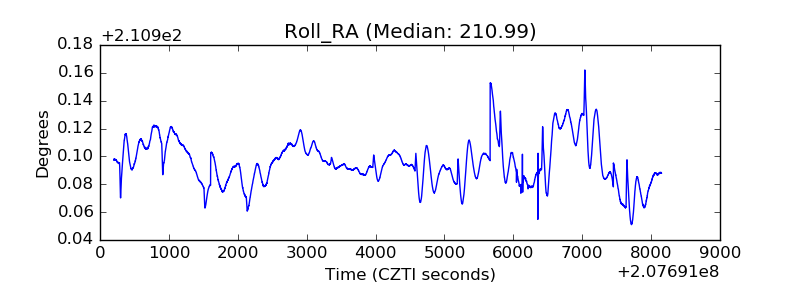 |
| Veto Counter | 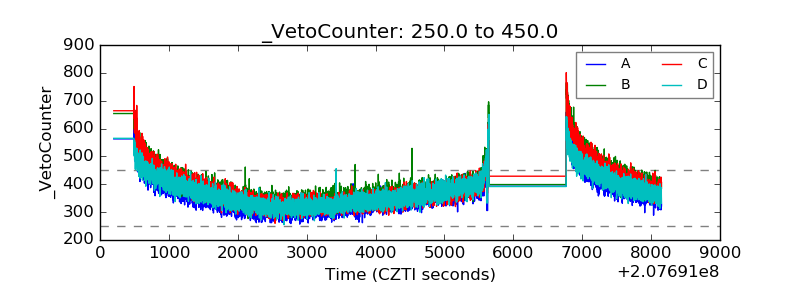 |