| Param | Original file | Final file |
|---|---|---|
| Filename | modeM0/AS1G05_233T10_9000000570_04561cztM0_level2.evt | modeM0/AS1G05_233T10_9000000570_04561cztM0_level2_quad_clean.evt |
| Size (bytes) | 545,132,160 | 77,371,200 |
| Size | 519.9 MB | 73.8 MB |
| Events in quadrant A | 3,205,344 | 496,007 |
| Events in quadrant B | 3,243,772 | 495,102 |
| Events in quadrant C | 3,810,045 | 484,656 |
| Events in quadrant D | 5,813,959 | 418,213 |
| Mode M9 | |||
|---|---|---|---|
| Quadrant | BADHDUFLAG | Total packets | Discarded packets |
| A | 0 | 10 | 0 |
| B | 0 | 10 | 0 |
| C | 0 | 10 | 0 |
| D | 0 | 10 | 0 |
| Mode M0 | |||
|---|---|---|---|
| Quadrant | BADHDUFLAG | Total packets | Discarded packets |
| A | 0 | 13918 | 2 |
| B | 0 | 13872 | 1 |
| C | 0 | 15720 | 1 |
| D | 0 | 21876 | 1 |
| Mode SS | |||
|---|---|---|---|
| Quadrant | BADHDUFLAG | Total packets | Discarded packets |
| A | 0 | 130 | 0 |
| B | 0 | 130 | 0 |
| C | 0 | 130 | 0 |
| D | 0 | 130 | 0 |
| Quadrant | Total seconds | Saturated seconds | Saturation percentage |
|---|---|---|---|
| A | 6428 | 156 | 2.426882% |
| B | 6428 | 151 | 2.349098% |
| C | 6428 | 283 | 4.402614% |
| D | 6428 | 1162 | 18.077162% |
Noise dominated data is calculated using 1-second bins in cleaned event files. If a bin has >2000 counts, and if more than 50% of those come from <1% of pixels, then it is considered to be noise-dominated and hence unusable.
| Quadrant | # 1 sec bins | Bins with >0 counts | Bins with >2000 counts | High rate bins dominated by noise | Noise dominated (total time) | Noise dominated (detector-on time) | Marked lightcurve |
|---|---|---|---|---|---|---|---|
| A | 7403 | 6429 | 22 | 22 | 0.30% | 0.34% | 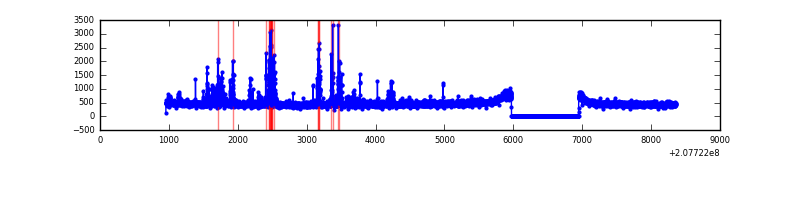 |
| B | 7403 | 6429 | 4 | 4 | 0.05% | 0.06% | 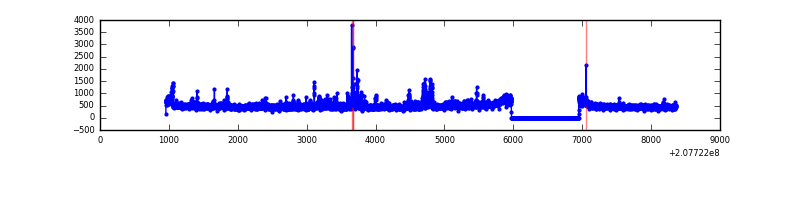 |
| C | 7403 | 6429 | 151 | 151 | 2.04% | 2.35% |  |
| D | 7403 | 6428 | 898 | 898 | 12.13% | 13.97% | 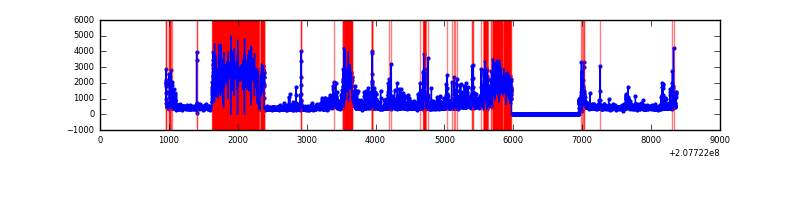 |
Top three noisy pixels from each quadrant. If the there are fewer than three noisy pixels in the level2.evt file, extra rows are filled as -1
| Pixel properties | Quadrant properties | ||||||
|---|---|---|---|---|---|---|---|
| Quadrant | DetID | PixID | Counts | Sigma | Mean | Median | Sigma |
| A | 10 | 253 | 266800 | 1721.75 | 757 | 739 | 154.5 |
| A | 8 | 15 | 18599 | 115.58 | 757 | 739 | 154.5 |
| A | 12 | 194 | 7903 | 46.36 | 757 | 739 | 154.5 |
| B | 14 | 167 | 126170 | 864.16 | 763 | 744 | 145.1 |
| B | 4 | 80 | 66211 | 451.05 | 763 | 744 | 145.1 |
| B | 5 | 70 | 39911 | 269.85 | 763 | 744 | 145.1 |
| C | 14 | 48 | 924500 | 5477.12 | 724 | 726 | 168.7 |
| C | 9 | 247 | 36992 | 215.02 | 724 | 726 | 168.7 |
| C | 8 | 128 | 13530 | 75.92 | 724 | 726 | 168.7 |
| D | 13 | 235 | 2363461 | 14988.66 | 654 | 634 | 157.6 |
| D | 8 | 112 | 329290 | 2084.84 | 654 | 634 | 157.6 |
| D | 7 | 67 | 286122 | 1811.0 | 654 | 634 | 157.6 |
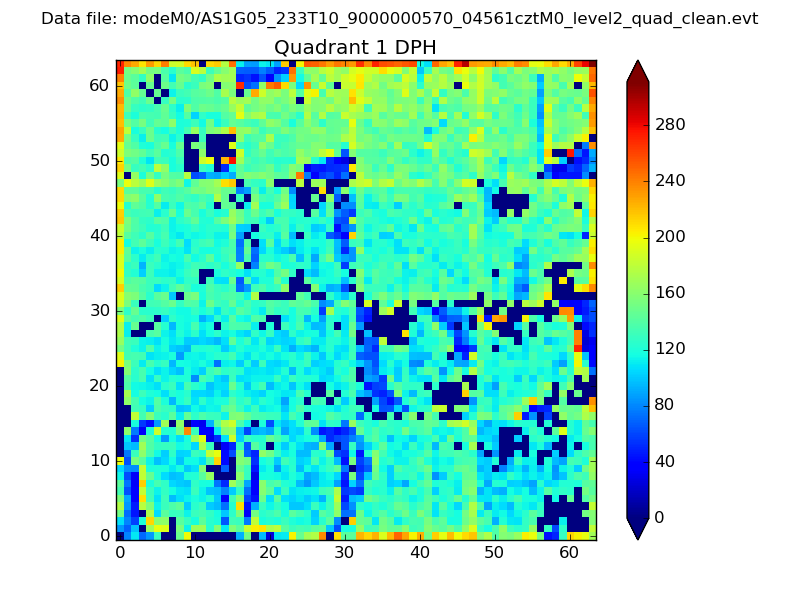
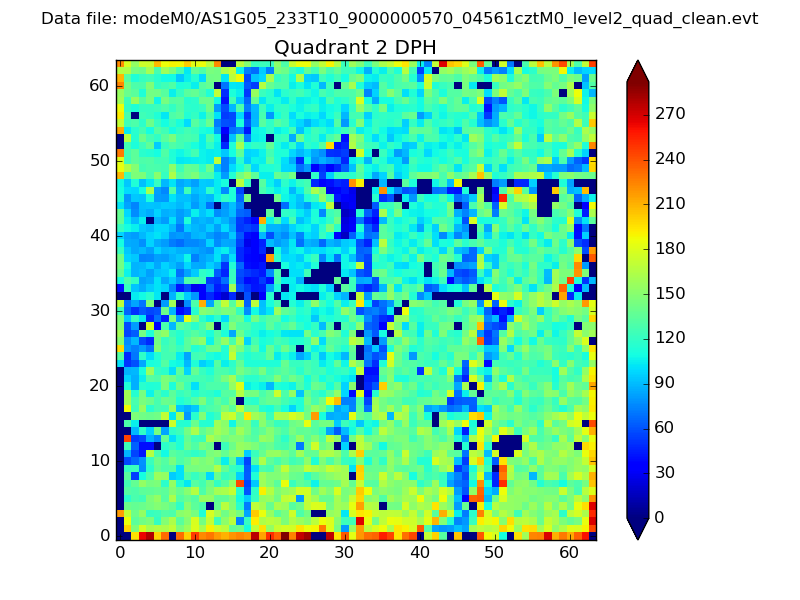
Histogram calculated using DETX and DETY for each event in the final _common_clean file
| Quadrant A | 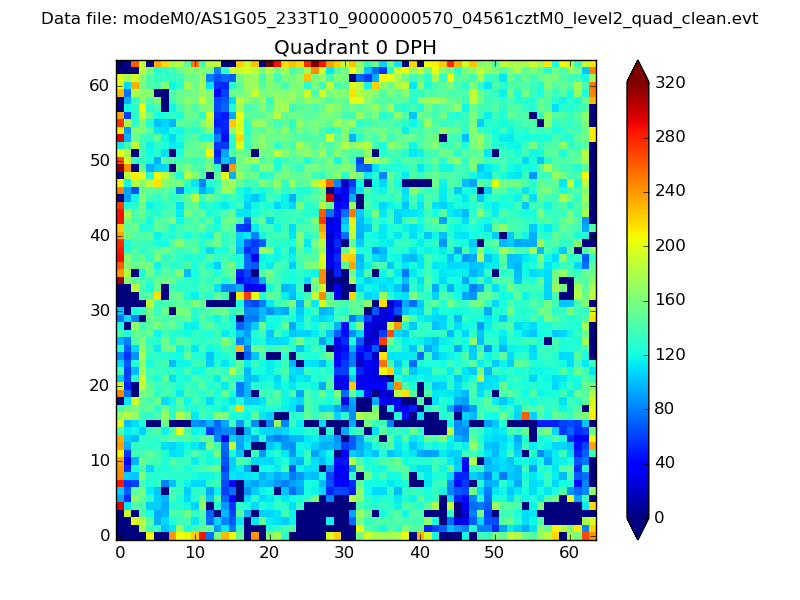 |
 |
Quadrant B |
|---|---|---|---|
| Quadrant D | 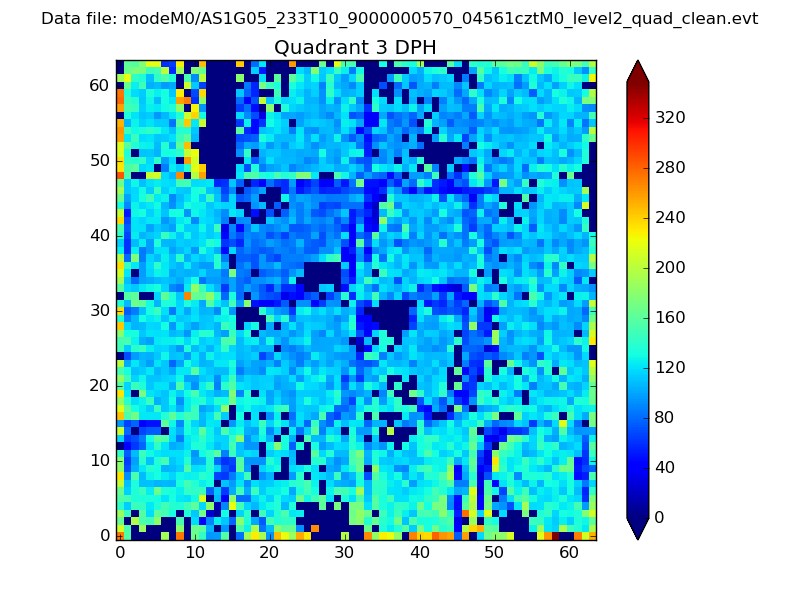 |
 |
Quadrant C |
| Plot type | Count rate plots | Images |
|---|---|---|
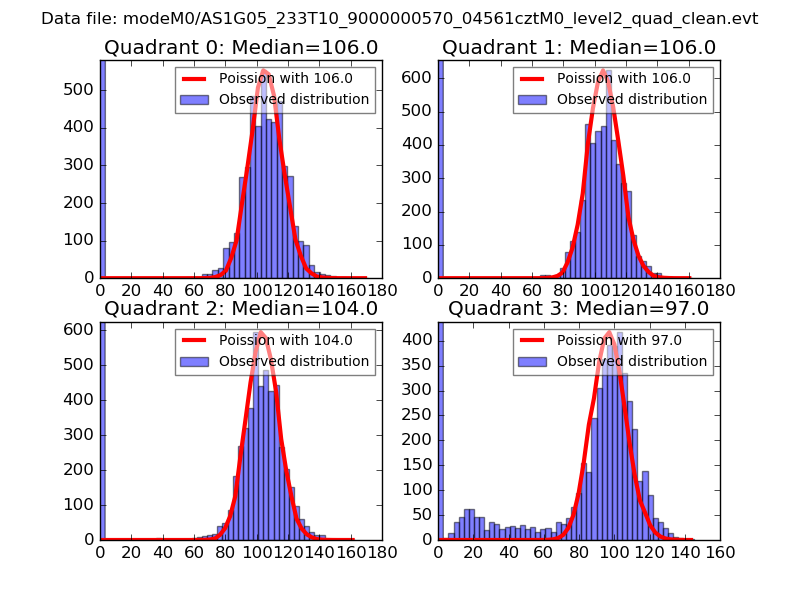
| Comparison with Poisson distribution Blue bars denote a histogram of data divided into 1 sec bins. Red curve is a Poisson curve with rate = median count rate of data. |
 |
 |
| Quadrant-wise count rates Data is divided into 100 sec bins |
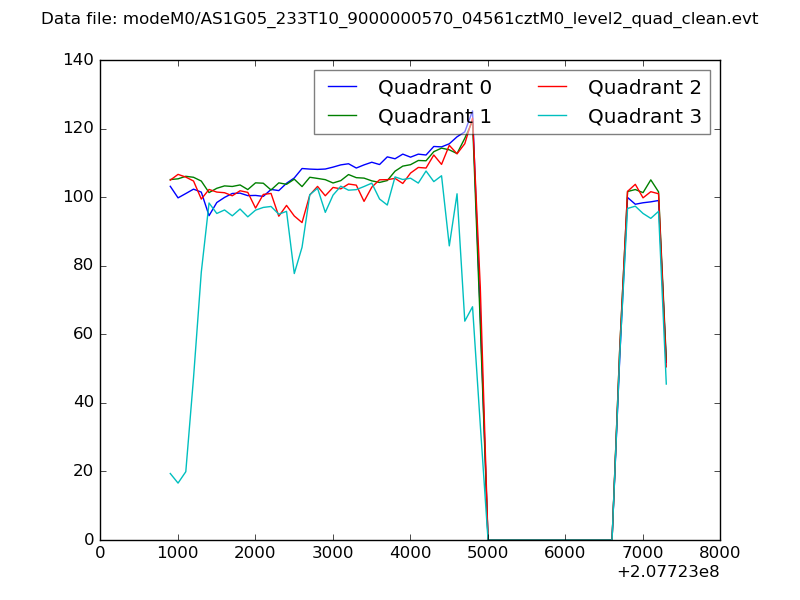 |
|
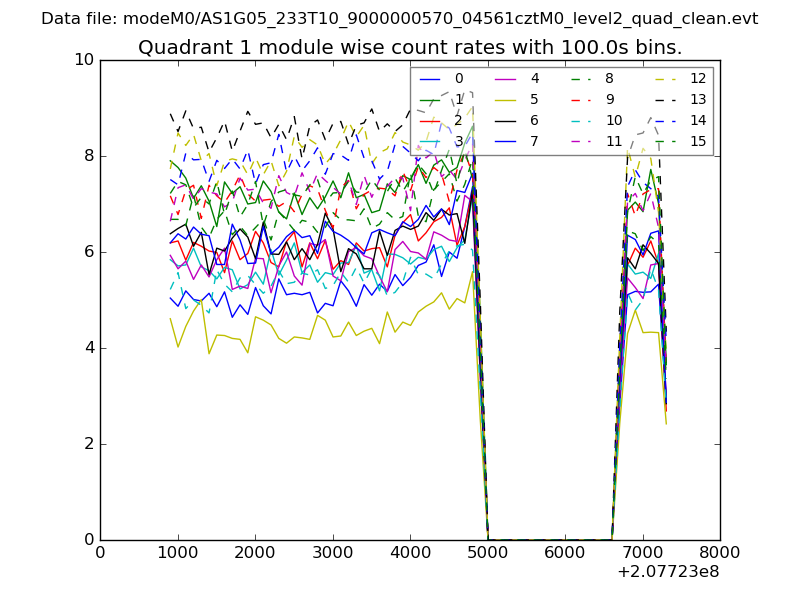
| Module-wise count rates for Quadrant A Data is divided into 100 sec bins |
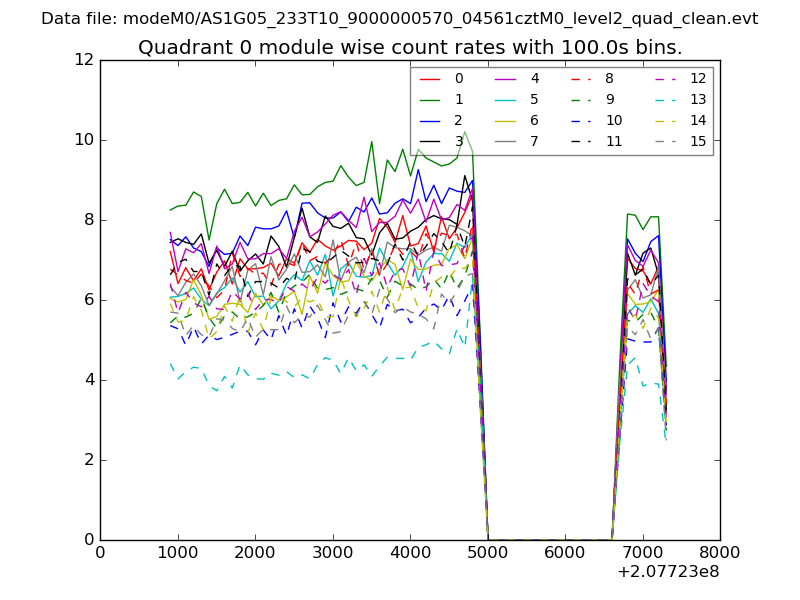 |
 |
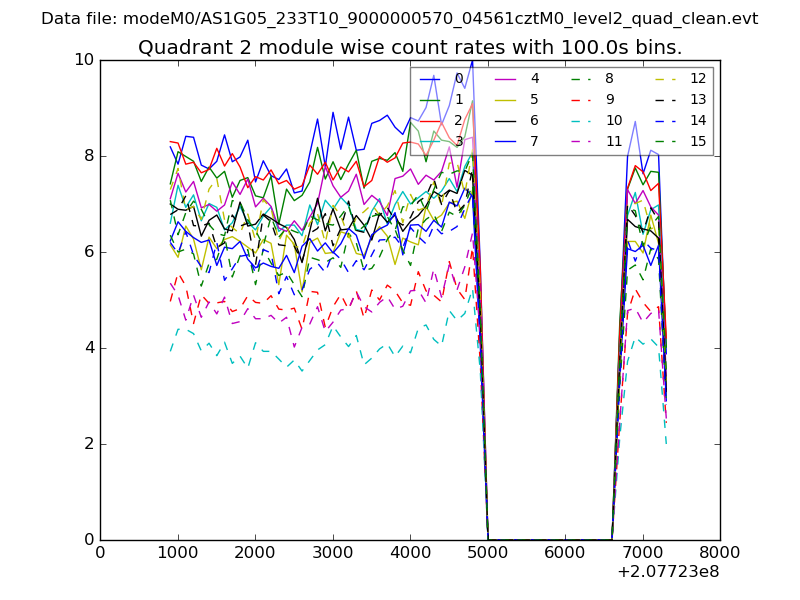
| Module-wise count rates for Quadrant B Data is divided into 100 sec bins |
 |
 |
| Module-wise count rates for Quadrant C Data is divided into 100 sec bins |
 |
 |
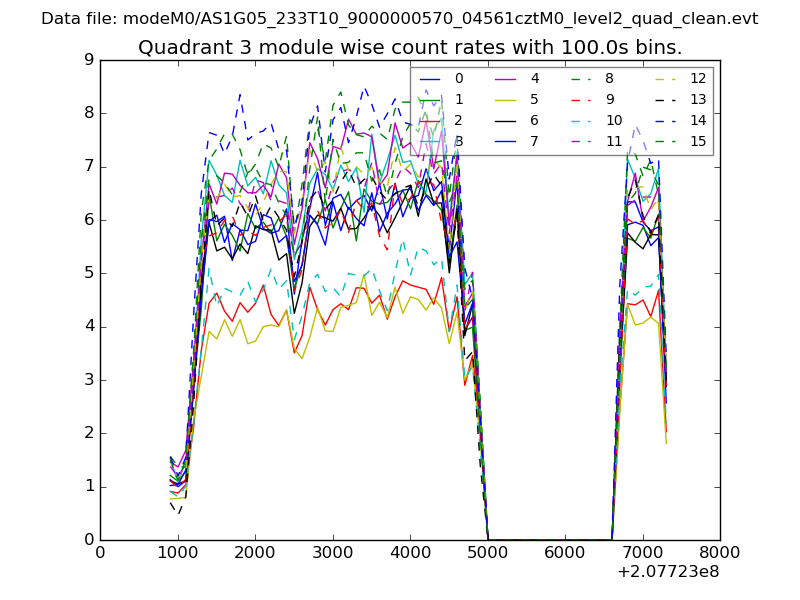
| Module-wise count rates for Quadrant D Data is divided into 100 sec bins |
 |
 |
| Parameter | Plot |
|---|---|
| CZT HV Monitor | 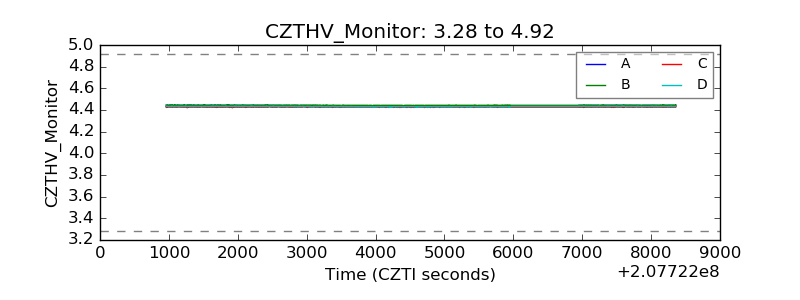 |
| D_VDD | 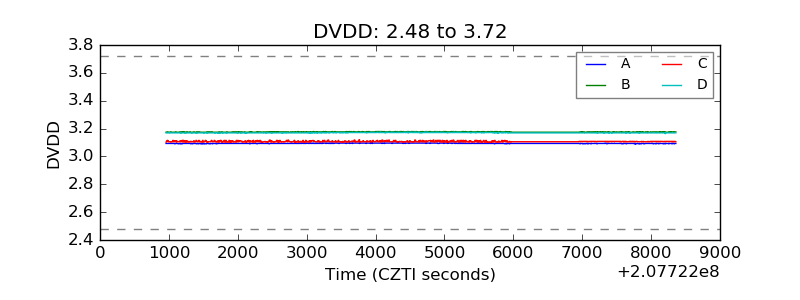 |
| Temperature 1 | 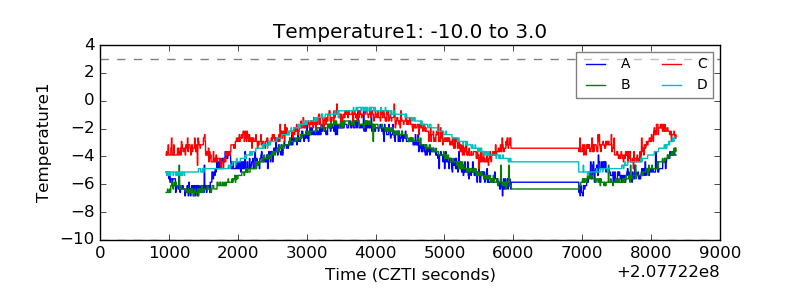 |
| Veto HV Monitor | 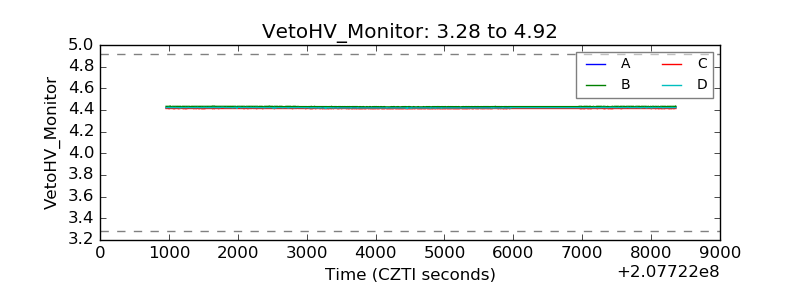 |
| Veto LLD | 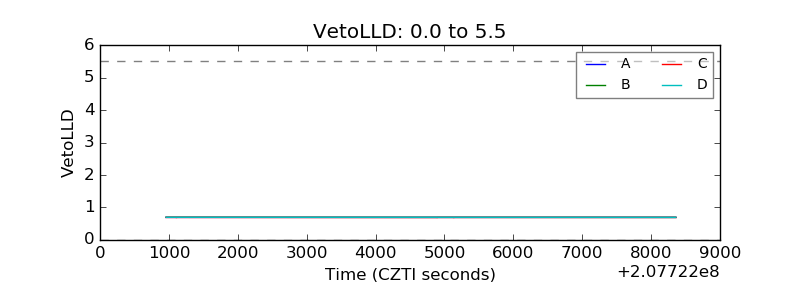 |
| Alpha Counter | 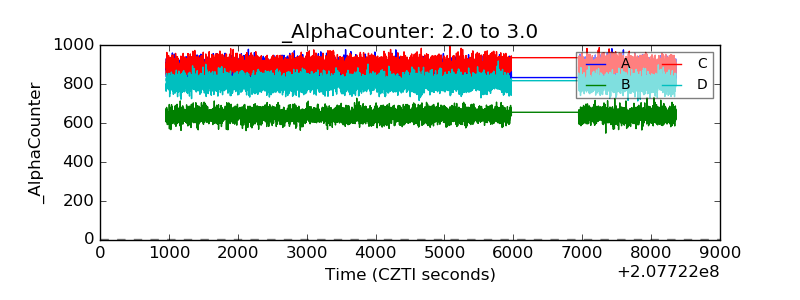 |
| _CPM_Rate | 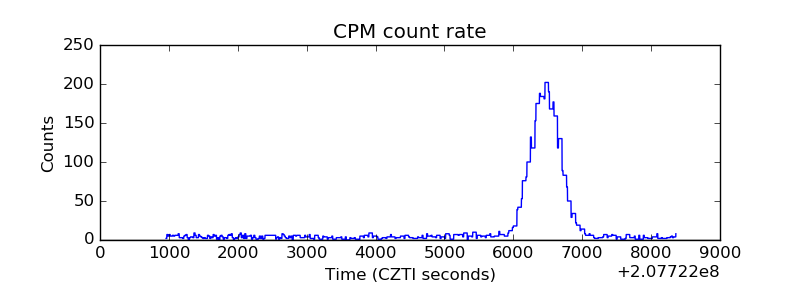 |
| CZT Counter | 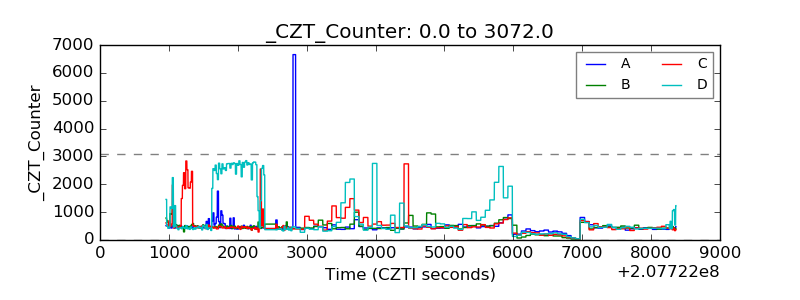 |
| +2.5 Volts monitor |  |
| +5 Volts monitor |  |
| _ROLL_ROT | 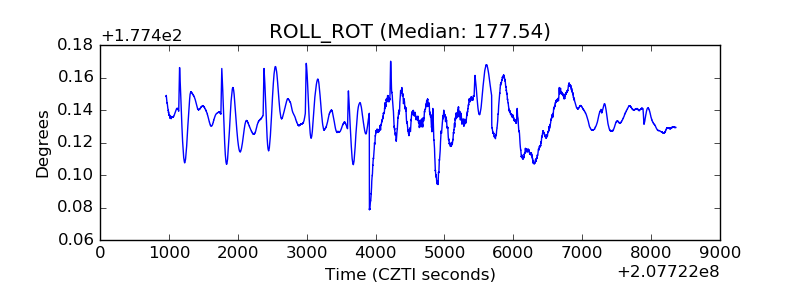 |
| _Roll_DEC | 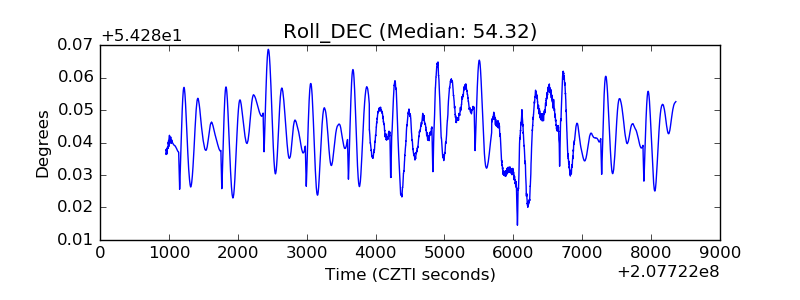 |
| _Roll_RA | 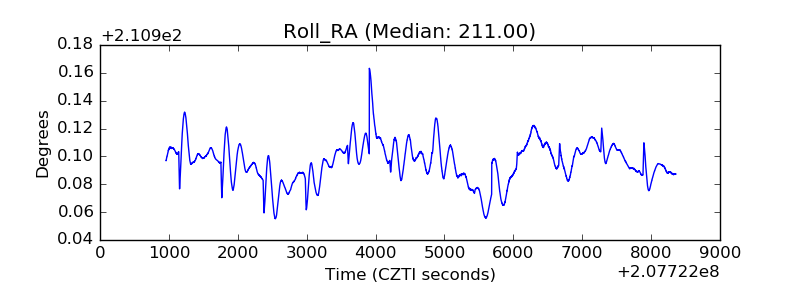 |
| Veto Counter | 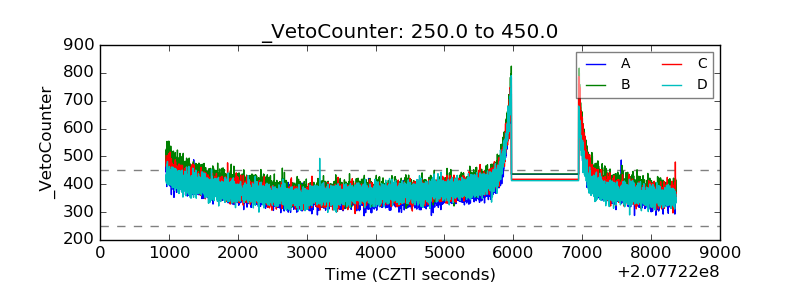 |