| Param | Original file | Final file |
|---|---|---|
| Filename | modeM0/AS1G05_233T10_9000000570_04562cztM0_level2.evt | modeM0/AS1G05_233T10_9000000570_04562cztM0_level2_quad_clean.evt |
| Size (bytes) | 482,780,160 | 84,896,640 |
| Size | 460.4 MB | 81.0 MB |
| Events in quadrant A | 3,021,813 | 540,527 |
| Events in quadrant B | 3,450,623 | 533,951 |
| Events in quadrant C | 2,941,596 | 533,329 |
| Events in quadrant D | 4,755,180 | 499,412 |
| Mode M9 | |||
|---|---|---|---|
| Quadrant | BADHDUFLAG | Total packets | Discarded packets |
| A | 0 | 6 | 0 |
| B | 0 | 6 | 0 |
| C | 0 | 6 | 0 |
| D | 0 | 6 | 0 |
| Mode M0 | |||
|---|---|---|---|
| Quadrant | BADHDUFLAG | Total packets | Discarded packets |
| A | 0 | 13723 | 3 |
| B | 0 | 14785 | 2 |
| C | 0 | 13692 | 2 |
| D | 0 | 18788 | 2 |
| Mode SS | |||
|---|---|---|---|
| Quadrant | BADHDUFLAG | Total packets | Discarded packets |
| A | 0 | 136 | 0 |
| B | 0 | 136 | 0 |
| C | 0 | 136 | 0 |
| D | 0 | 136 | 0 |
| Quadrant | Total seconds | Saturated seconds | Saturation percentage |
|---|---|---|---|
| A | 6644 | 154 | 2.317881% |
| B | 6644 | 226 | 3.401565% |
| C | 6644 | 113 | 1.700783% |
| D | 6644 | 389 | 5.854907% |
Noise dominated data is calculated using 1-second bins in cleaned event files. If a bin has >2000 counts, and if more than 50% of those come from <1% of pixels, then it is considered to be noise-dominated and hence unusable.
| Quadrant | # 1 sec bins | Bins with >0 counts | Bins with >2000 counts | High rate bins dominated by noise | Noise dominated (total time) | Noise dominated (detector-on time) | Marked lightcurve |
|---|---|---|---|---|---|---|---|
| A | 7234 | 6646 | 5 | 5 | 0.07% | 0.08% | 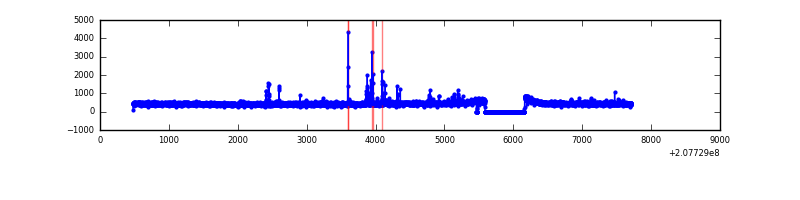 |
| B | 7234 | 6646 | 58 | 58 | 0.80% | 0.87% | 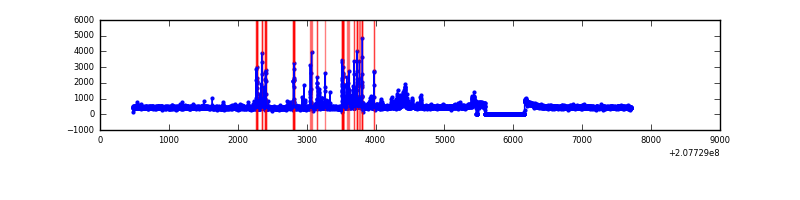 |
| C | 7234 | 6646 | 1 | 1 | 0.01% | 0.02% | 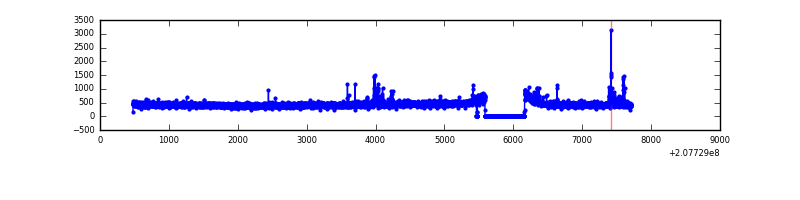 |
| D | 7234 | 6645 | 311 | 311 | 4.30% | 4.68% | 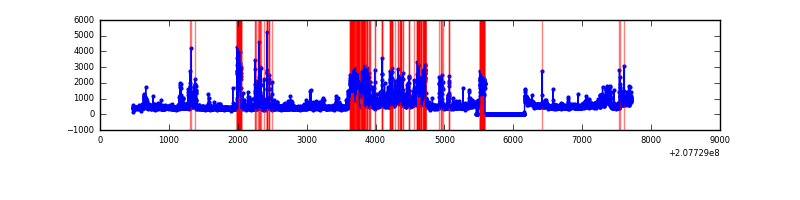 |
Top three noisy pixels from each quadrant. If the there are fewer than three noisy pixels in the level2.evt file, extra rows are filled as -1
| Pixel properties | Quadrant properties | ||||||
|---|---|---|---|---|---|---|---|
| Quadrant | DetID | PixID | Counts | Sigma | Mean | Median | Sigma |
| A | 10 | 253 | 57386 | 363.2 | 759 | 742 | 156.0 |
| A | 0 | 50 | 13903 | 84.39 | 759 | 742 | 156.0 |
| A | 8 | 15 | 12355 | 74.46 | 759 | 742 | 156.0 |
| B | 10 | 16 | 226786 | 1547.89 | 760 | 739 | 146.0 |
| B | 14 | 167 | 140961 | 960.19 | 760 | 739 | 146.0 |
| B | 5 | 70 | 78861 | 534.95 | 760 | 739 | 146.0 |
| C | 9 | 247 | 41656 | 239.42 | 734 | 735 | 170.9 |
| C | 14 | 48 | 30852 | 176.21 | 734 | 735 | 170.9 |
| C | 13 | 61 | 6245 | 32.24 | 734 | 735 | 170.9 |
| D | 2 | 63 | 957181 | 5530.37 | 714 | 691 | 173.0 |
| D | 13 | 235 | 309248 | 1784.06 | 714 | 691 | 173.0 |
| D | 9 | 35 | 260485 | 1502.11 | 714 | 691 | 173.0 |
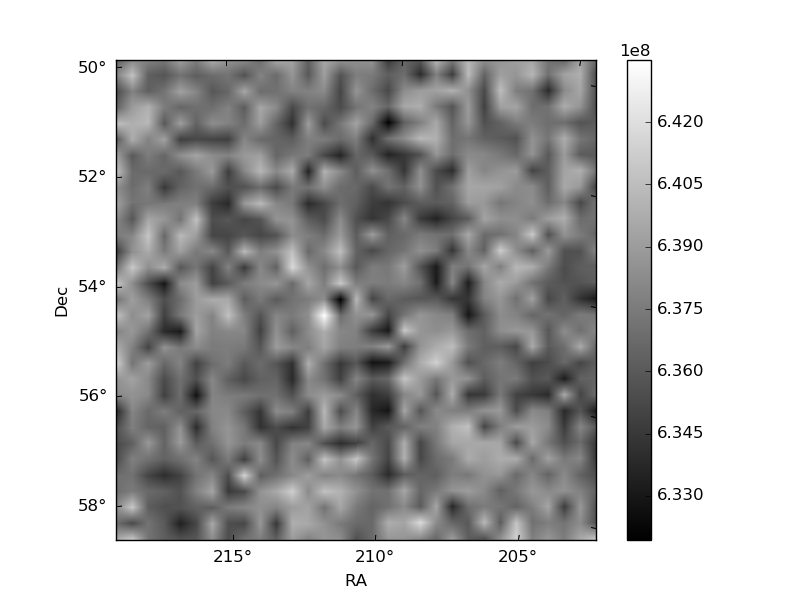
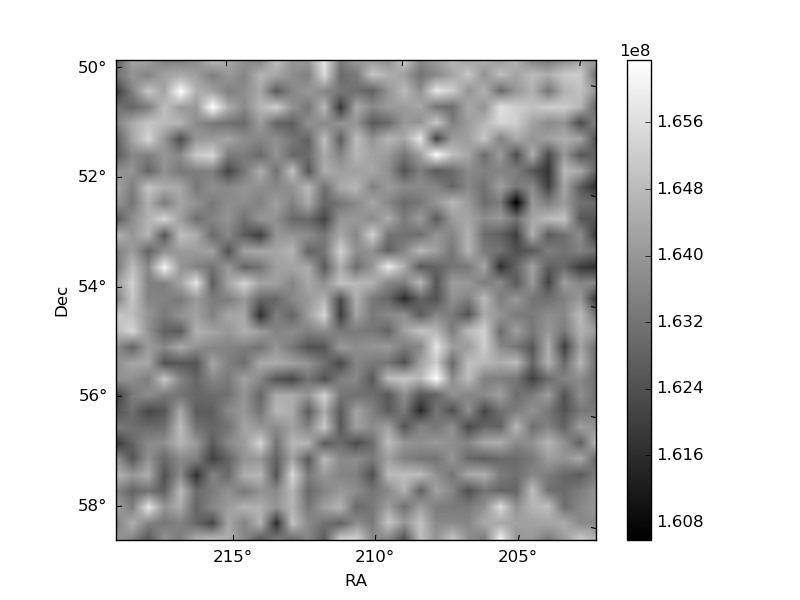
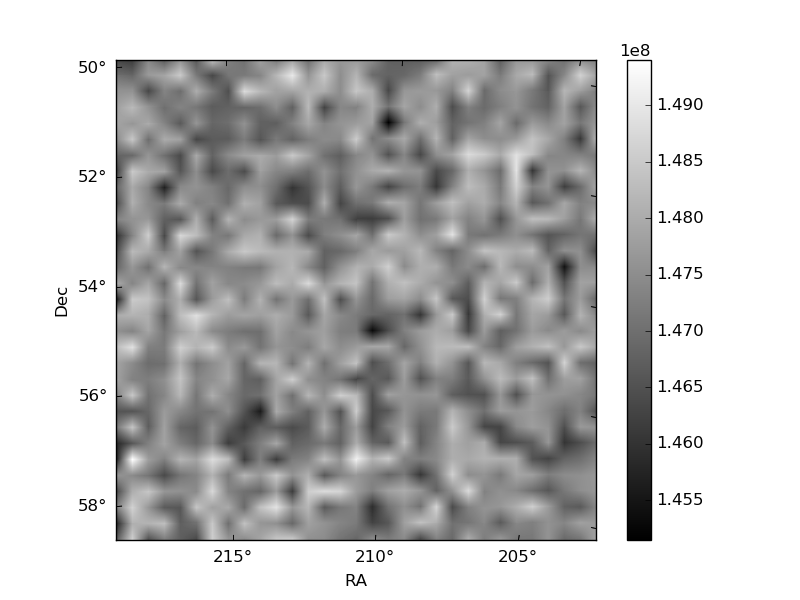
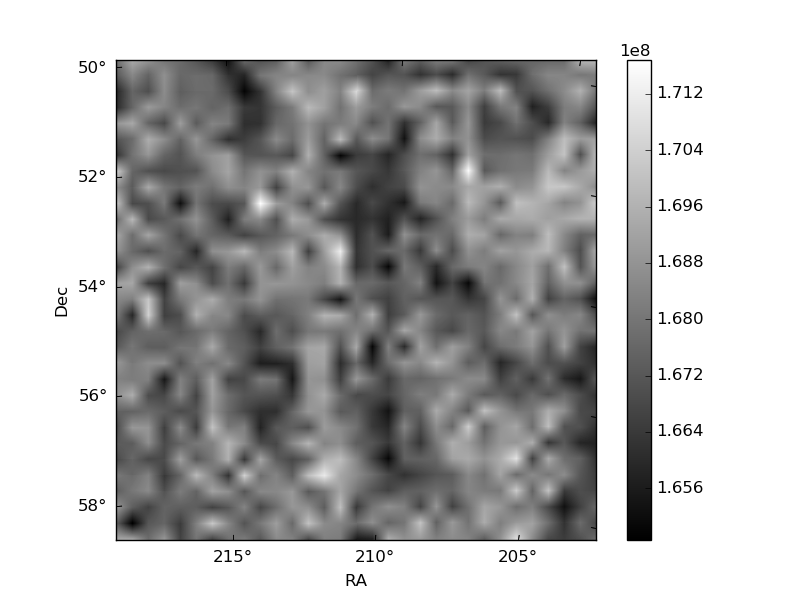
Histogram calculated using DETX and DETY for each event in the final _common_clean file
| Quadrant A | 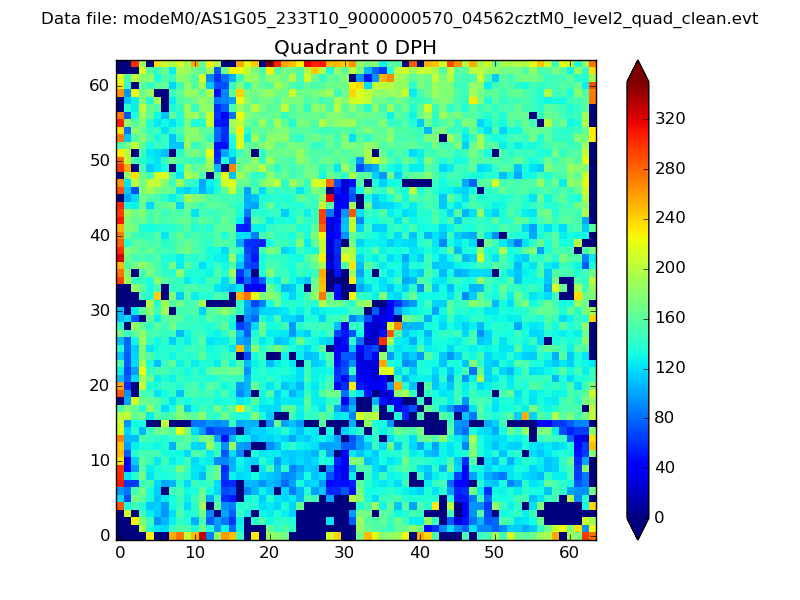 |
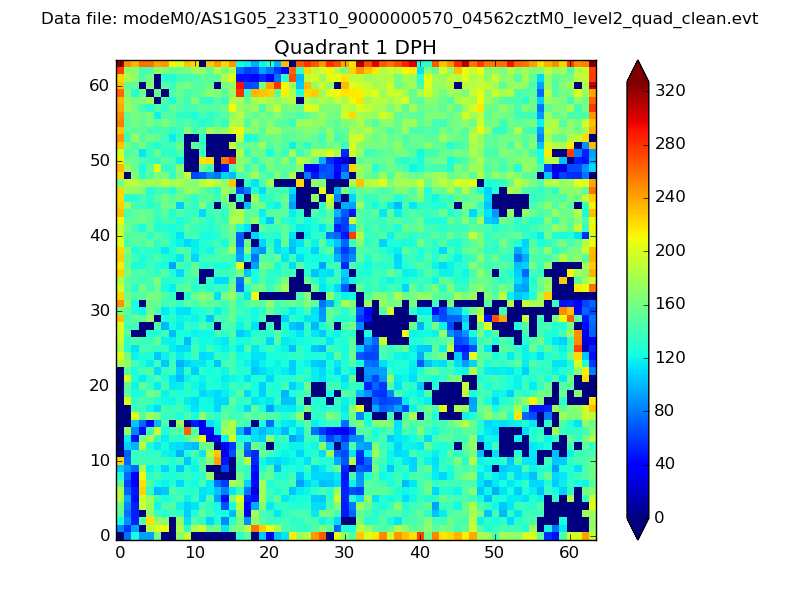 |
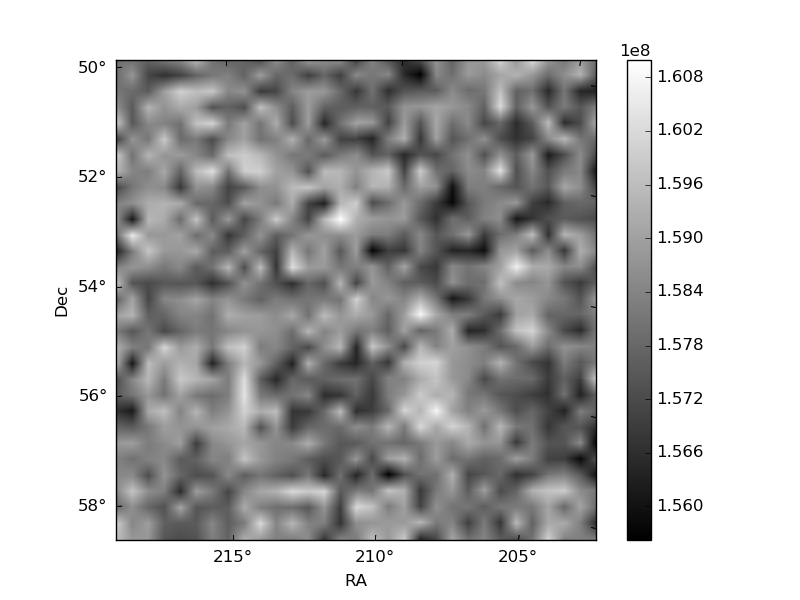
Quadrant B |
|---|---|---|---|
| Quadrant D | 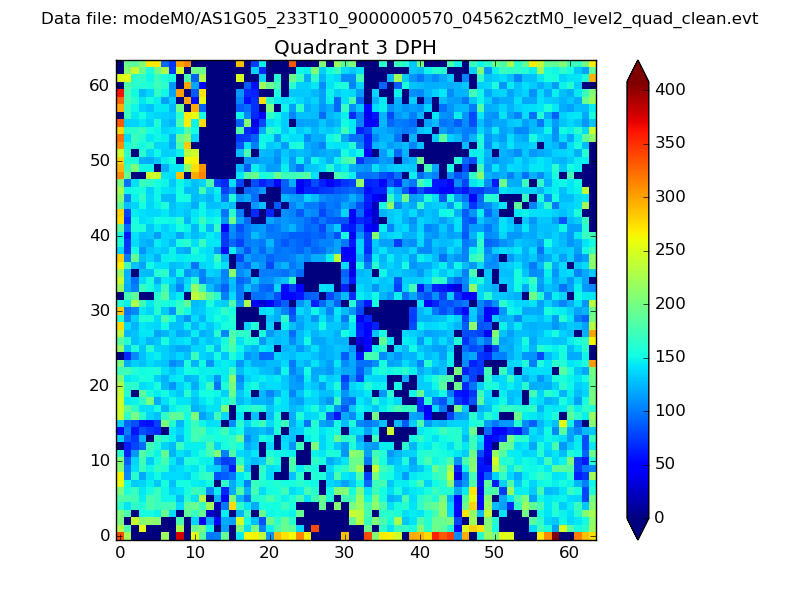 |
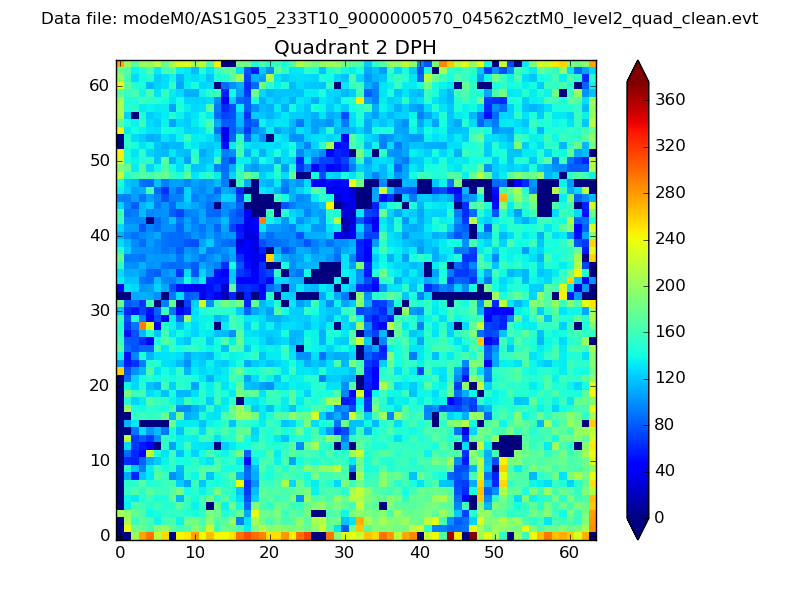 |
Quadrant C |
| Plot type | Count rate plots | Images |
|---|---|---|
| Comparison with Poisson distribution Blue bars denote a histogram of data divided into 1 sec bins. Red curve is a Poisson curve with rate = median count rate of data. |
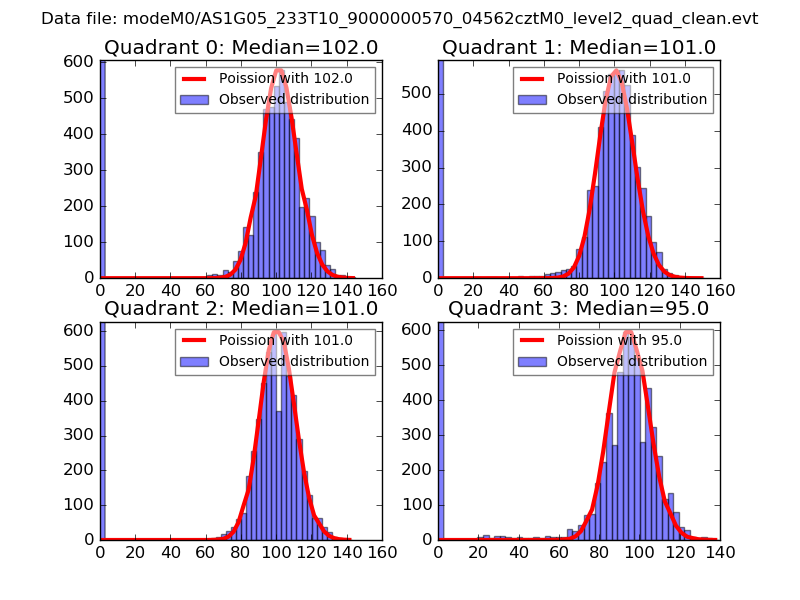 |
 |
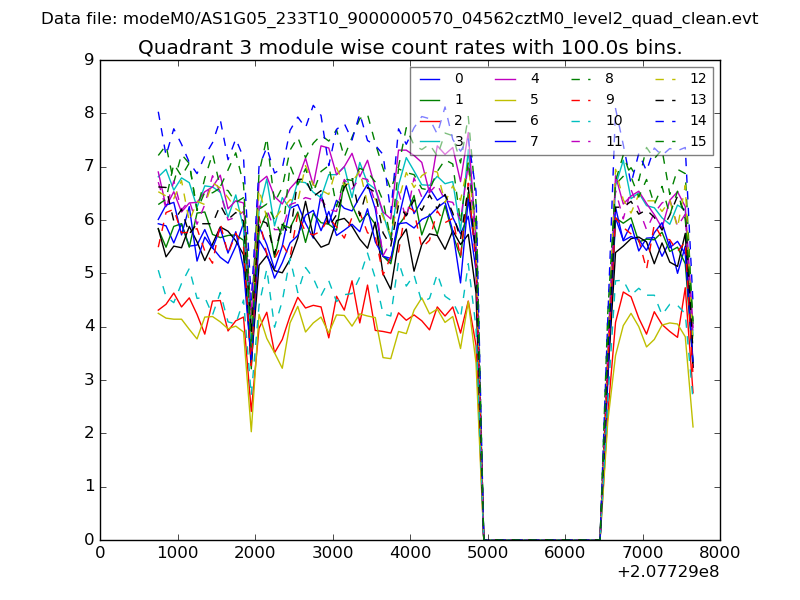
| Quadrant-wise count rates Data is divided into 100 sec bins |
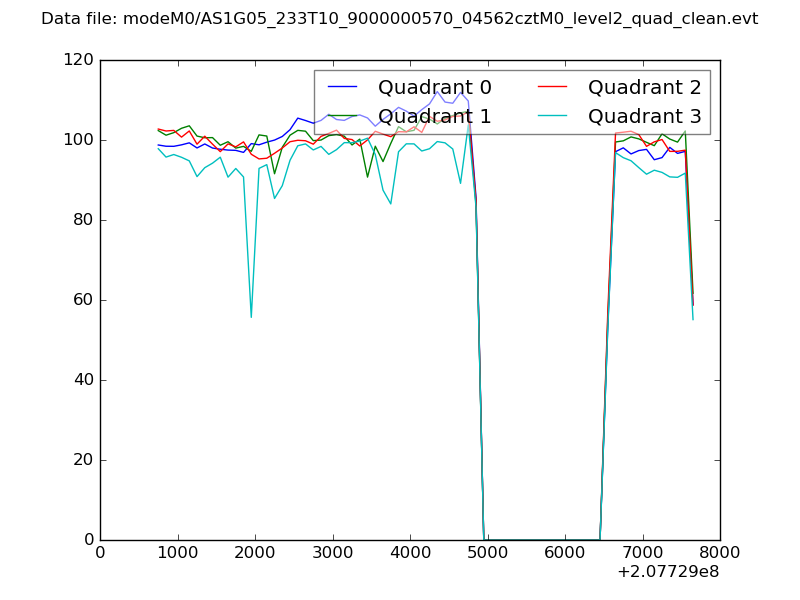 |
|
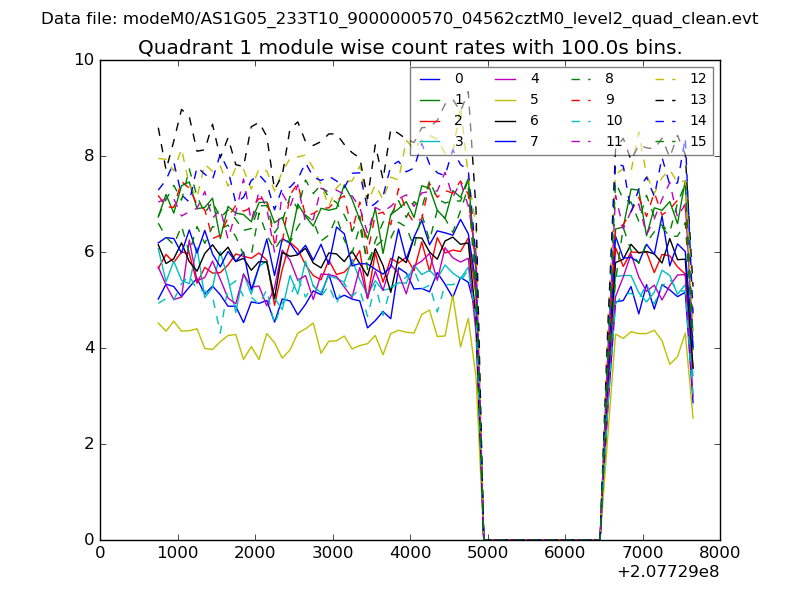
| Module-wise count rates for Quadrant A Data is divided into 100 sec bins |
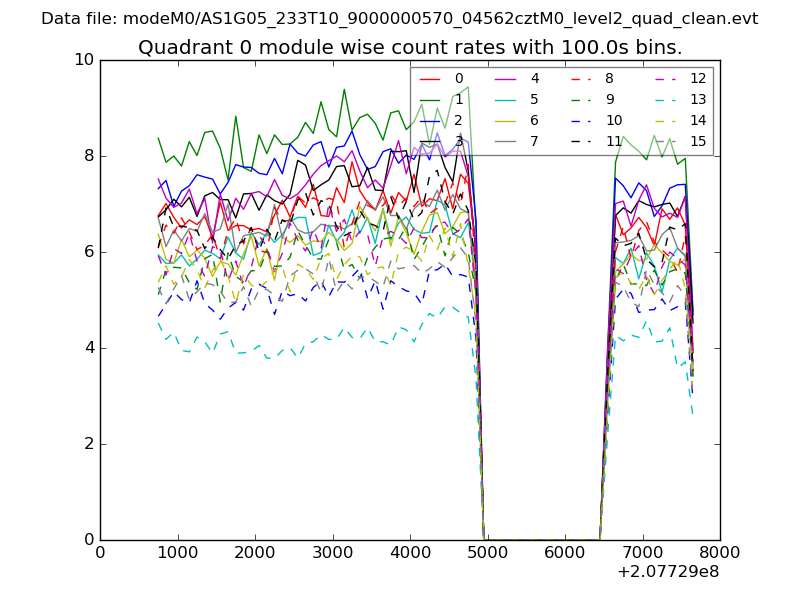 |
 |
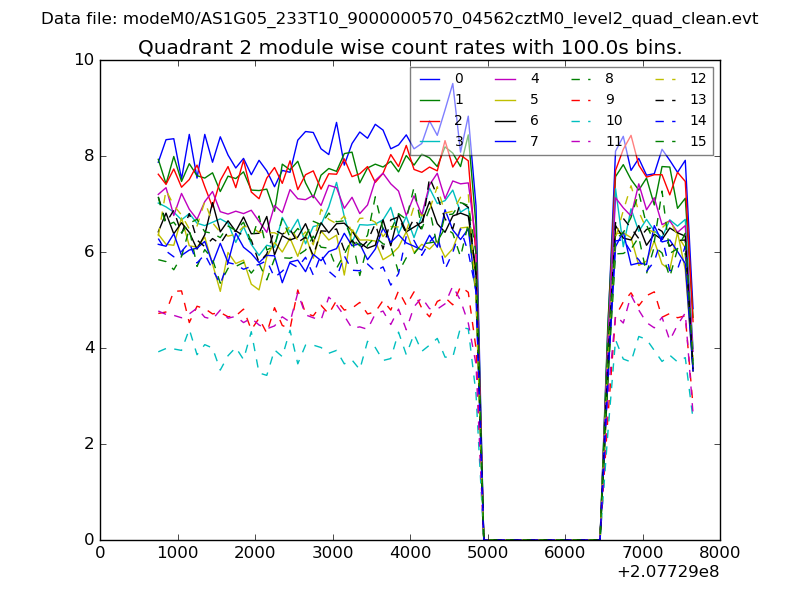
| Module-wise count rates for Quadrant B Data is divided into 100 sec bins |
 |
 |
| Module-wise count rates for Quadrant C Data is divided into 100 sec bins |
 |
 |
| Module-wise count rates for Quadrant D Data is divided into 100 sec bins |
 |
 |
| Parameter | Plot |
|---|---|
| CZT HV Monitor | 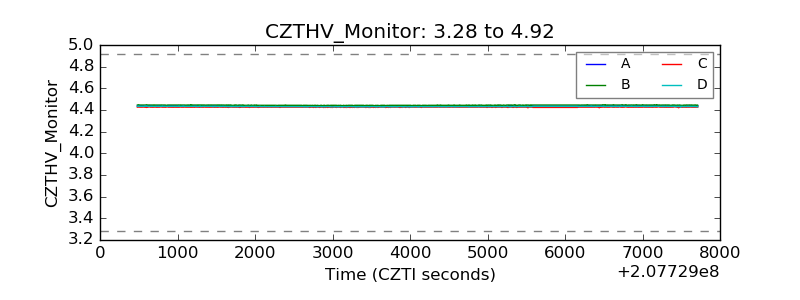 |
| D_VDD | 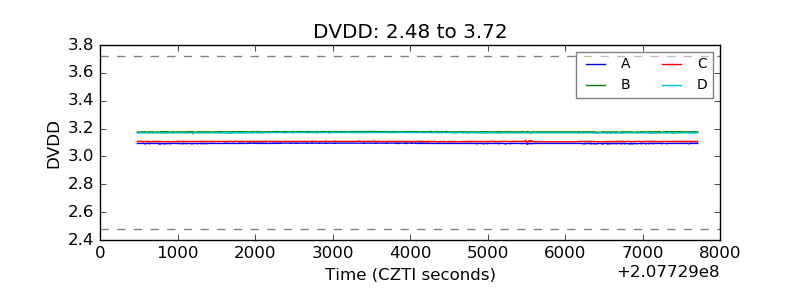 |
| Temperature 1 | 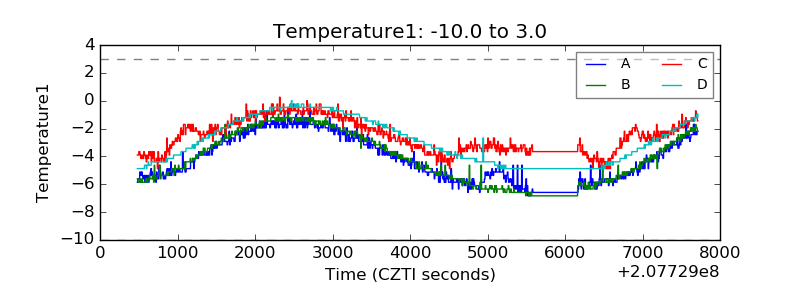 |
| Veto HV Monitor | 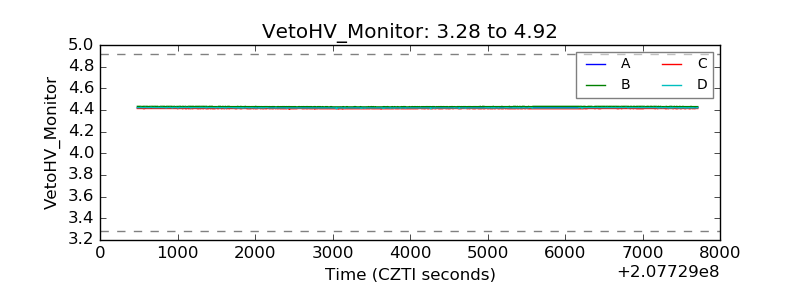 |
| Veto LLD | 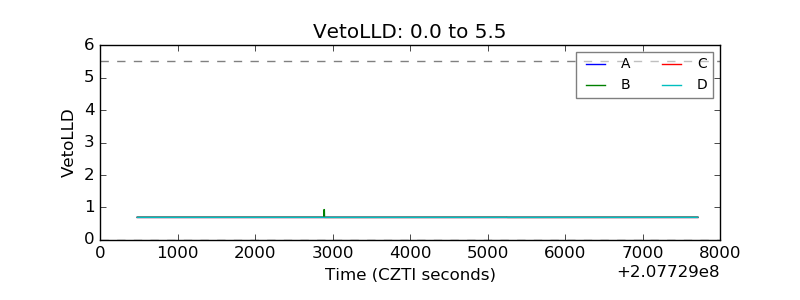 |
| Alpha Counter | 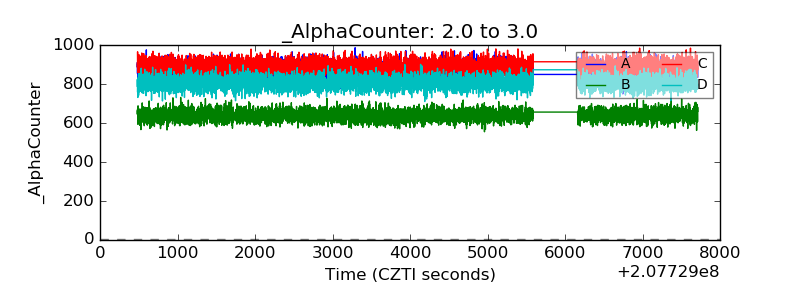 |
| _CPM_Rate | 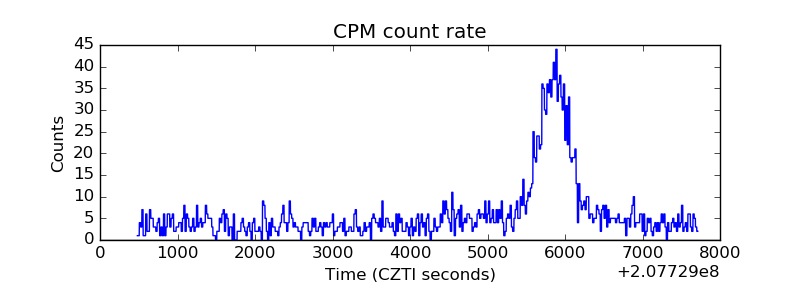 |
| CZT Counter | 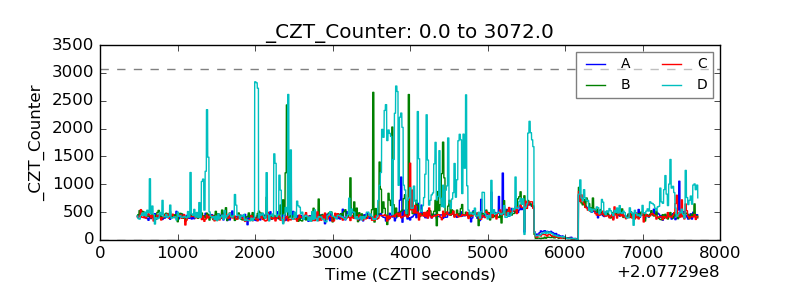 |
| +2.5 Volts monitor |  |
| +5 Volts monitor |  |
| _ROLL_ROT | 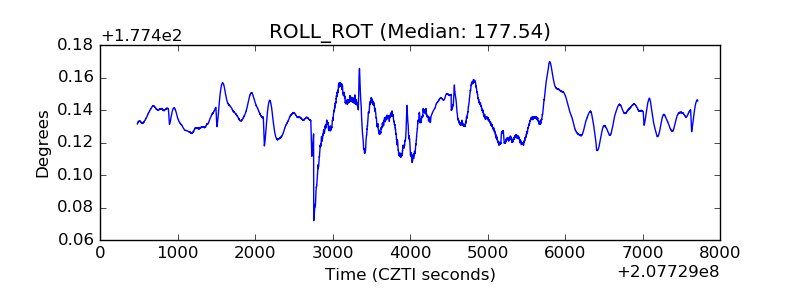 |
| _Roll_DEC | 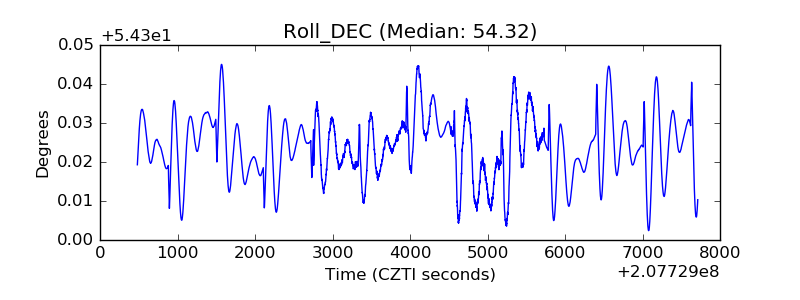 |
| _Roll_RA | 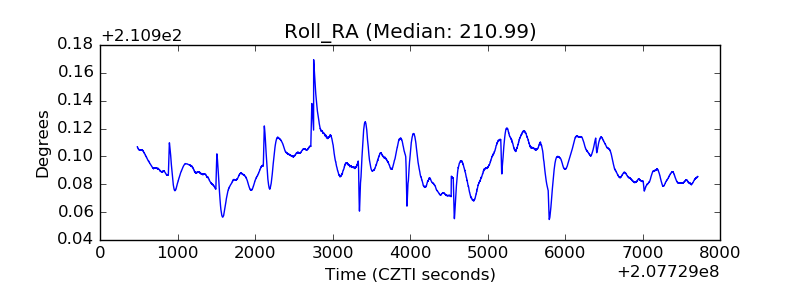 |
| Veto Counter | 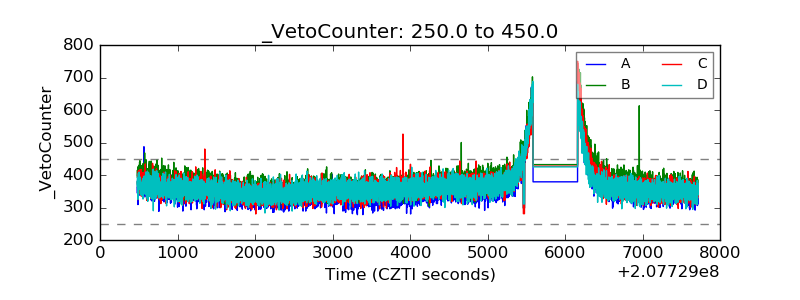 |