| Param | Original file | Final file |
|---|---|---|
| Filename | modeM0/AS1G05_233T10_9000000570_04563cztM0_level2.evt | modeM0/AS1G05_233T10_9000000570_04563cztM0_level2_quad_clean.evt |
| Size (bytes) | 767,629,440 | 89,611,200 |
| Size | 732.1 MB | 85.5 MB |
| Events in quadrant A | 3,479,588 | 572,347 |
| Events in quadrant B | 3,987,319 | 570,029 |
| Events in quadrant C | 6,507,437 | 551,020 |
| Events in quadrant D | 8,758,187 | 490,207 |
| Mode M0 | |||
|---|---|---|---|
| Quadrant | BADHDUFLAG | Total packets | Discarded packets |
| A | 0 | 15808 | 2 |
| B | 0 | 16931 | 13 |
| C | 0 | 24777 | 1 |
| D | 0 | 31280 | 3 |
| Mode SS | |||
|---|---|---|---|
| Quadrant | BADHDUFLAG | Total packets | Discarded packets |
| A | 0 | 152 | 0 |
| B | 0 | 152 | 0 |
| C | 0 | 152 | 0 |
| D | 0 | 152 | 0 |
| Quadrant | Total seconds | Saturated seconds | Saturation percentage |
|---|---|---|---|
| A | 7613 | 268 | 3.520294% |
| B | 7608 | 264 | 3.470032% |
| C | 7613 | 1290 | 16.944700% |
| D | 7612 | 1747 | 22.950604% |
Noise dominated data is calculated using 1-second bins in cleaned event files. If a bin has >2000 counts, and if more than 50% of those come from <1% of pixels, then it is considered to be noise-dominated and hence unusable.
| Quadrant | # 1 sec bins | Bins with >0 counts | Bins with >2000 counts | High rate bins dominated by noise | Noise dominated (total time) | Noise dominated (detector-on time) | Marked lightcurve |
|---|---|---|---|---|---|---|---|
| A | 7628 | 7614 | 1 | 1 | 0.01% | 0.01% | 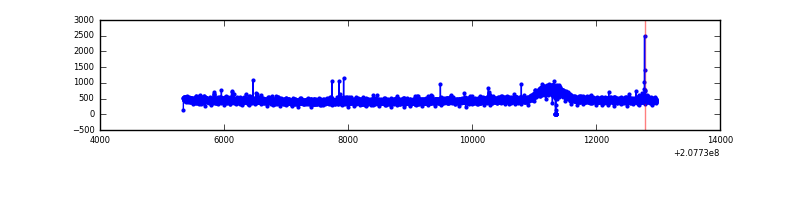 |
| B | 7628 | 7614 | 21 | 21 | 0.28% | 0.28% | 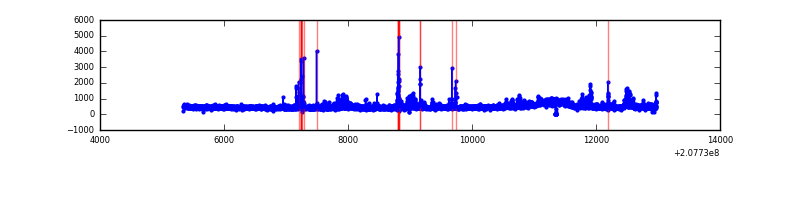 |
| C | 7628 | 7612 | 867 | 867 | 11.37% | 11.39% | 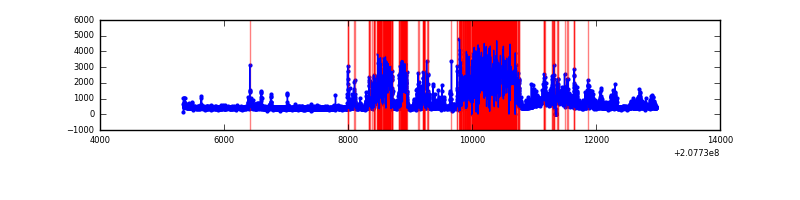 |
| D | 7628 | 7614 | 1315 | 1315 | 17.24% | 17.27% | 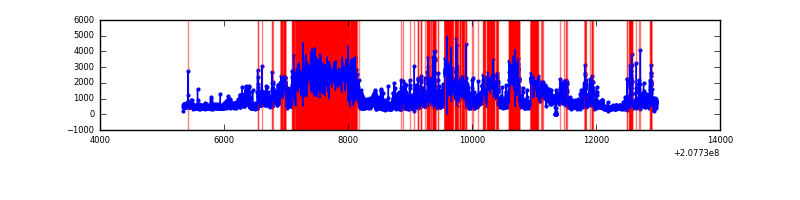 |
Top three noisy pixels from each quadrant. If the there are fewer than three noisy pixels in the level2.evt file, extra rows are filled as -1
| Pixel properties | Quadrant properties | ||||||
|---|---|---|---|---|---|---|---|
| Quadrant | DetID | PixID | Counts | Sigma | Mean | Median | Sigma |
| A | 13 | 248 | 13210 | 66.9 | 893 | 870 | 184.5 |
| A | 12 | 194 | 9235 | 45.35 | 893 | 870 | 184.5 |
| A | 0 | 226 | 9011 | 44.14 | 893 | 870 | 184.5 |
| B | 14 | 167 | 353224 | 2031.4 | 896 | 870 | 173.5 |
| B | 5 | 70 | 66408 | 377.84 | 896 | 870 | 173.5 |
| B | 10 | 246 | 32255 | 180.94 | 896 | 870 | 173.5 |
| C | 14 | 48 | 3377711 | 18203.0 | 790 | 792 | 185.5 |
| C | 9 | 247 | 33754 | 177.68 | 790 | 792 | 185.5 |
| C | 13 | 61 | 6612 | 31.37 | 790 | 792 | 185.5 |
| D | 9 | 35 | 3360610 | 17297.18 | 798 | 773 | 194.2 |
| D | 14 | 35 | 774642 | 3984.05 | 798 | 773 | 194.2 |
| D | 13 | 235 | 424728 | 2182.61 | 798 | 773 | 194.2 |
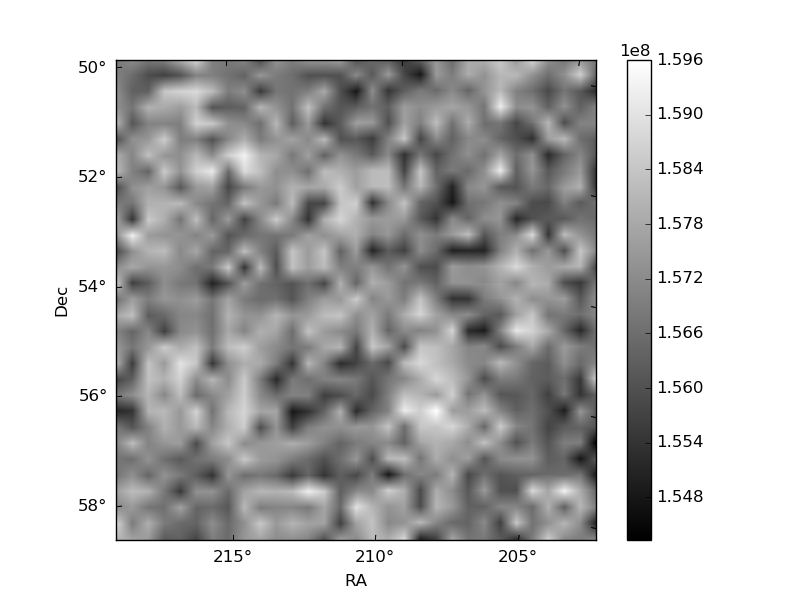
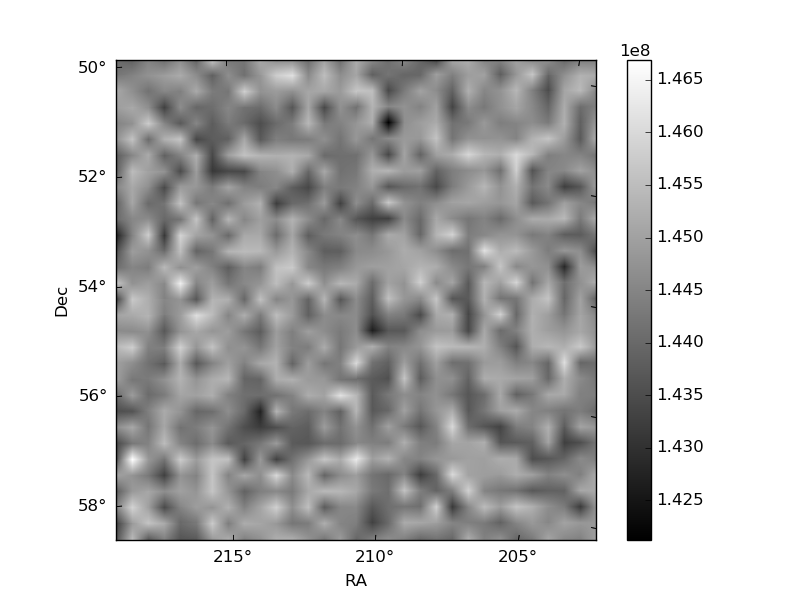
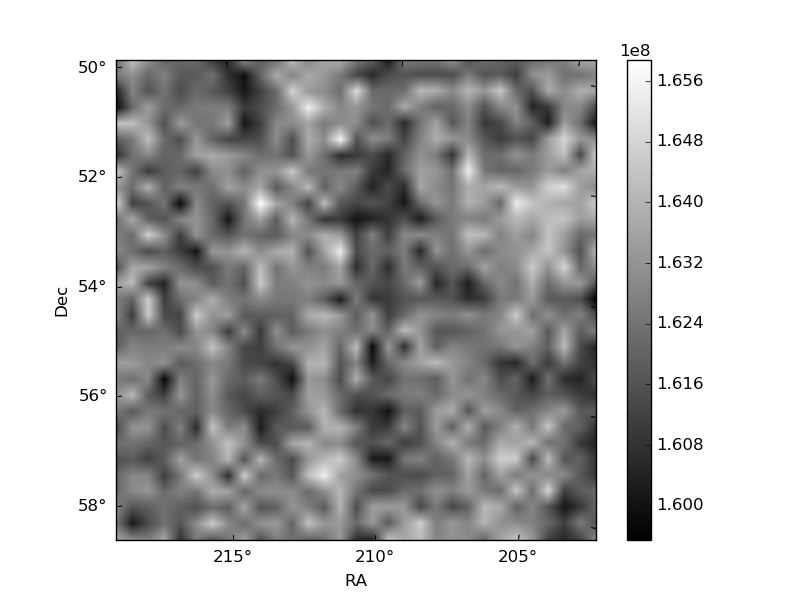
Histogram calculated using DETX and DETY for each event in the final _common_clean file
| Quadrant A | 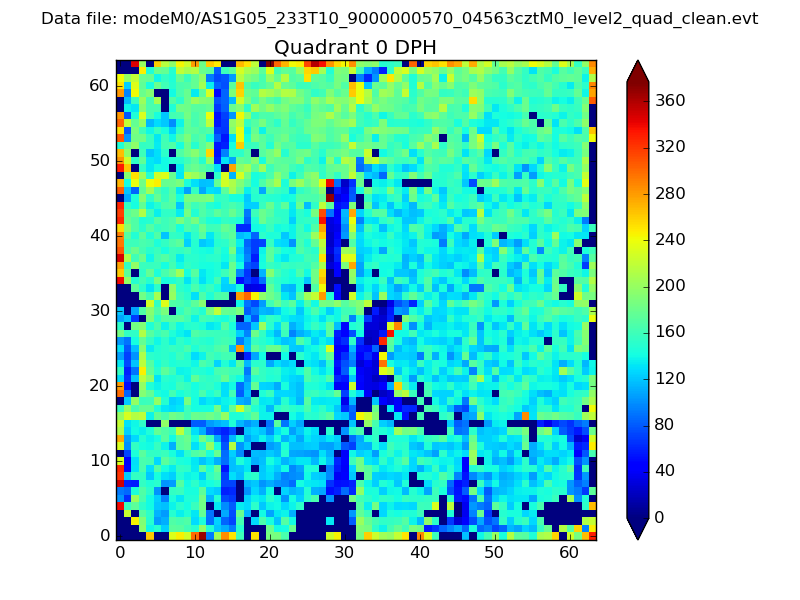 |
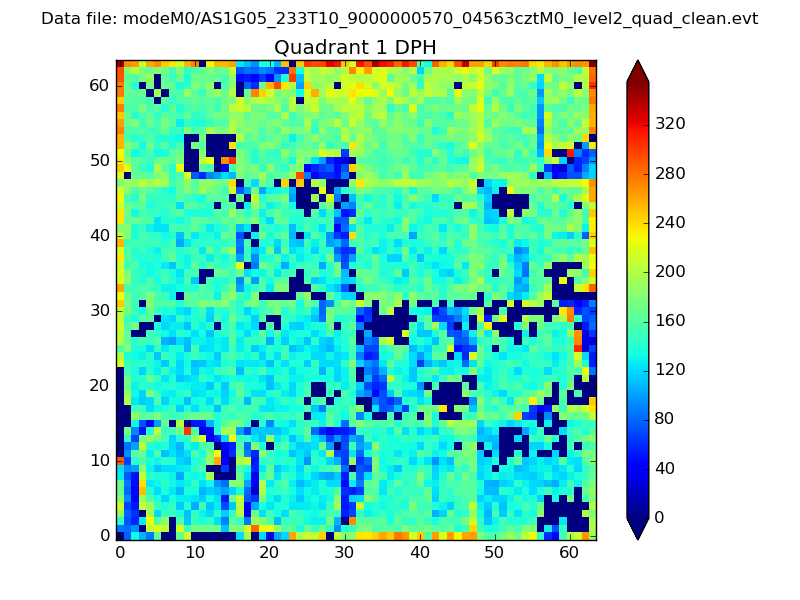 |
Quadrant B |
|---|---|---|---|
| Quadrant D | 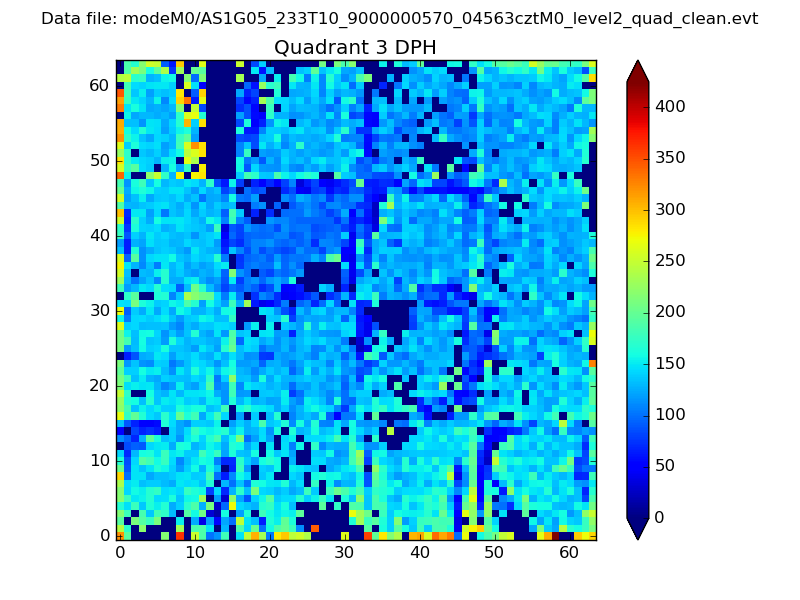 |
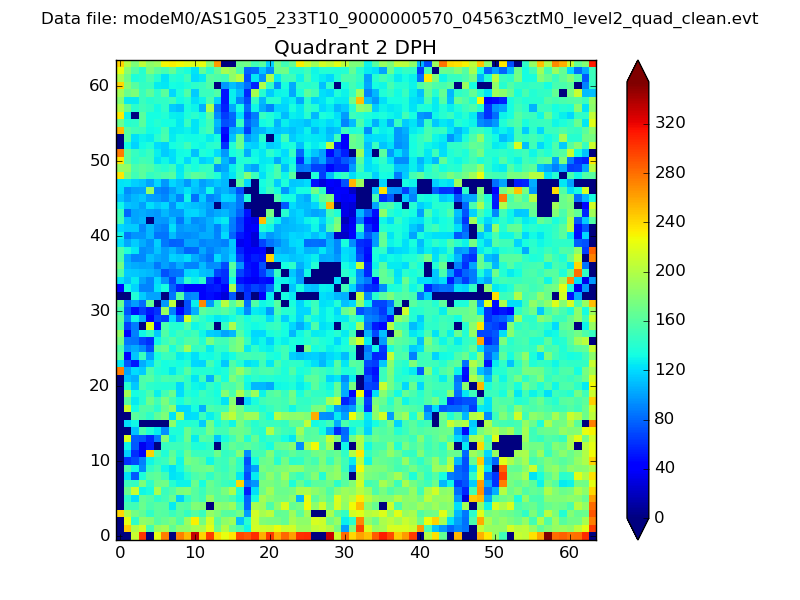 |
Quadrant C |
| Plot type | Count rate plots | Images |
|---|---|---|
| Comparison with Poisson distribution Blue bars denote a histogram of data divided into 1 sec bins. Red curve is a Poisson curve with rate = median count rate of data. |
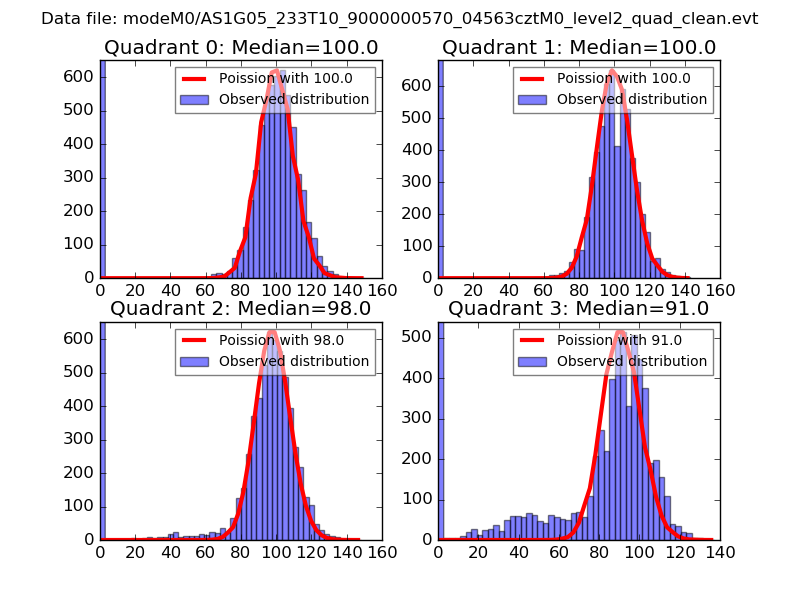 |
 |
| Quadrant-wise count rates Data is divided into 100 sec bins |
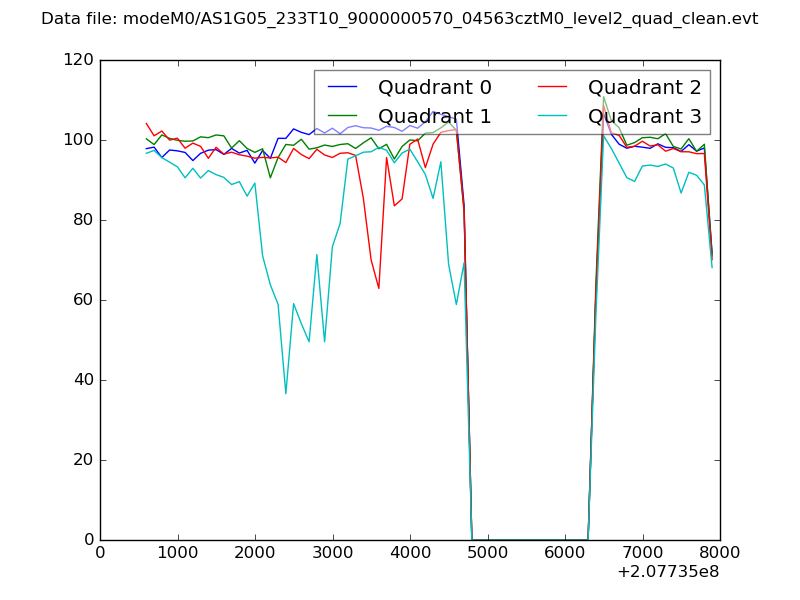 |
|
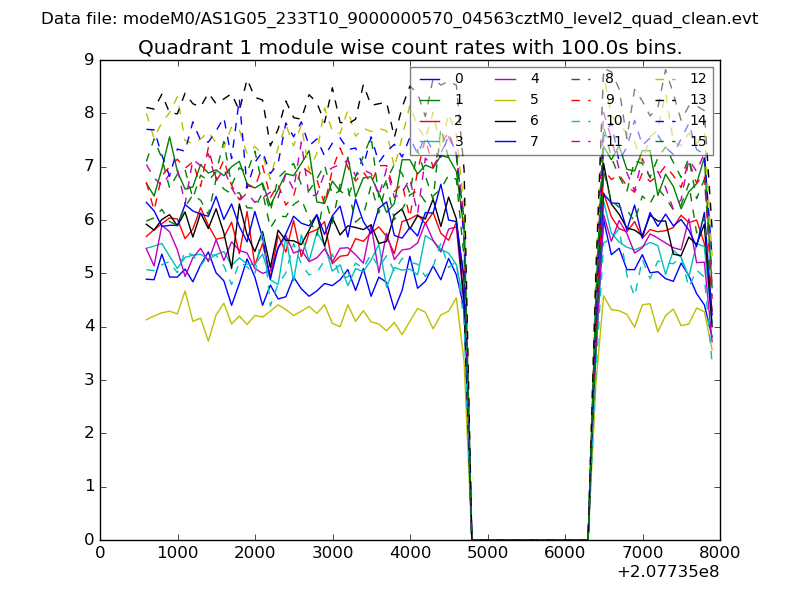
| Module-wise count rates for Quadrant A Data is divided into 100 sec bins |
 |
 |
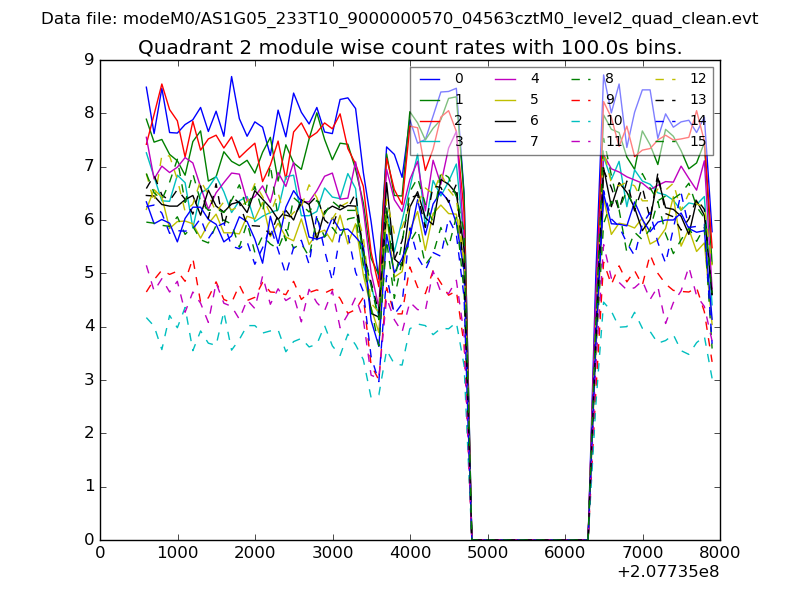
| Module-wise count rates for Quadrant B Data is divided into 100 sec bins |
 |
 |
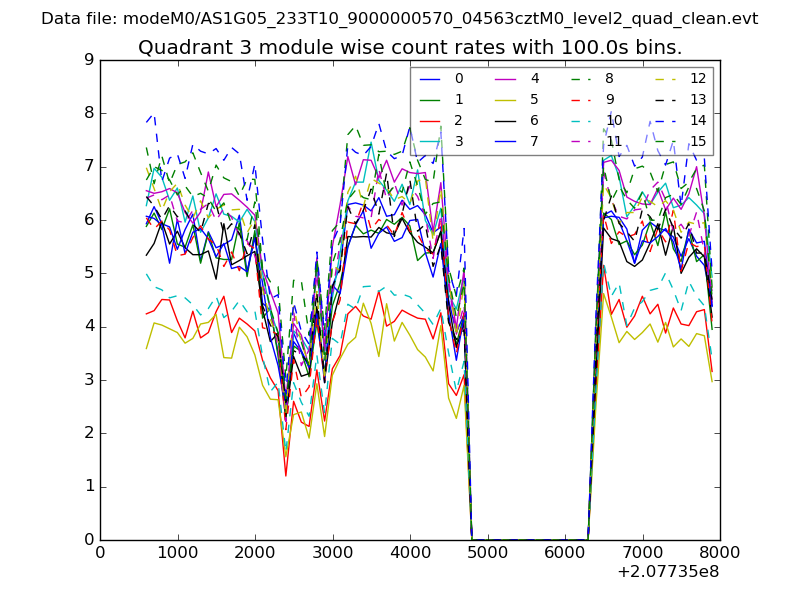
| Module-wise count rates for Quadrant C Data is divided into 100 sec bins |
 |
 |
| Module-wise count rates for Quadrant D Data is divided into 100 sec bins |
 |
 |
| Parameter | Plot |
|---|---|
| CZT HV Monitor | 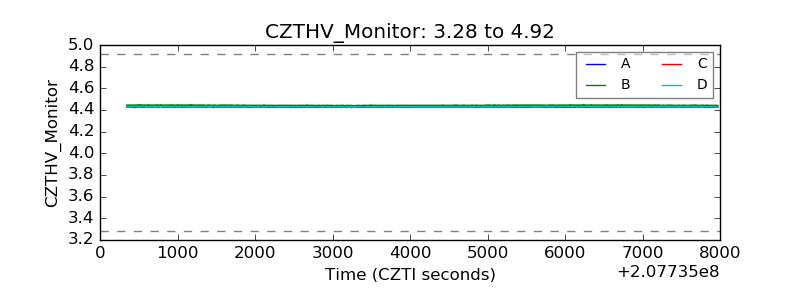 |
| D_VDD | 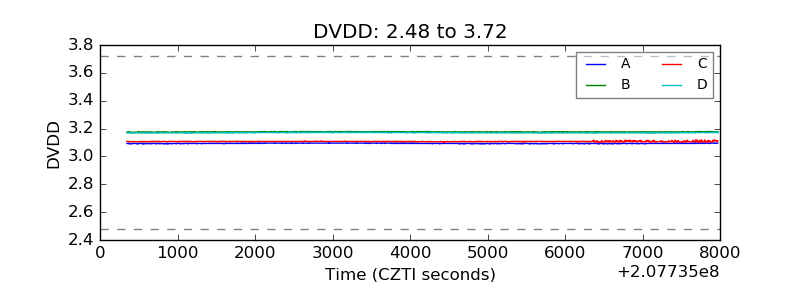 |
| Temperature 1 | 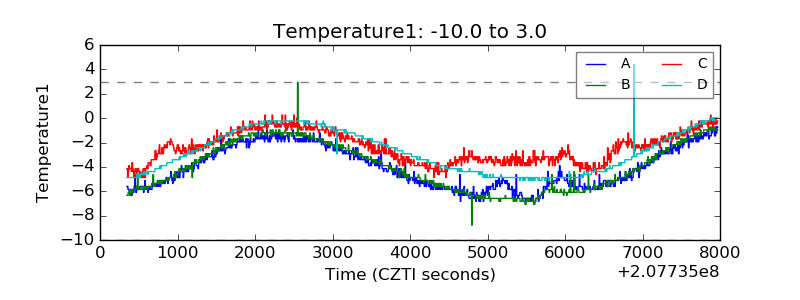 |
| Veto HV Monitor | 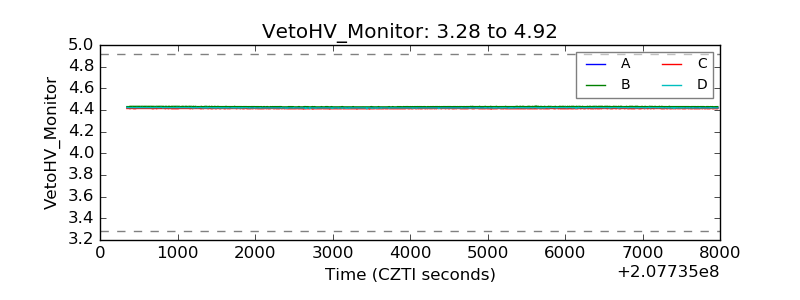 |
| Veto LLD | 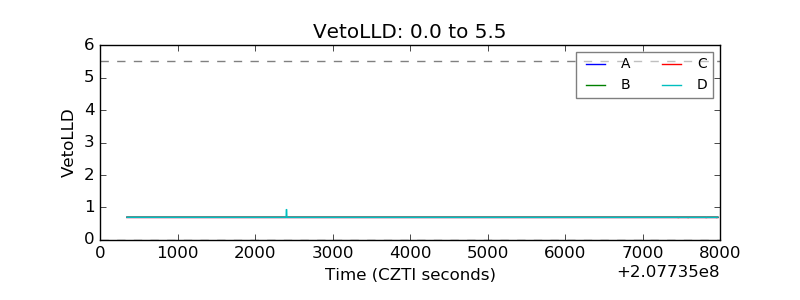 |
| Alpha Counter | 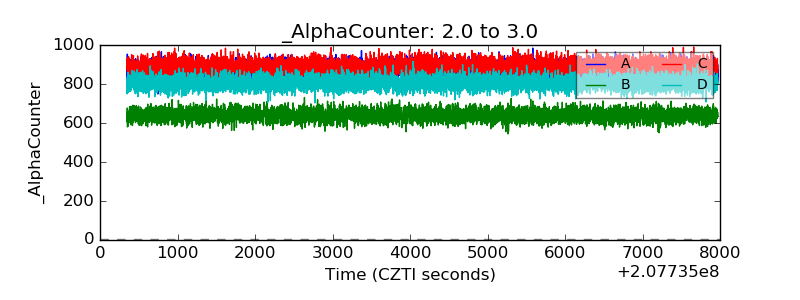 |
| _CPM_Rate | 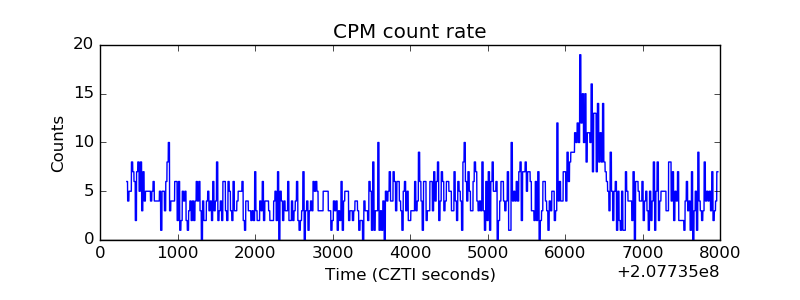 |
| CZT Counter | 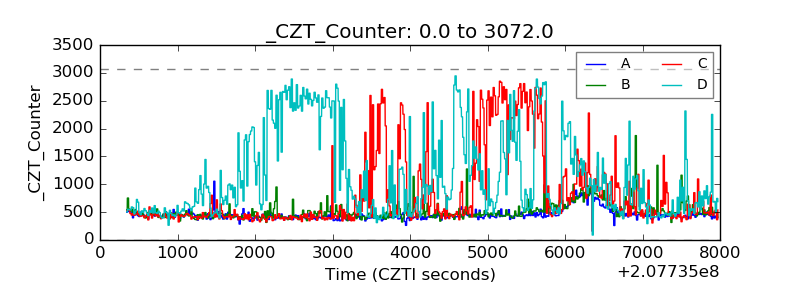 |
| +2.5 Volts monitor | 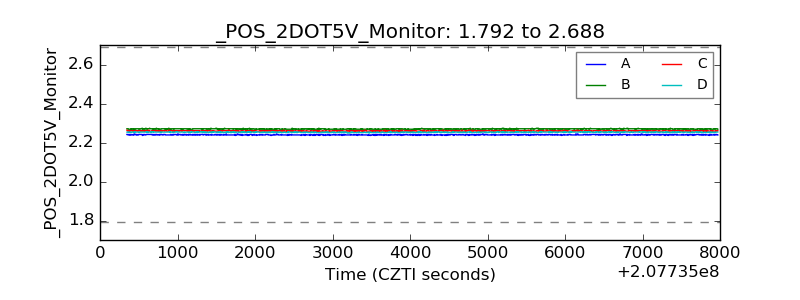 |
| +5 Volts monitor | 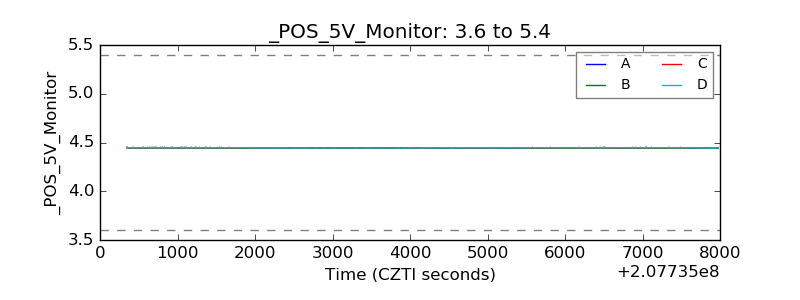 |
| _ROLL_ROT | 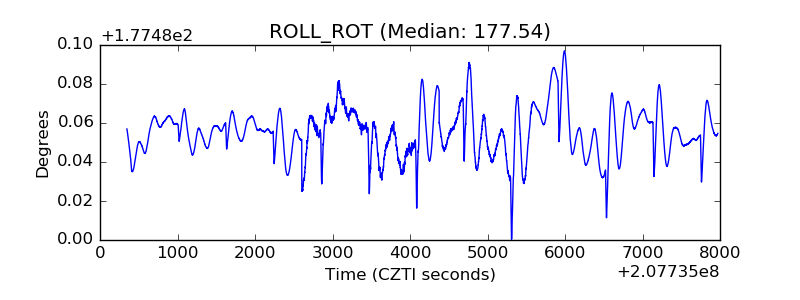 |
| _Roll_DEC | 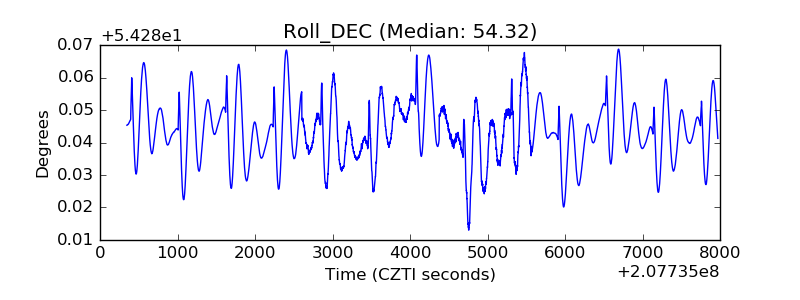 |
| _Roll_RA | 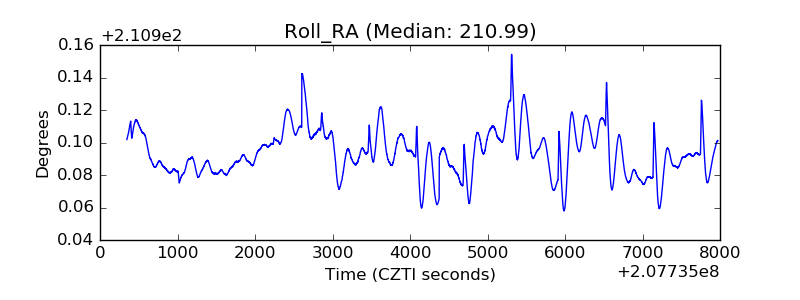 |
| Veto Counter | 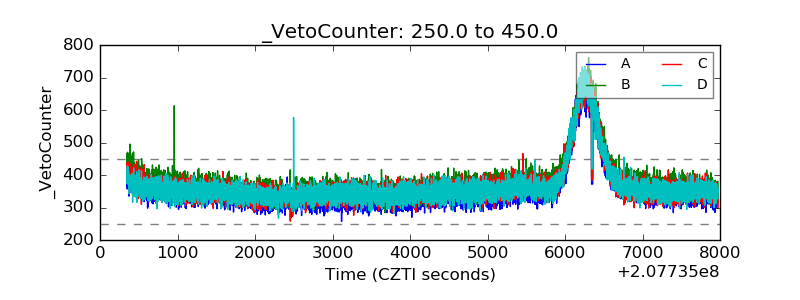 |