| Param | Original file | Final file |
|---|---|---|
| Filename | modeM0/AS1G05_233T10_9000000570_04565cztM0_level2.evt | modeM0/AS1G05_233T10_9000000570_04565cztM0_level2_quad_clean.evt |
| Size (bytes) | 523,814,400 | 93,499,200 |
| Size | 499.5 MB | 89.2 MB |
| Events in quadrant A | 3,430,535 | 592,367 |
| Events in quadrant B | 4,235,972 | 578,195 |
| Events in quadrant C | 3,662,240 | 577,380 |
| Events in quadrant D | 4,024,665 | 560,449 |
| Mode M9 | |||
|---|---|---|---|
| Quadrant | BADHDUFLAG | Total packets | Discarded packets |
| A | 0 | 3 | 0 |
| B | 0 | 3 | 0 |
| C | 0 | 3 | 0 |
| D | 0 | 3 | 0 |
| Mode M0 | |||
|---|---|---|---|
| Quadrant | BADHDUFLAG | Total packets | Discarded packets |
| A | 0 | 15538 | 9 |
| B | 0 | 17562 | 5 |
| C | 0 | 16209 | 8 |
| D | 0 | 17203 | 11 |
| Mode SS | |||
|---|---|---|---|
| Quadrant | BADHDUFLAG | Total packets | Discarded packets |
| A | 0 | 154 | 0 |
| B | 0 | 154 | 0 |
| C | 0 | 154 | 0 |
| D | 0 | 154 | 0 |
| Quadrant | Total seconds | Saturated seconds | Saturation percentage |
|---|---|---|---|
| A | 7509 | 76 | 1.012119% |
| B | 7510 | 219 | 2.916112% |
| C | 7509 | 67 | 0.892263% |
| D | 7508 | 133 | 1.771444% |
Noise dominated data is calculated using 1-second bins in cleaned event files. If a bin has >2000 counts, and if more than 50% of those come from <1% of pixels, then it is considered to be noise-dominated and hence unusable.
| Quadrant | # 1 sec bins | Bins with >0 counts | Bins with >2000 counts | High rate bins dominated by noise | Noise dominated (total time) | Noise dominated (detector-on time) | Marked lightcurve |
|---|---|---|---|---|---|---|---|
| A | 7847 | 7513 | 4 | 4 | 0.05% | 0.05% | 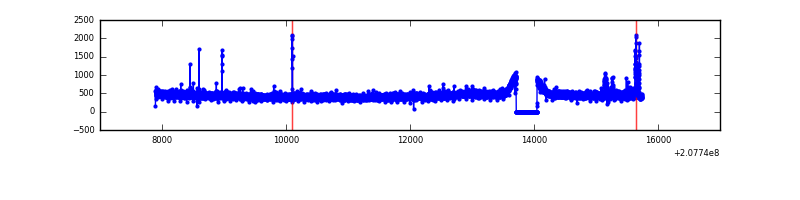 |
| B | 7847 | 7513 | 80 | 80 | 1.02% | 1.06% | 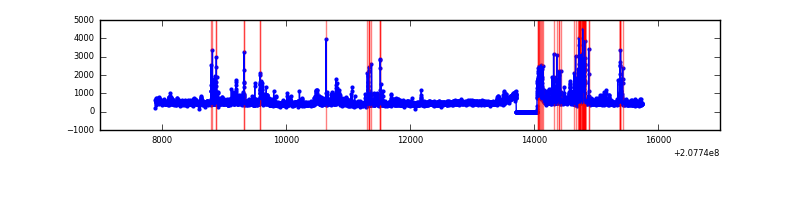 |
| C | 7847 | 7513 | 9 | 9 | 0.11% | 0.12% | 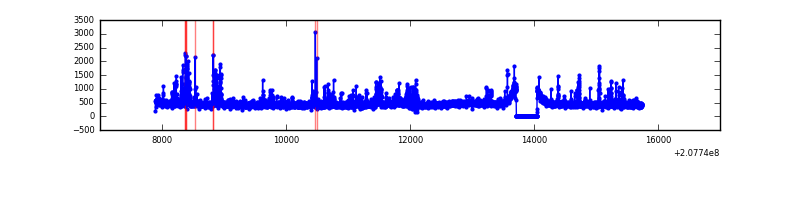 |
| D | 7847 | 7513 | 49 | 49 | 0.62% | 0.65% | 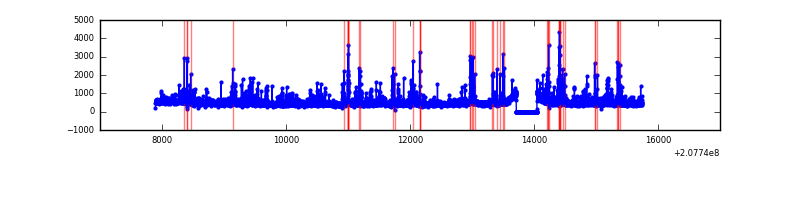 |
Top three noisy pixels from each quadrant. If the there are fewer than three noisy pixels in the level2.evt file, extra rows are filled as -1
| Pixel properties | Quadrant properties | ||||||
|---|---|---|---|---|---|---|---|
| Quadrant | DetID | PixID | Counts | Sigma | Mean | Median | Sigma |
| A | 13 | 251 | 67238 | 375.77 | 863 | 843 | 176.7 |
| A | 0 | 50 | 11327 | 59.33 | 863 | 843 | 176.7 |
| A | 8 | 15 | 9789 | 50.63 | 863 | 843 | 176.7 |
| B | 14 | 167 | 485045 | 2906.93 | 859 | 838 | 166.6 |
| B | 5 | 70 | 133990 | 799.37 | 859 | 838 | 166.6 |
| B | 10 | 16 | 81033 | 481.45 | 859 | 838 | 166.6 |
| C | 14 | 48 | 364234 | 1865.33 | 833 | 834 | 194.8 |
| C | 9 | 247 | 18106 | 88.66 | 833 | 834 | 194.8 |
| C | 8 | 128 | 11604 | 55.28 | 833 | 834 | 194.8 |
| D | 7 | 67 | 244074 | 1208.97 | 835 | 812 | 201.2 |
| D | 13 | 235 | 199293 | 986.41 | 835 | 812 | 201.2 |
| D | 9 | 35 | 103117 | 508.44 | 835 | 812 | 201.2 |
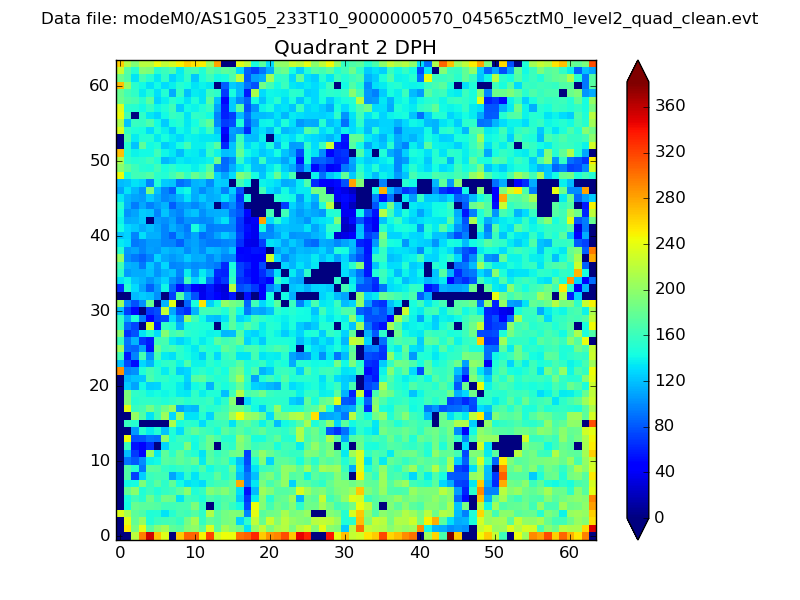
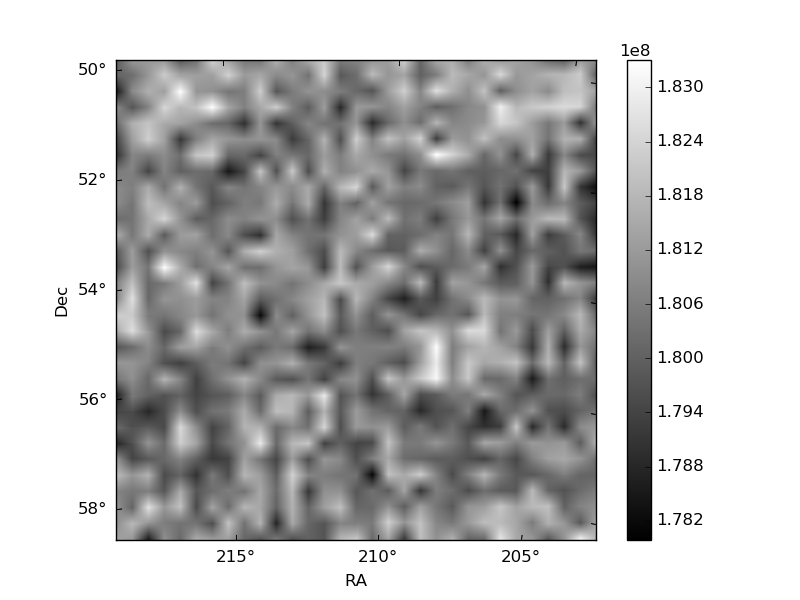
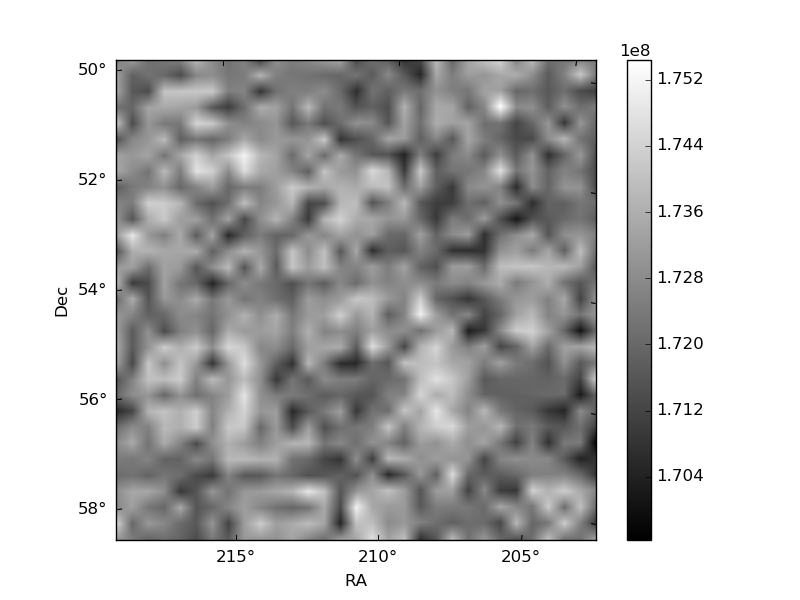
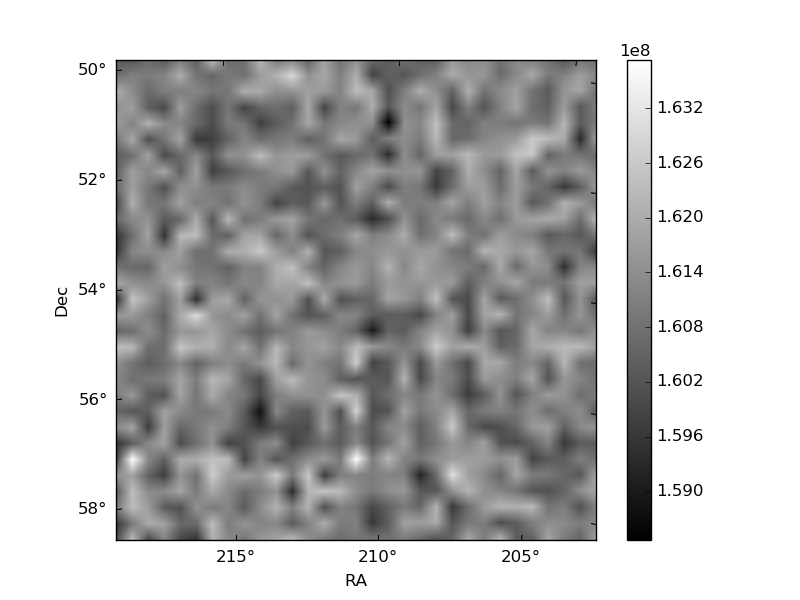
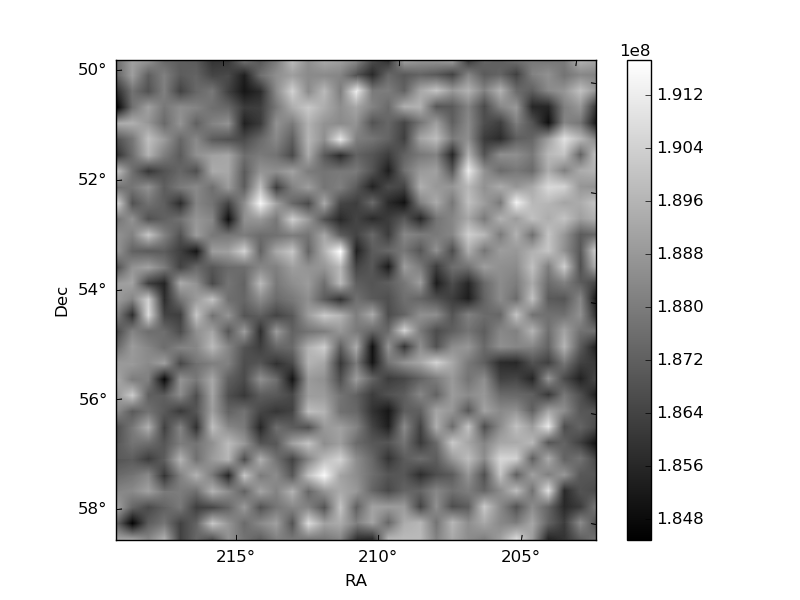
Histogram calculated using DETX and DETY for each event in the final _common_clean file
| Quadrant A | 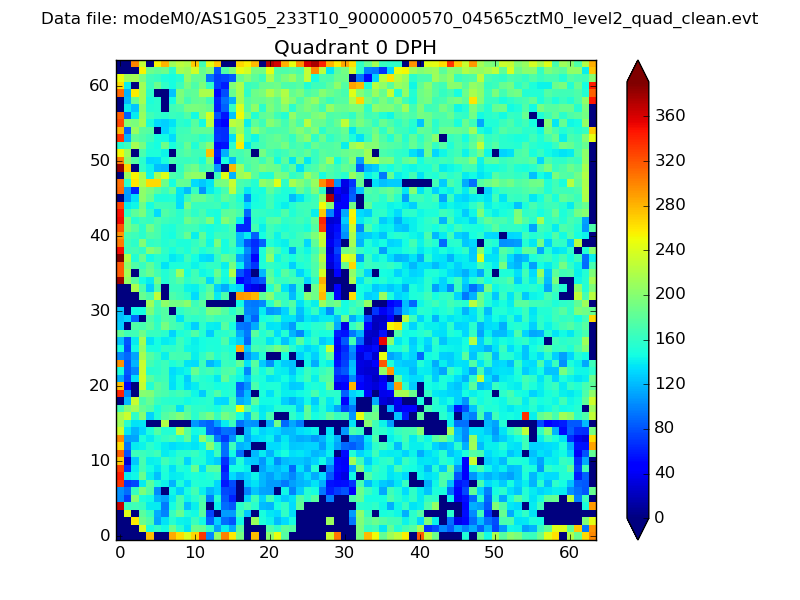 |
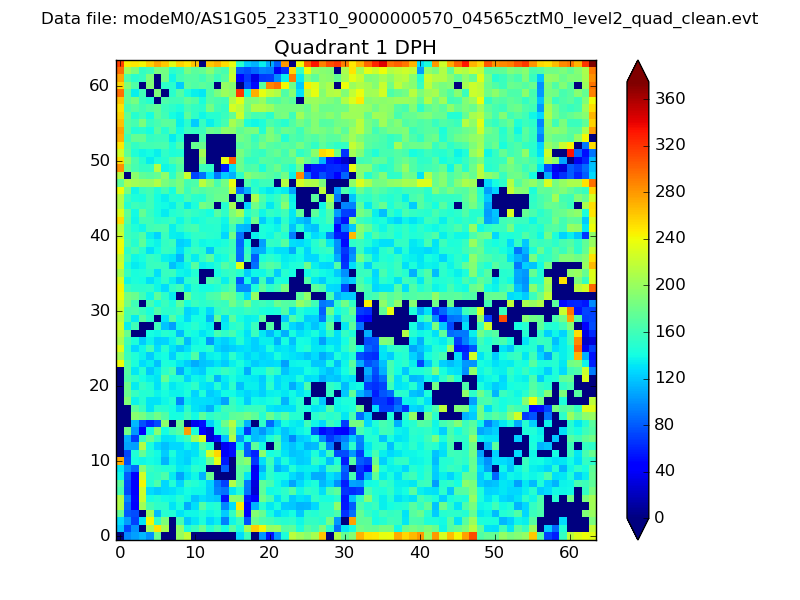 |
Quadrant B |
|---|---|---|---|
| Quadrant D | 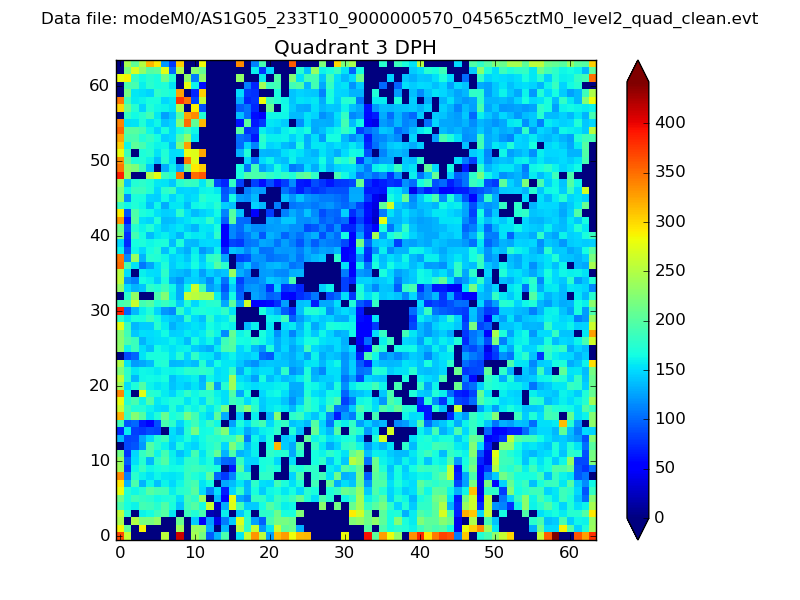 |
 |
Quadrant C |
| Plot type | Count rate plots | Images |
|---|---|---|
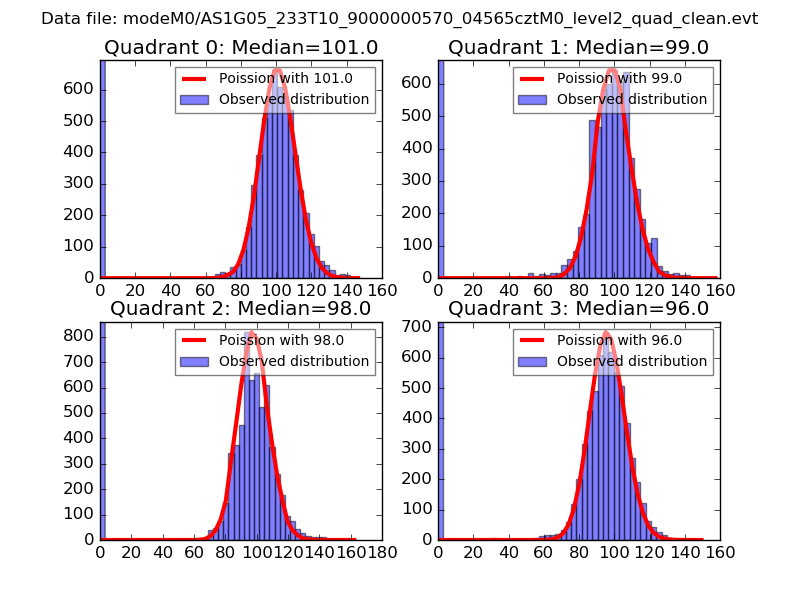
| Comparison with Poisson distribution Blue bars denote a histogram of data divided into 1 sec bins. Red curve is a Poisson curve with rate = median count rate of data. |
 |
 |
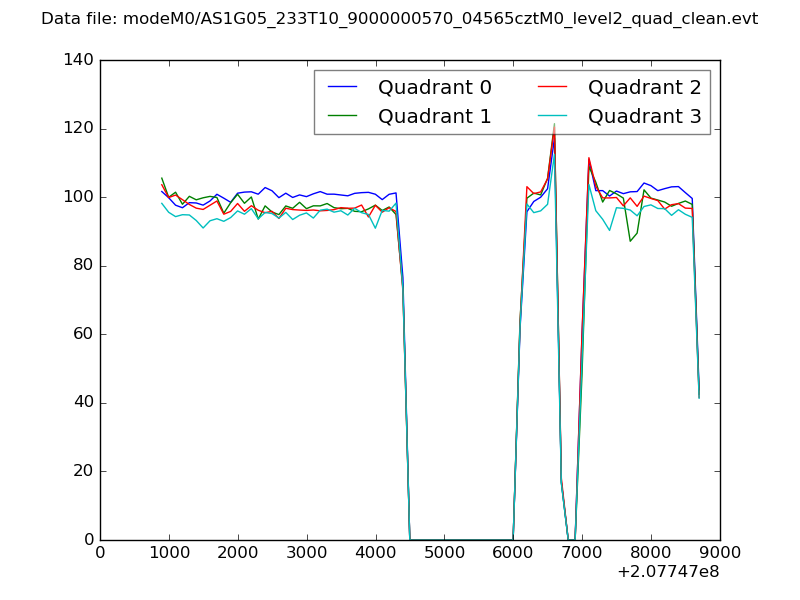
| Quadrant-wise count rates Data is divided into 100 sec bins |
 |
|
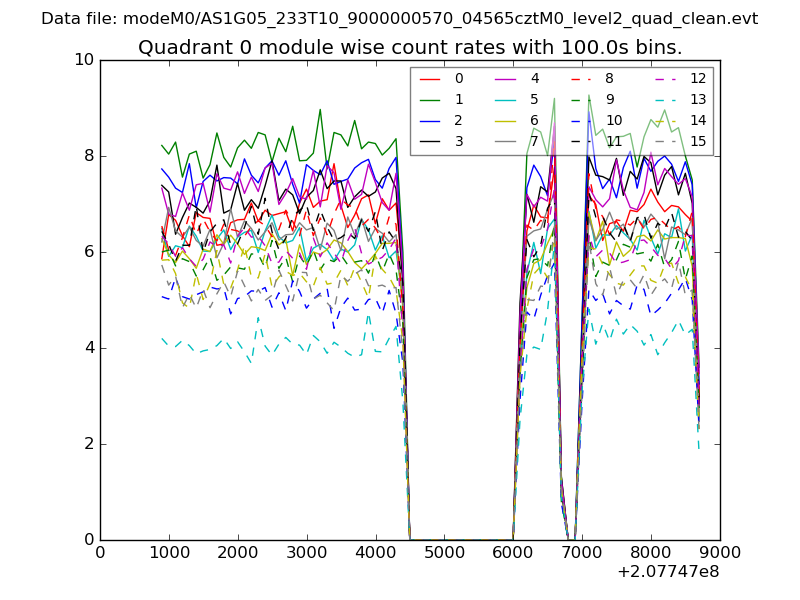
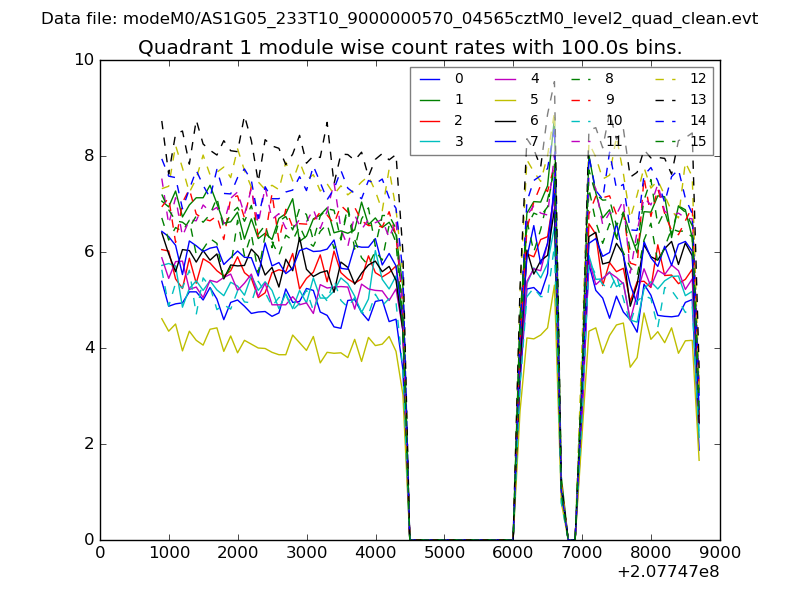
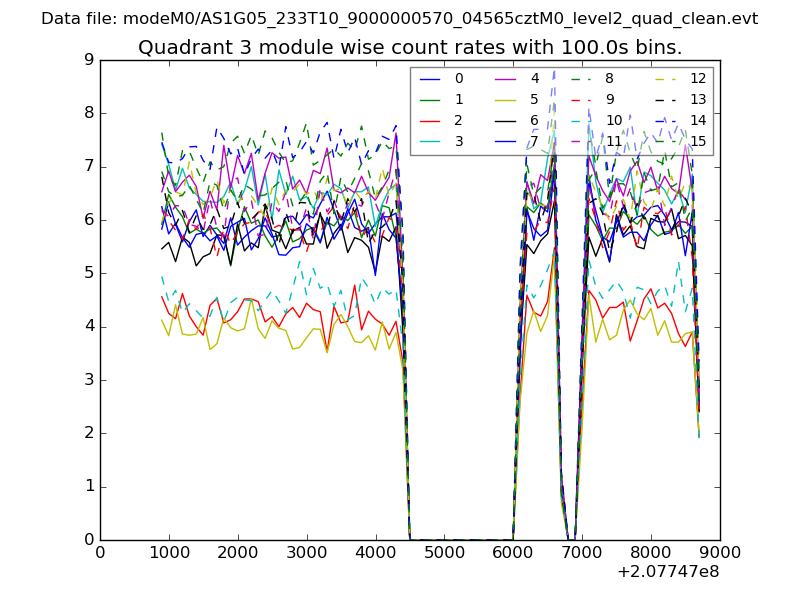
| Module-wise count rates for Quadrant A Data is divided into 100 sec bins |
 |
 |
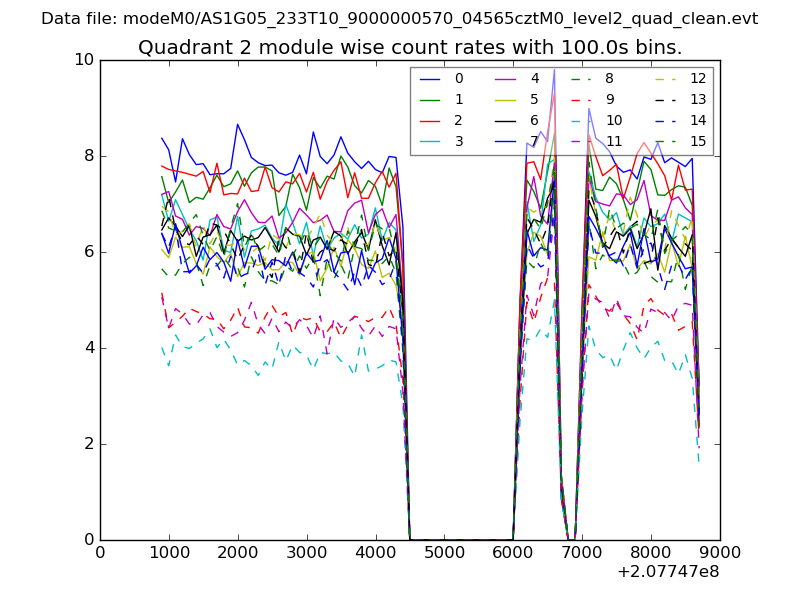
| Module-wise count rates for Quadrant B Data is divided into 100 sec bins |
 |
 |
| Module-wise count rates for Quadrant C Data is divided into 100 sec bins |
 |
 |
| Module-wise count rates for Quadrant D Data is divided into 100 sec bins |
 |
 |
| Parameter | Plot |
|---|---|
| CZT HV Monitor | 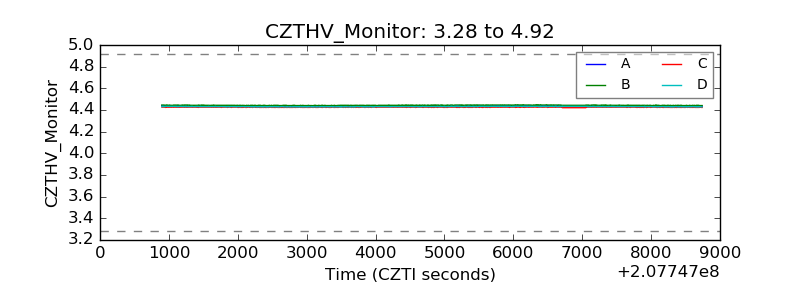 |
| D_VDD | 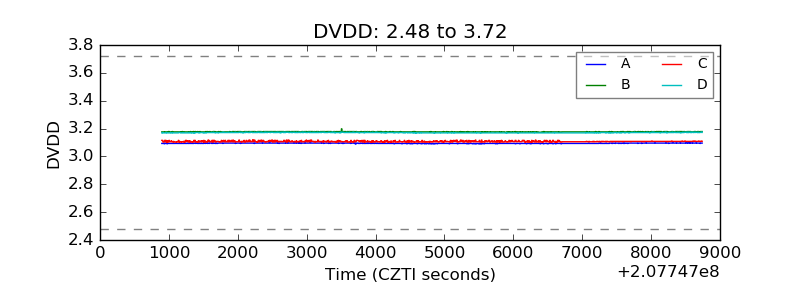 |
| Temperature 1 | 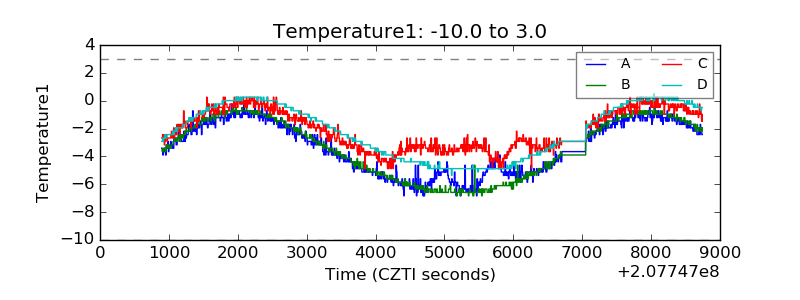 |
| Veto HV Monitor | 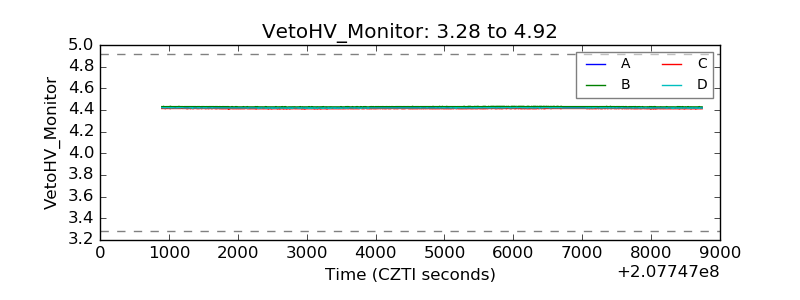 |
| Veto LLD | 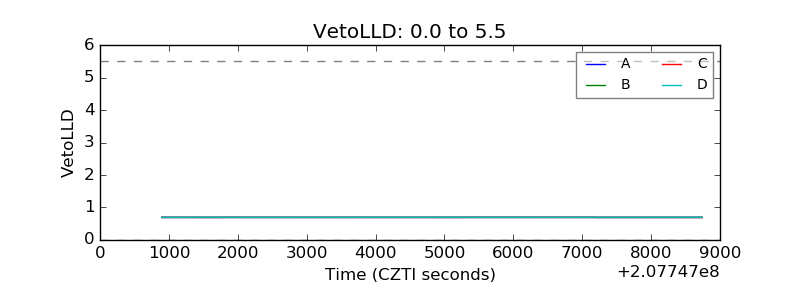 |
| Alpha Counter | 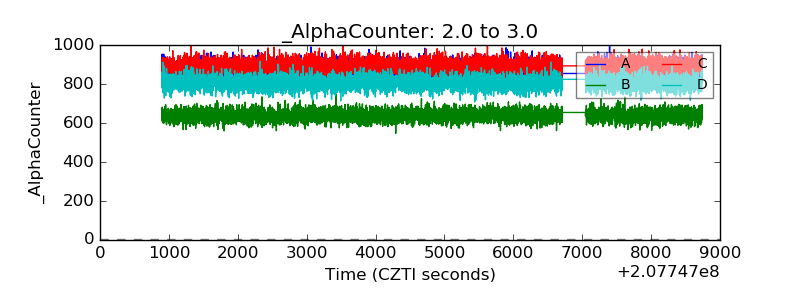 |
| _CPM_Rate | 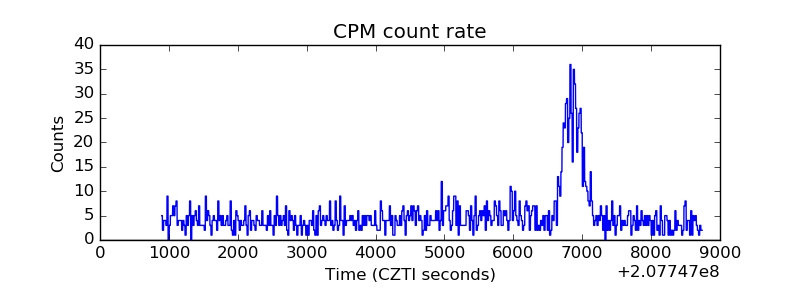 |
| CZT Counter | 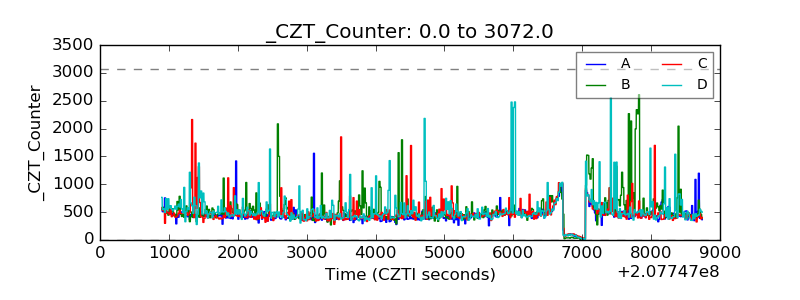 |
| +2.5 Volts monitor | 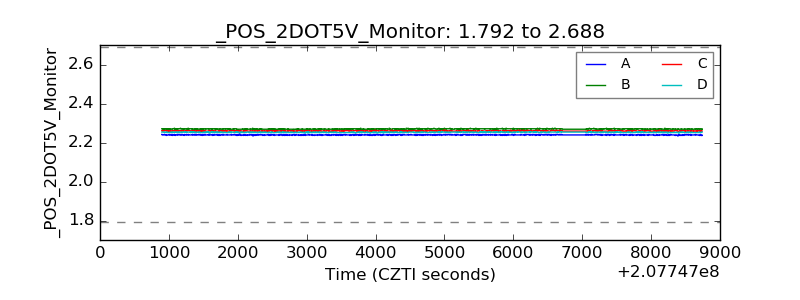 |
| +5 Volts monitor |  |
| _ROLL_ROT | 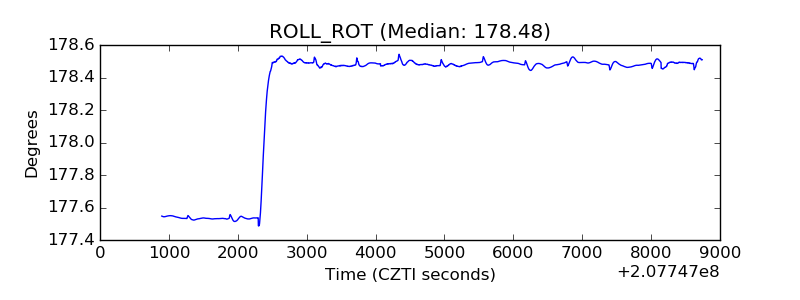 |
| _Roll_DEC | 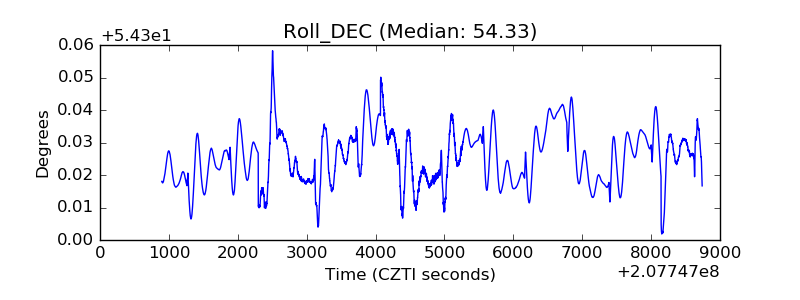 |
| _Roll_RA | 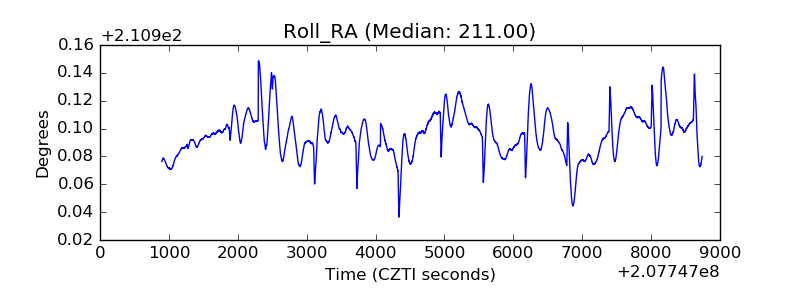 |
| Veto Counter | 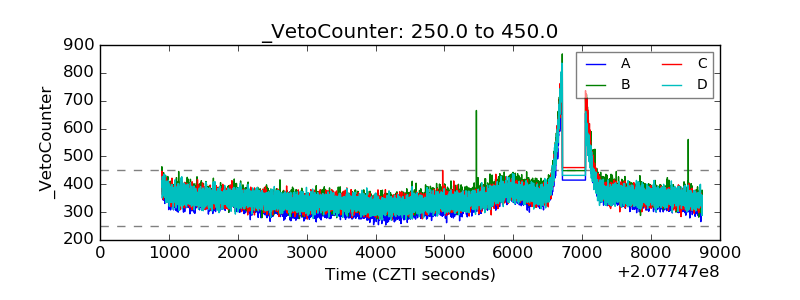 |