| Param | Original file | Final file |
|---|---|---|
| Filename | modeM0/AS1G05_233T10_9000000570_04567cztM0_level2.evt | modeM0/AS1G05_233T10_9000000570_04567cztM0_level2_quad_clean.evt |
| Size (bytes) | 635,492,160 | 104,509,440 |
| Size | 606.1 MB | 99.7 MB |
| Events in quadrant A | 4,211,668 | 642,732 |
| Events in quadrant B | 5,111,592 | 624,471 |
| Events in quadrant C | 4,210,086 | 622,419 |
| Events in quadrant D | 5,060,366 | 608,496 |
| Mode M9 | |||
|---|---|---|---|
| Quadrant | BADHDUFLAG | Total packets | Discarded packets |
| A | 0 | 6 | 0 |
| B | 0 | 6 | 0 |
| C | 0 | 6 | 0 |
| D | 0 | 6 | 0 |
| Mode M0 | |||
|---|---|---|---|
| Quadrant | BADHDUFLAG | Total packets | Discarded packets |
| A | 0 | 19794 | 89 |
| B | 0 | 21876 | 131 |
| C | 0 | 19867 | 107 |
| D | 0 | 22194 | 125 |
| Mode SS | |||
|---|---|---|---|
| Quadrant | BADHDUFLAG | Total packets | Discarded packets |
| A | 0 | 196 | 0 |
| B | 0 | 196 | 0 |
| C | 0 | 196 | 2 |
| D | 0 | 196 | 0 |
| Quadrant | Total seconds | Saturated seconds | Saturation percentage |
|---|---|---|---|
| A | 9616 | 24 | 0.249584% |
| B | 9612 | 130 | 1.352476% |
| C | 9611 | 25 | 0.260119% |
| D | 9607 | 139 | 1.446862% |
Noise dominated data is calculated using 1-second bins in cleaned event files. If a bin has >2000 counts, and if more than 50% of those come from <1% of pixels, then it is considered to be noise-dominated and hence unusable.
| Quadrant | # 1 sec bins | Bins with >0 counts | Bins with >2000 counts | High rate bins dominated by noise | Noise dominated (total time) | Noise dominated (detector-on time) | Marked lightcurve |
|---|---|---|---|---|---|---|---|
| A | 10244 | 9659 | 8 | 8 | 0.08% | 0.08% | 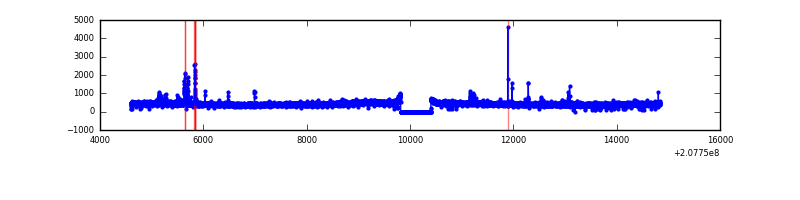 |
| B | 10244 | 9659 | 62 | 62 | 0.61% | 0.64% | 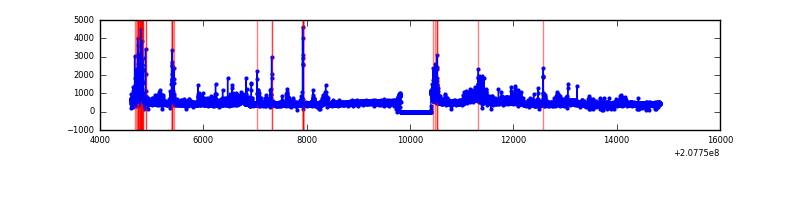 |
| C | 10244 | 9657 | 7 | 7 | 0.07% | 0.07% | 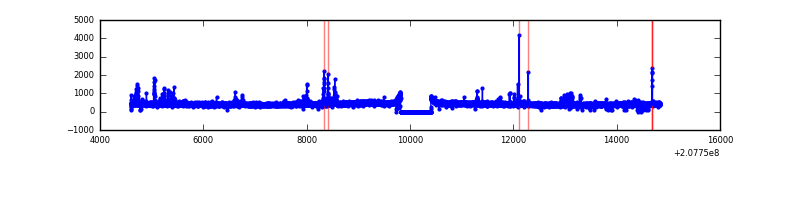 |
| D | 10244 | 9658 | 112 | 112 | 1.09% | 1.16% | 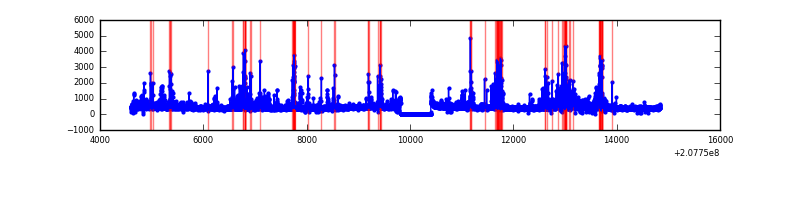 |
Top three noisy pixels from each quadrant. If the there are fewer than three noisy pixels in the level2.evt file, extra rows are filled as -1
| Pixel properties | Quadrant properties | ||||||
|---|---|---|---|---|---|---|---|
| Quadrant | DetID | PixID | Counts | Sigma | Mean | Median | Sigma |
| A | 13 | 251 | 92266 | 421.27 | 1055 | 1030 | 216.6 |
| A | 7 | 16 | 33491 | 149.88 | 1055 | 1030 | 216.6 |
| A | 0 | 226 | 10811 | 45.16 | 1055 | 1030 | 216.6 |
| B | 14 | 167 | 282345 | 1381.89 | 1061 | 1032 | 203.6 |
| B | 5 | 70 | 160562 | 783.66 | 1061 | 1032 | 203.6 |
| B | 4 | 80 | 127426 | 620.89 | 1061 | 1032 | 203.6 |
| C | 14 | 48 | 119993 | 499.46 | 1025 | 1028 | 238.2 |
| C | 9 | 247 | 71697 | 296.69 | 1025 | 1028 | 238.2 |
| C | 13 | 61 | 8538 | 31.53 | 1025 | 1028 | 238.2 |
| D | 13 | 235 | 521199 | 2102.69 | 1023 | 993 | 247.4 |
| D | 2 | 136 | 168429 | 676.78 | 1023 | 993 | 247.4 |
| D | 7 | 67 | 149253 | 599.27 | 1023 | 993 | 247.4 |
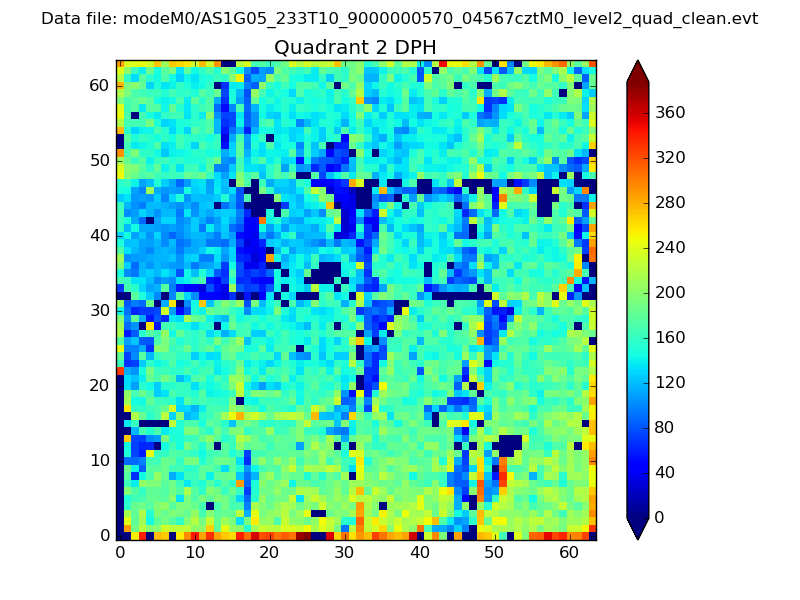
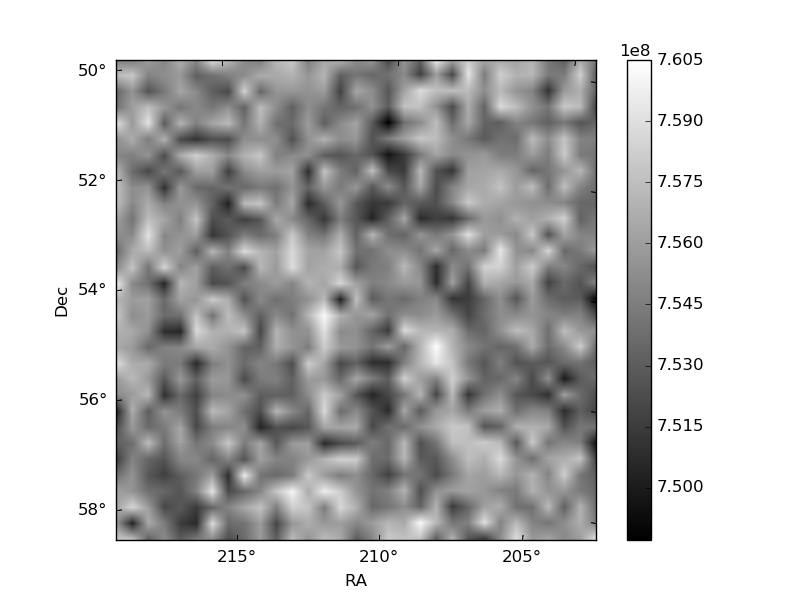
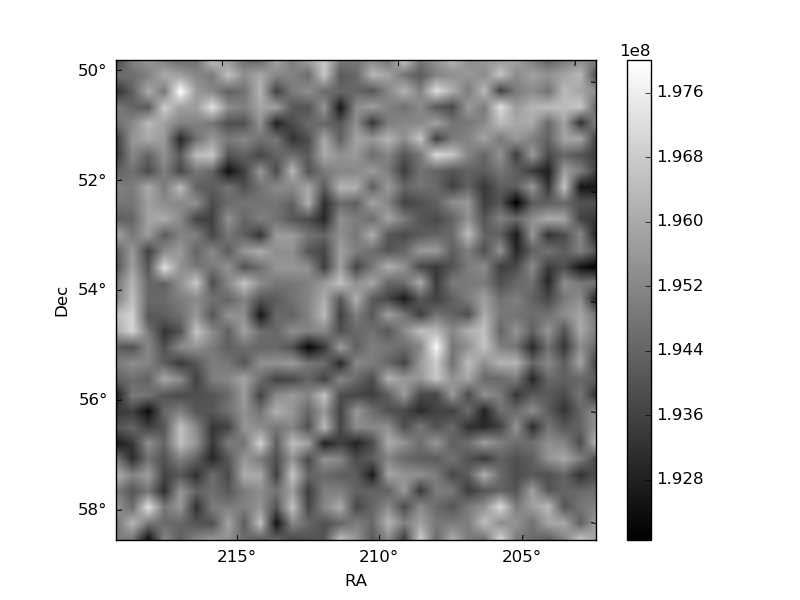
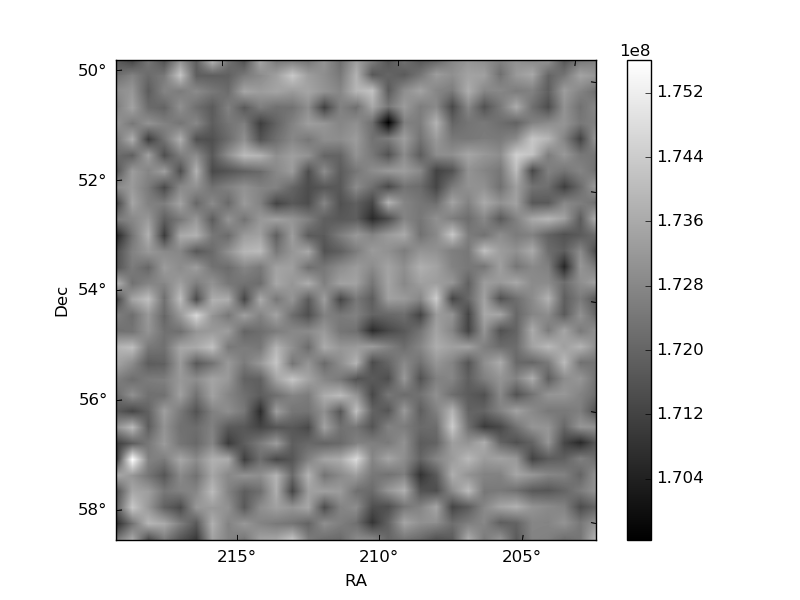
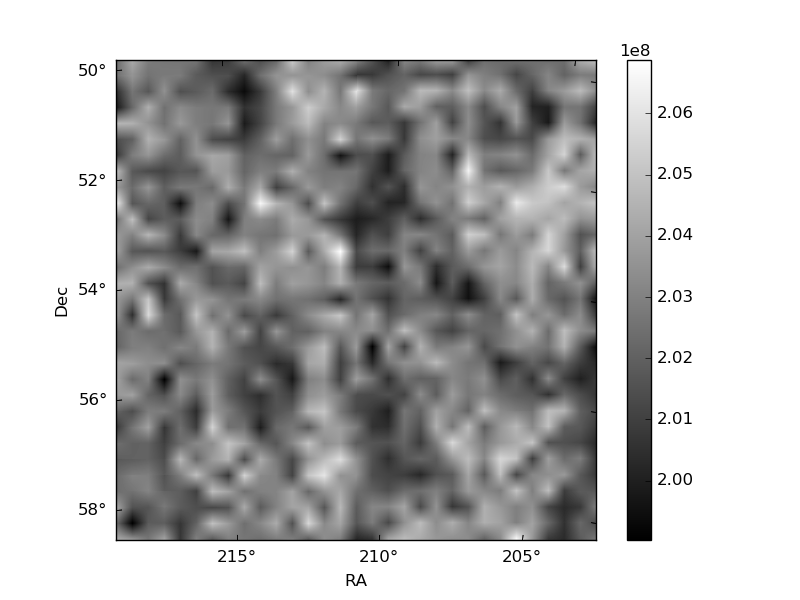
Histogram calculated using DETX and DETY for each event in the final _common_clean file
| Quadrant A | 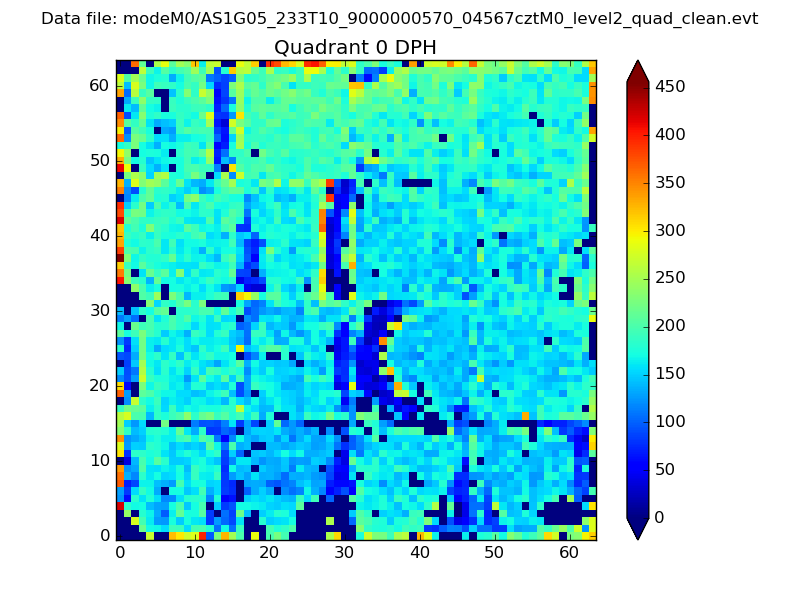 |
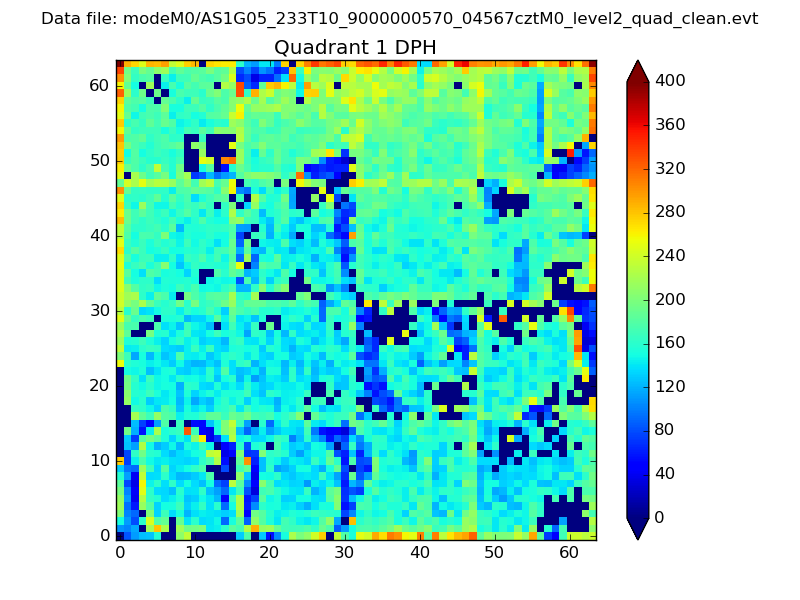 |
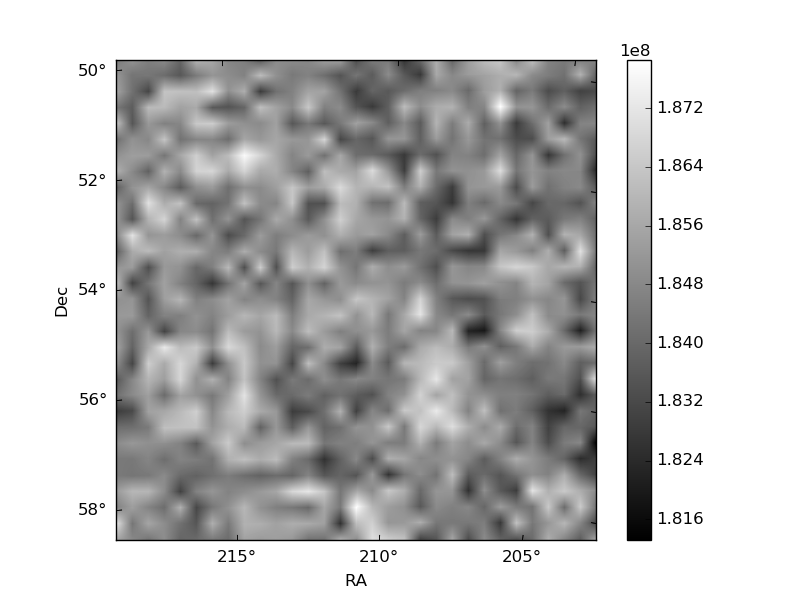
Quadrant B |
|---|---|---|---|
| Quadrant D | 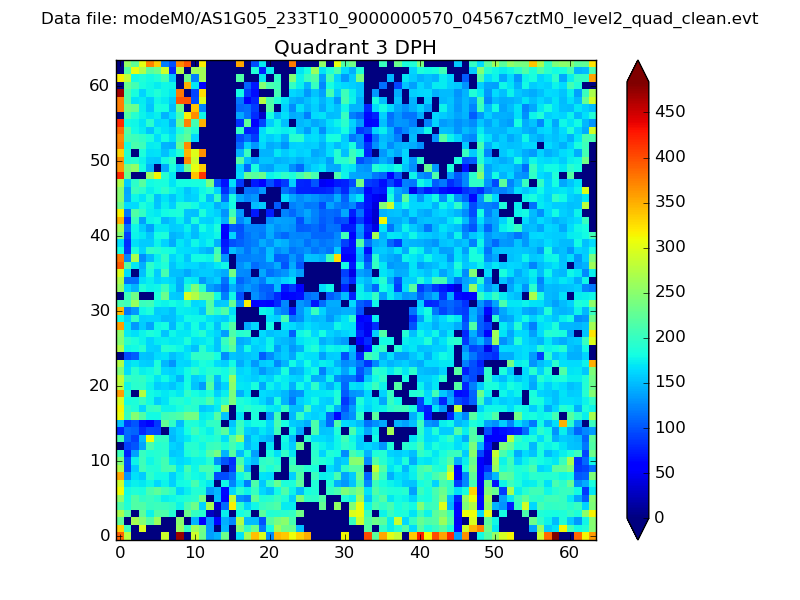 |
 |
Quadrant C |
| Plot type | Count rate plots | Images |
|---|---|---|
| Comparison with Poisson distribution Blue bars denote a histogram of data divided into 1 sec bins. Red curve is a Poisson curve with rate = median count rate of data. |
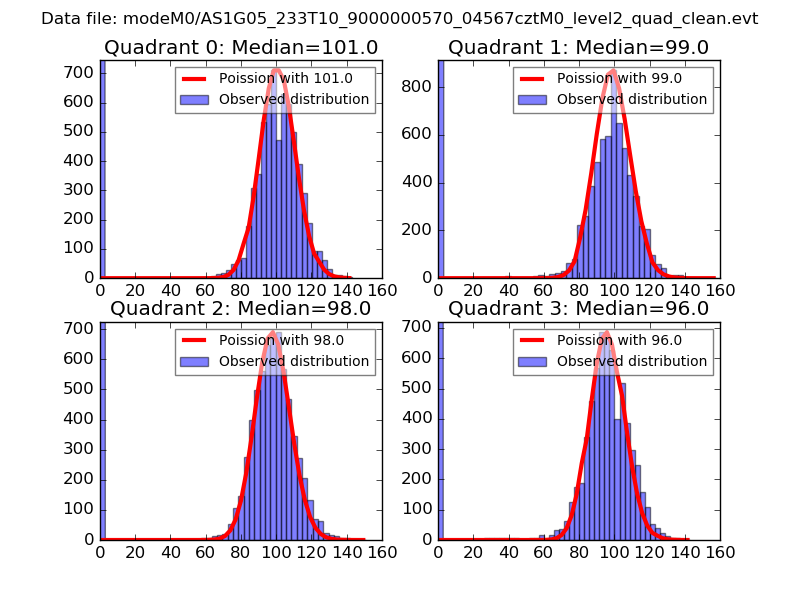 |
 |
| Quadrant-wise count rates Data is divided into 100 sec bins |
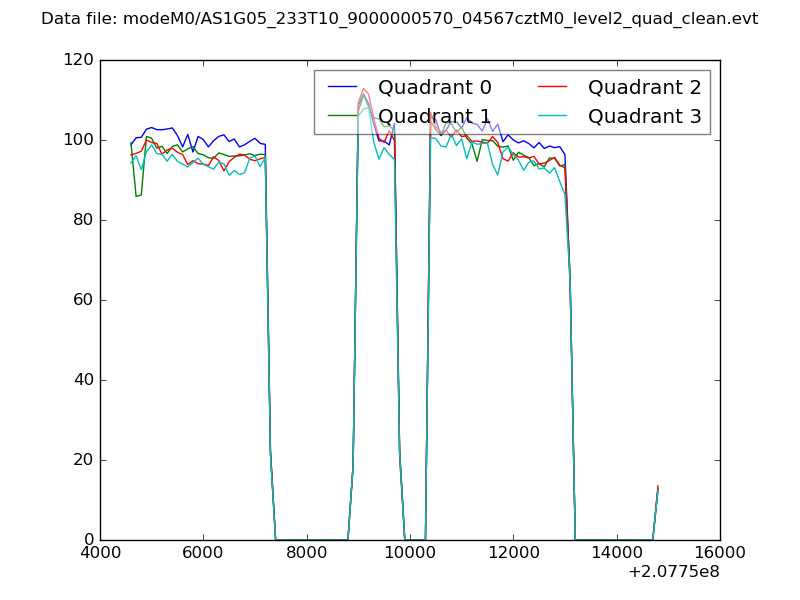 |
|
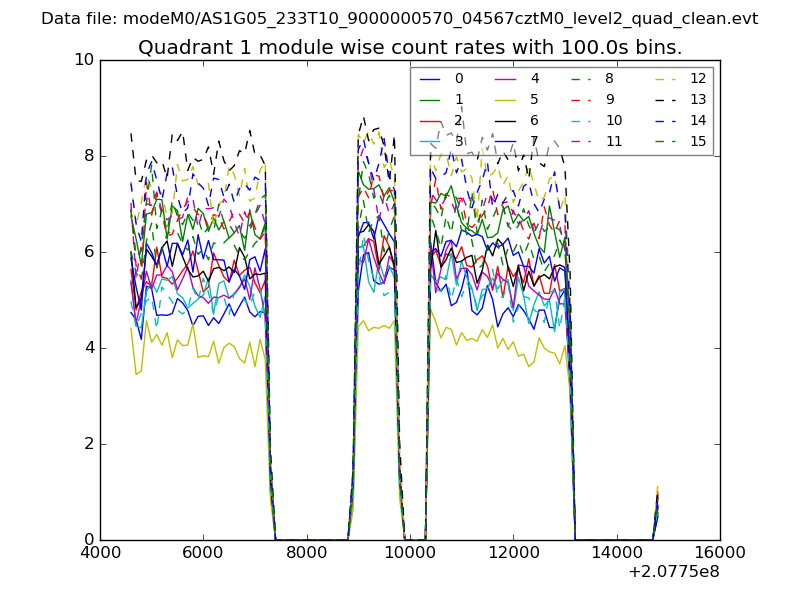
| Module-wise count rates for Quadrant A Data is divided into 100 sec bins |
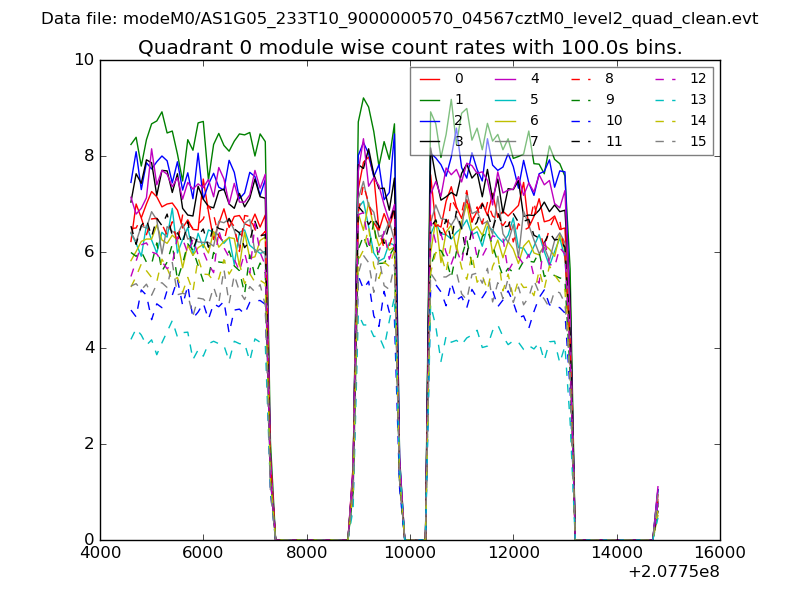 |
 |
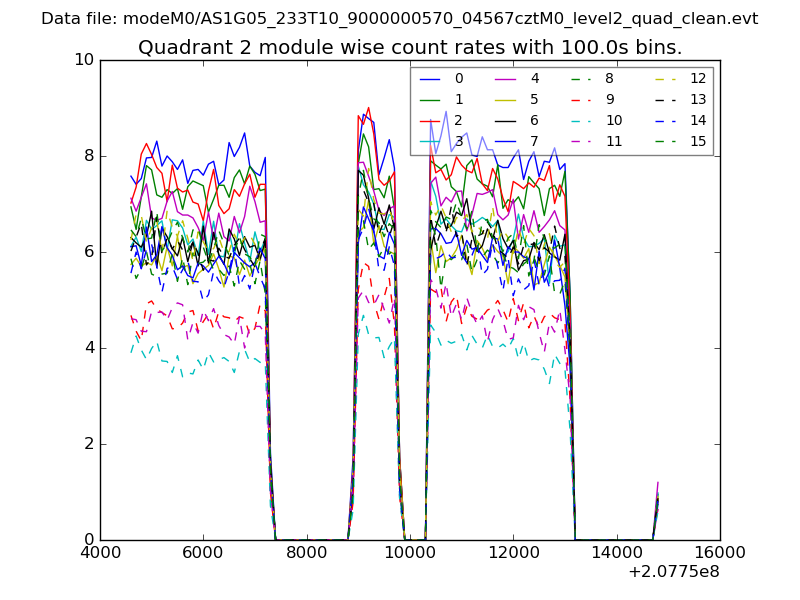
| Module-wise count rates for Quadrant B Data is divided into 100 sec bins |
 |
 |
| Module-wise count rates for Quadrant C Data is divided into 100 sec bins |
 |
 |
| Module-wise count rates for Quadrant D Data is divided into 100 sec bins |
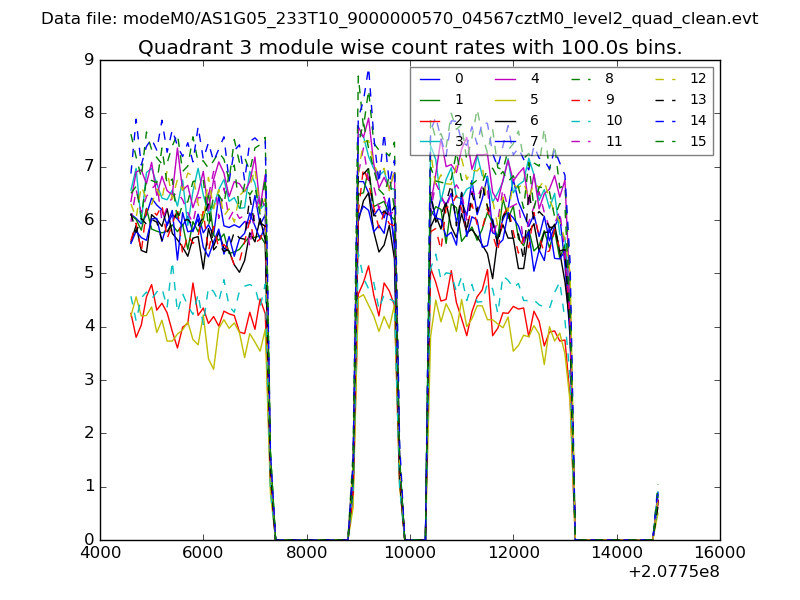 |
 |
| Parameter | Plot |
|---|---|
| CZT HV Monitor | 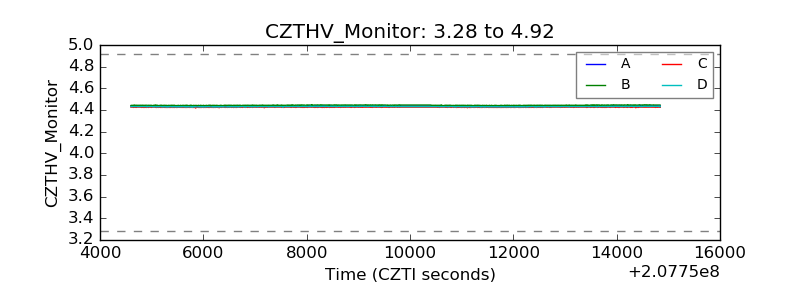 |
| D_VDD | 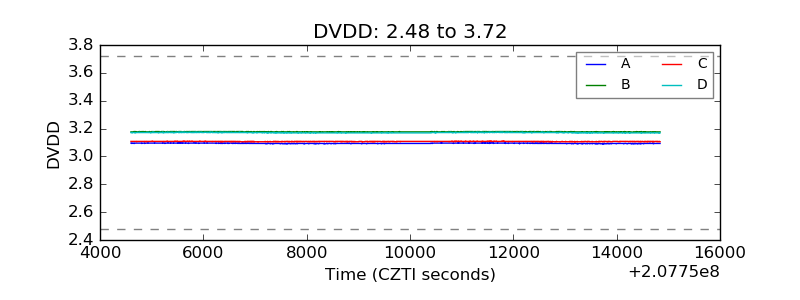 |
| Temperature 1 | 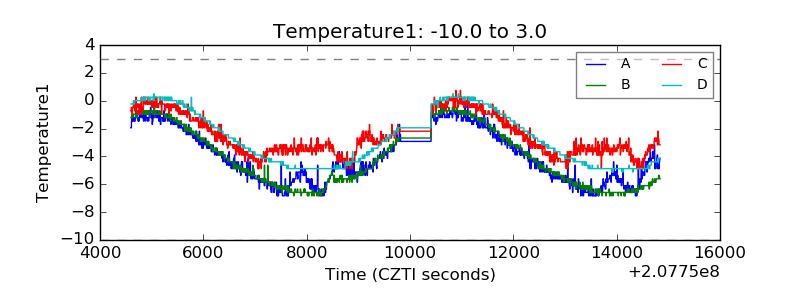 |
| Veto HV Monitor | 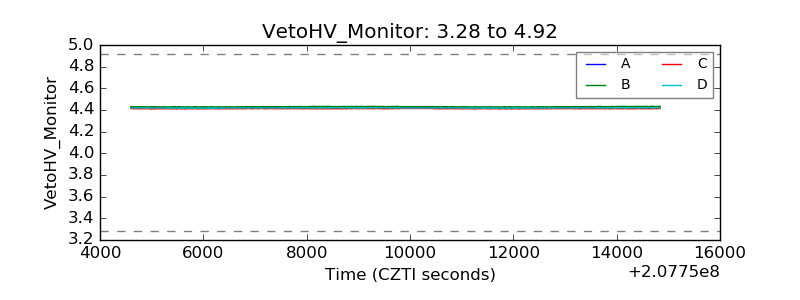 |
| Veto LLD | 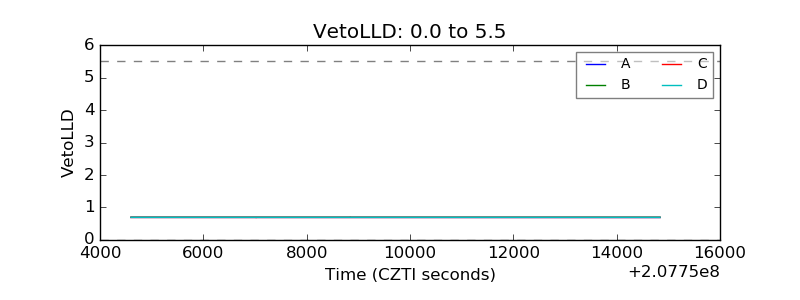 |
| Alpha Counter | 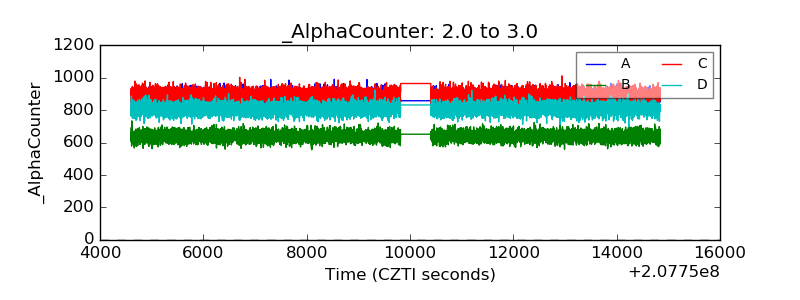 |
| _CPM_Rate | 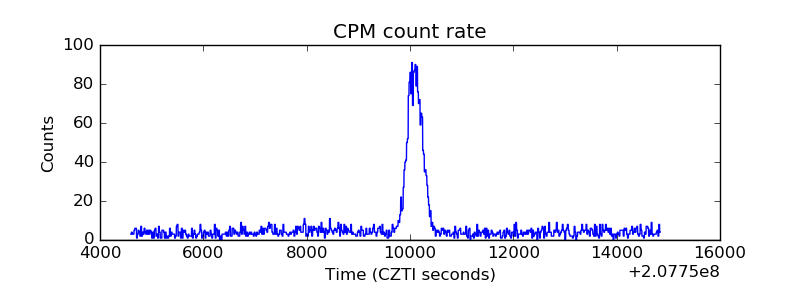 |
| CZT Counter | 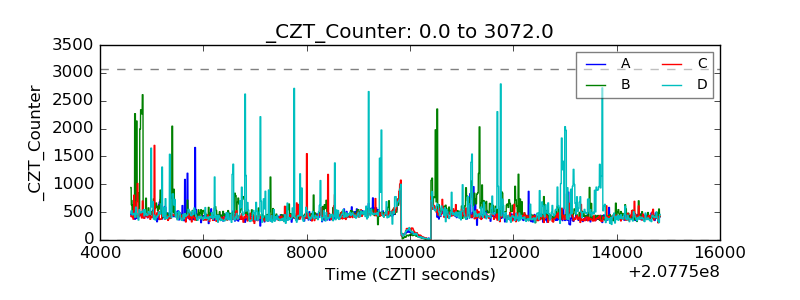 |
| +2.5 Volts monitor | 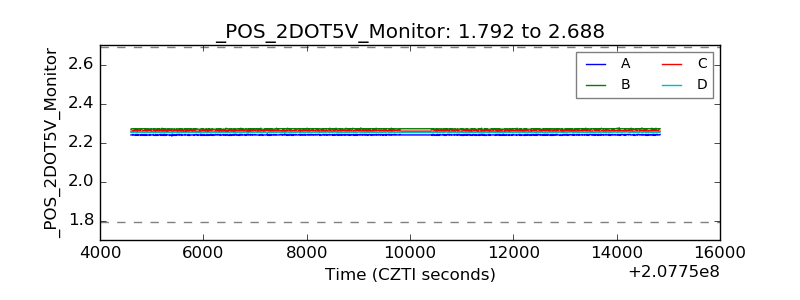 |
| +5 Volts monitor | 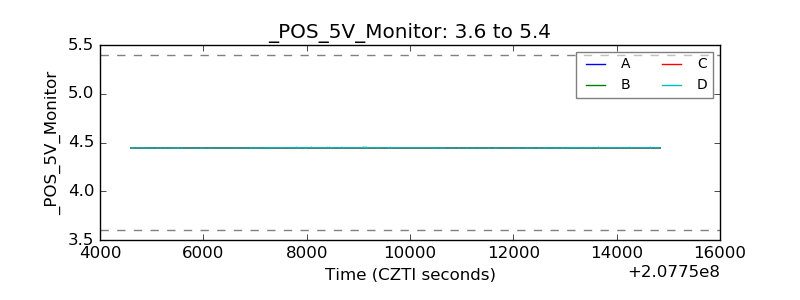 |
| _ROLL_ROT | 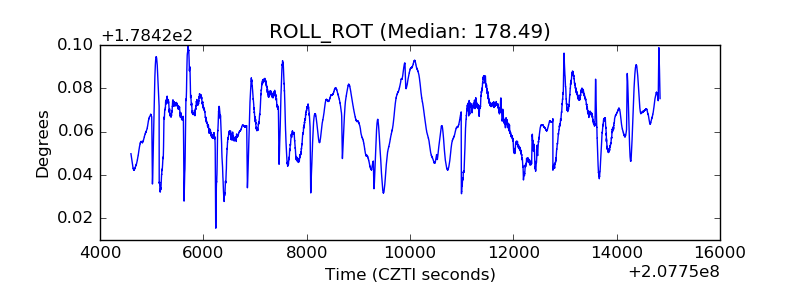 |
| _Roll_DEC | 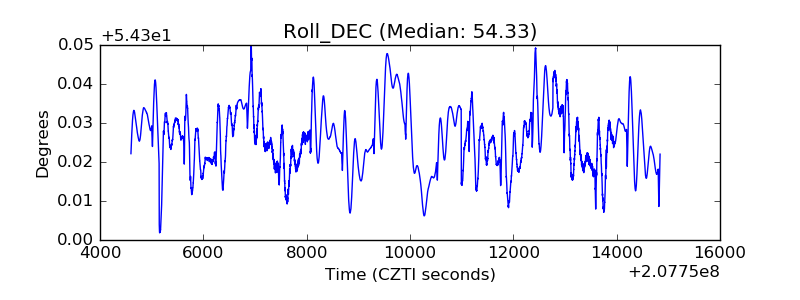 |
| _Roll_RA | 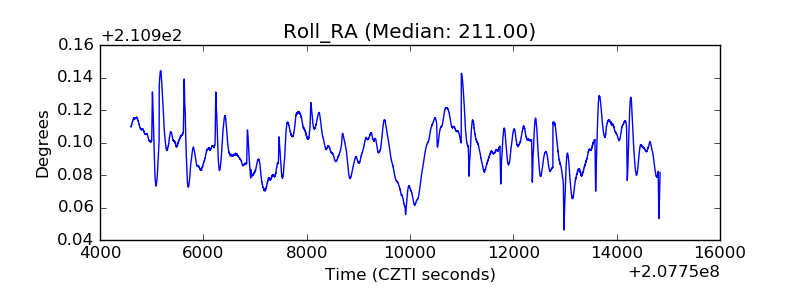 |
| Veto Counter | 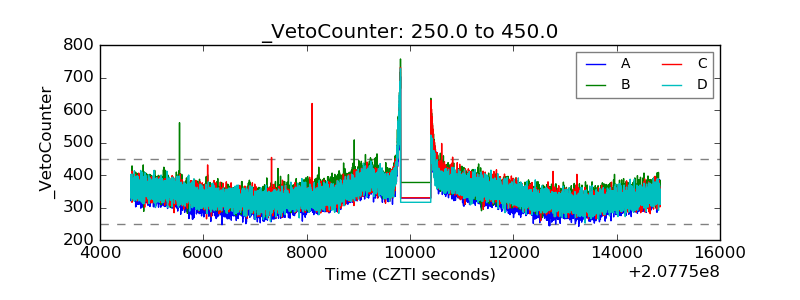 |