| Param | Original file | Final file |
|---|---|---|
| Filename | modeM0/AS1G05_233T10_9000000570_04568cztM0_level2.evt | modeM0/AS1G05_233T10_9000000570_04568cztM0_level2_quad_clean.evt |
| Size (bytes) | 1,586,969,280 | 271,615,680 |
| Size | 1.5 GB | 259.0 MB |
| Events in quadrant A | 10,325,122 | 1,702,304 |
| Events in quadrant B | 12,362,394 | 1,664,759 |
| Events in quadrant C | 11,087,313 | 1,658,802 |
| Events in quadrant D | 12,717,997 | 1,603,027 |
| Mode M9 | |||
|---|---|---|---|
| Quadrant | BADHDUFLAG | Total packets | Discarded packets |
| A | 0 | 27 | 0 |
| B | 0 | 27 | 0 |
| C | 0 | 27 | 0 |
| D | 0 | 27 | 0 |
| Mode M0 | |||
|---|---|---|---|
| Quadrant | BADHDUFLAG | Total packets | Discarded packets |
| A | 0 | 47528 | 5 |
| B | 0 | 52446 | 4 |
| C | 0 | 49690 | 4 |
| D | 0 | 54454 | 4 |
| Mode SS | |||
|---|---|---|---|
| Quadrant | BADHDUFLAG | Total packets | Discarded packets |
| A | 0 | 470 | 0 |
| B | 0 | 470 | 0 |
| C | 0 | 470 | 0 |
| D | 0 | 470 | 0 |
| Quadrant | Total seconds | Saturated seconds | Saturation percentage |
|---|---|---|---|
| A | 23218 | 128 | 0.551296% |
| B | 23218 | 338 | 1.455767% |
| C | 23218 | 231 | 0.994918% |
| D | 23218 | 598 | 2.575588% |
Noise dominated data is calculated using 1-second bins in cleaned event files. If a bin has >2000 counts, and if more than 50% of those come from <1% of pixels, then it is considered to be noise-dominated and hence unusable.
| Quadrant | # 1 sec bins | Bins with >0 counts | Bins with >2000 counts | High rate bins dominated by noise | Noise dominated (total time) | Noise dominated (detector-on time) | Marked lightcurve |
|---|---|---|---|---|---|---|---|
| A | 25823 | 23222 | 11 | 11 | 0.04% | 0.05% | 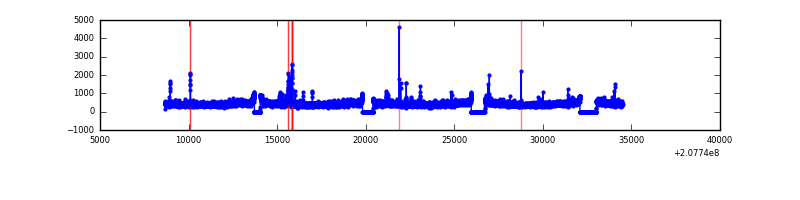 |
| B | 25823 | 23222 | 102 | 102 | 0.39% | 0.44% | 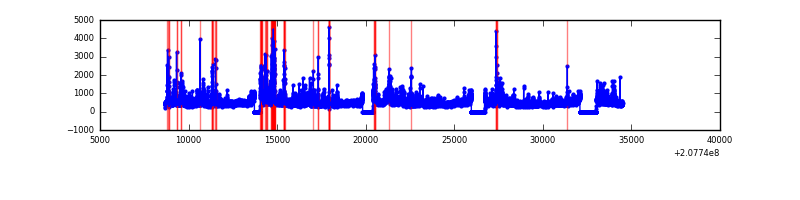 |
| C | 25823 | 23222 | 82 | 82 | 0.32% | 0.35% | 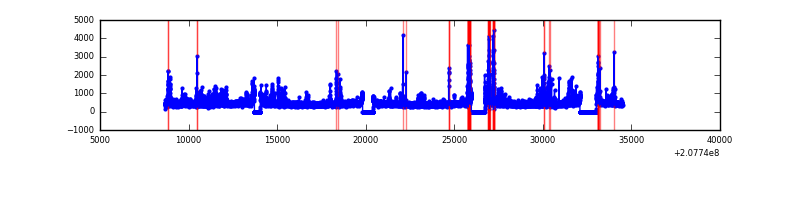 |
| D | 25822 | 23221 | 382 | 382 | 1.48% | 1.65% | 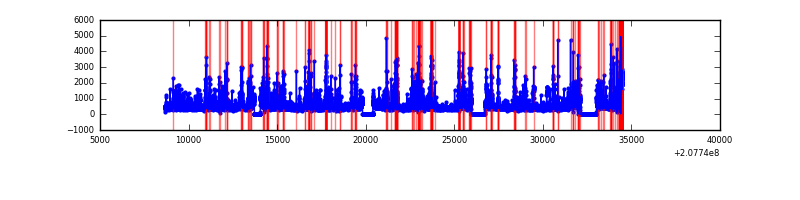 |
Top three noisy pixels from each quadrant. If the there are fewer than three noisy pixels in the level2.evt file, extra rows are filled as -1
| Pixel properties | Quadrant properties | ||||||
|---|---|---|---|---|---|---|---|
| Quadrant | DetID | PixID | Counts | Sigma | Mean | Median | Sigma |
| A | 13 | 251 | 98729 | 179.96 | 2625 | 2561 | 534.4 |
| A | 7 | 16 | 50784 | 90.24 | 2625 | 2561 | 534.4 |
| A | 12 | 194 | 26918 | 45.58 | 2625 | 2561 | 534.4 |
| B | 14 | 167 | 907735 | 1800.48 | 2641 | 2572 | 502.7 |
| B | 5 | 70 | 207492 | 407.61 | 2641 | 2572 | 502.7 |
| B | 4 | 80 | 194370 | 381.51 | 2641 | 2572 | 502.7 |
| C | 14 | 48 | 559521 | 942.42 | 2550 | 2555 | 591.0 |
| C | 9 | 247 | 511432 | 861.05 | 2550 | 2555 | 591.0 |
| C | 13 | 61 | 21229 | 31.6 | 2550 | 2555 | 591.0 |
| D | 13 | 235 | 1406556 | 2291.37 | 2532 | 2461 | 612.8 |
| D | 7 | 67 | 366783 | 594.54 | 2532 | 2461 | 612.8 |
| D | 2 | 136 | 325637 | 527.4 | 2532 | 2461 | 612.8 |
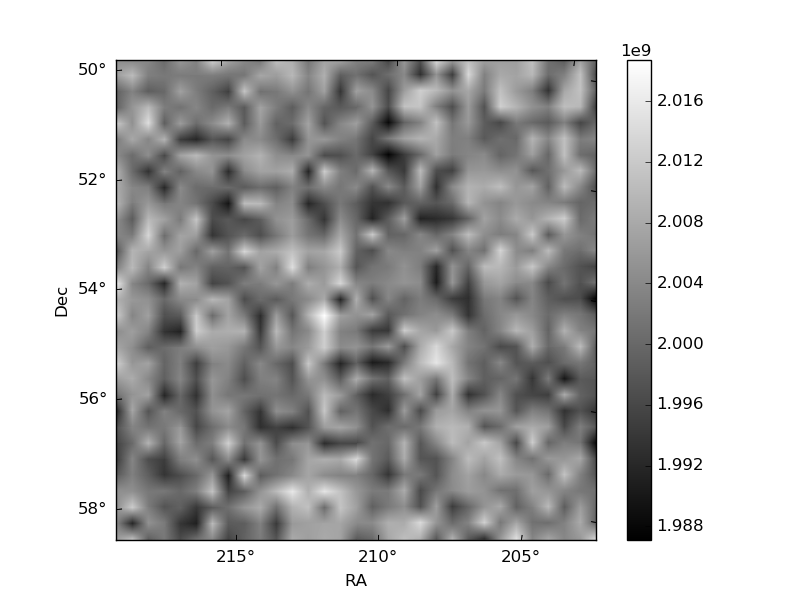
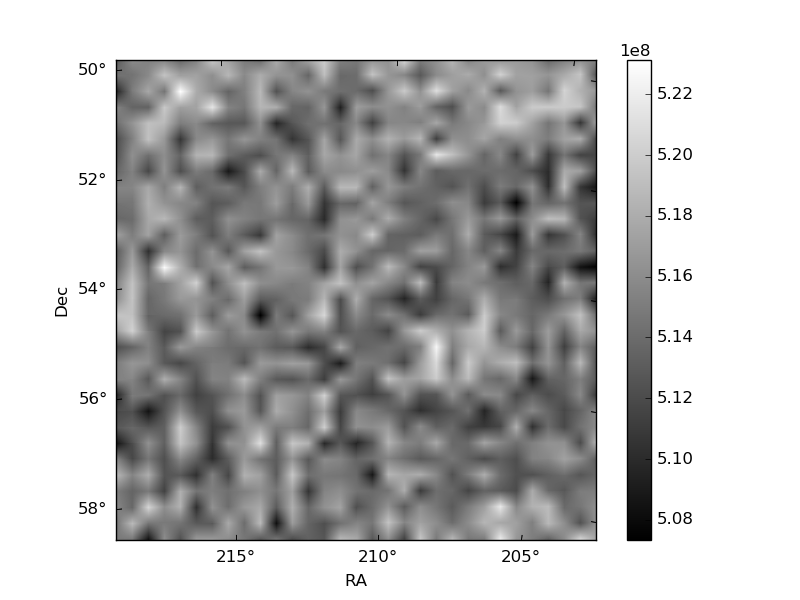
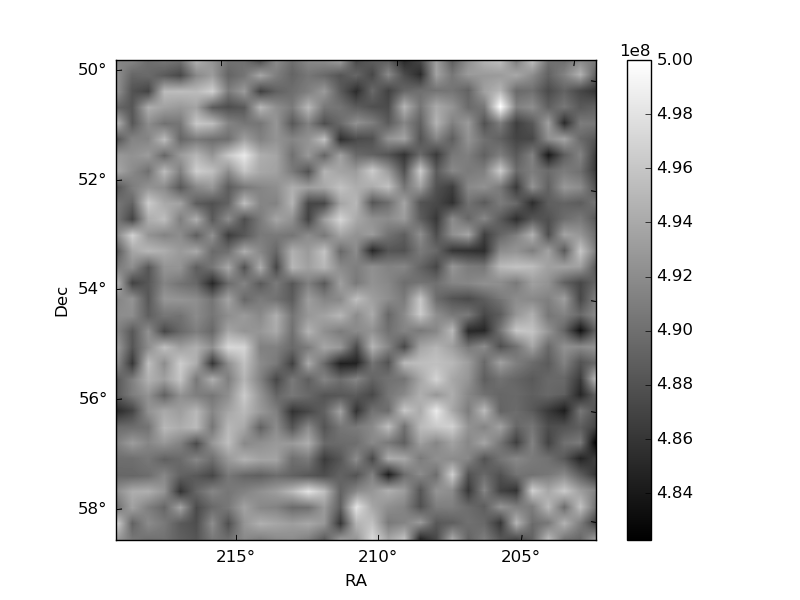
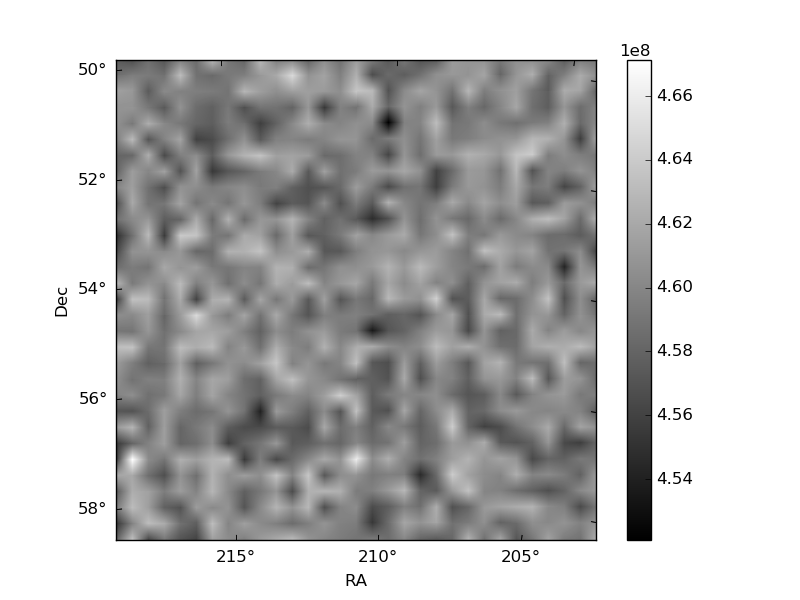
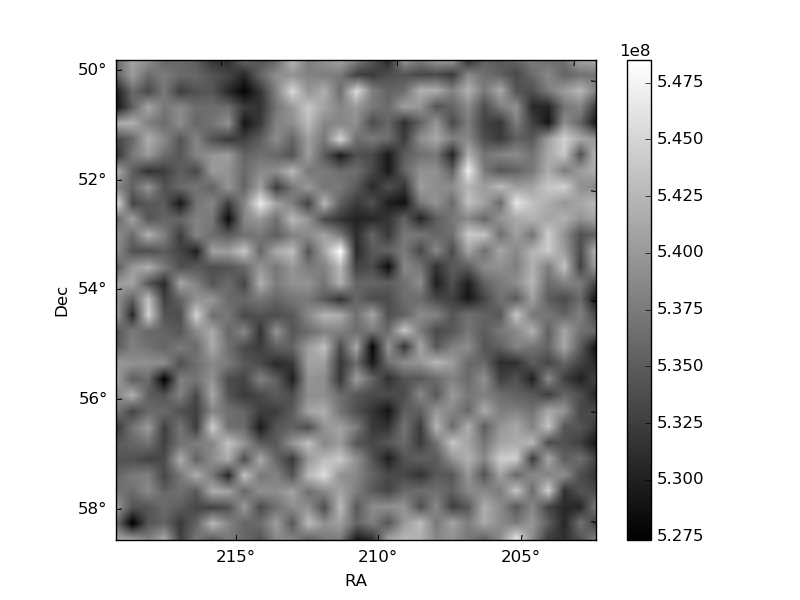
Histogram calculated using DETX and DETY for each event in the final _common_clean file
| Quadrant A | 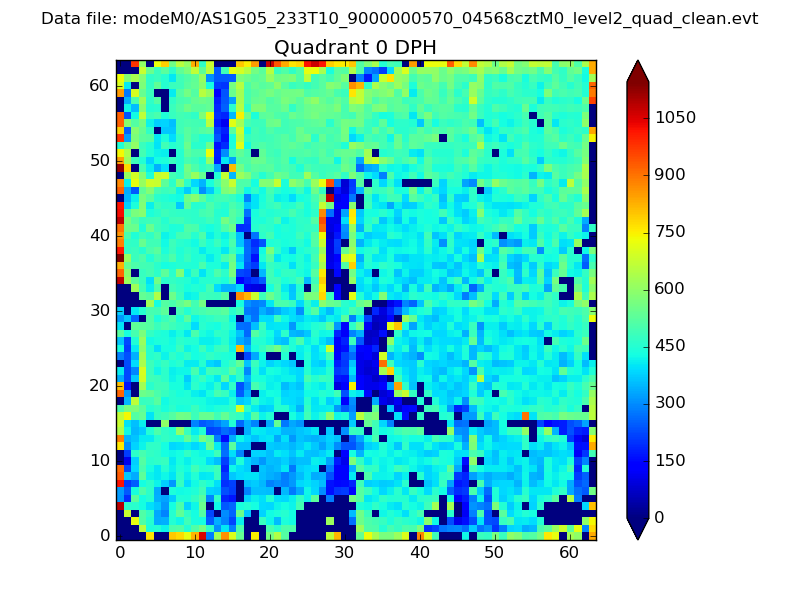 |
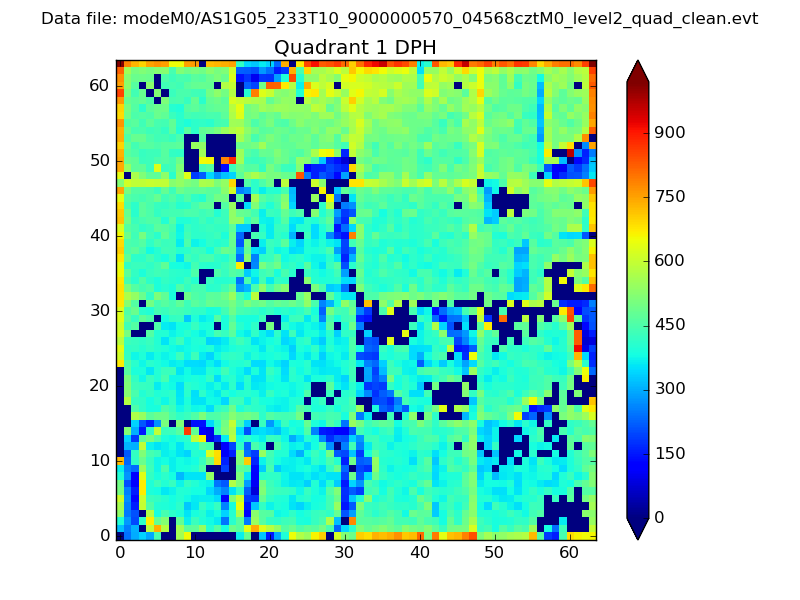 |
Quadrant B |
|---|---|---|---|
| Quadrant D | 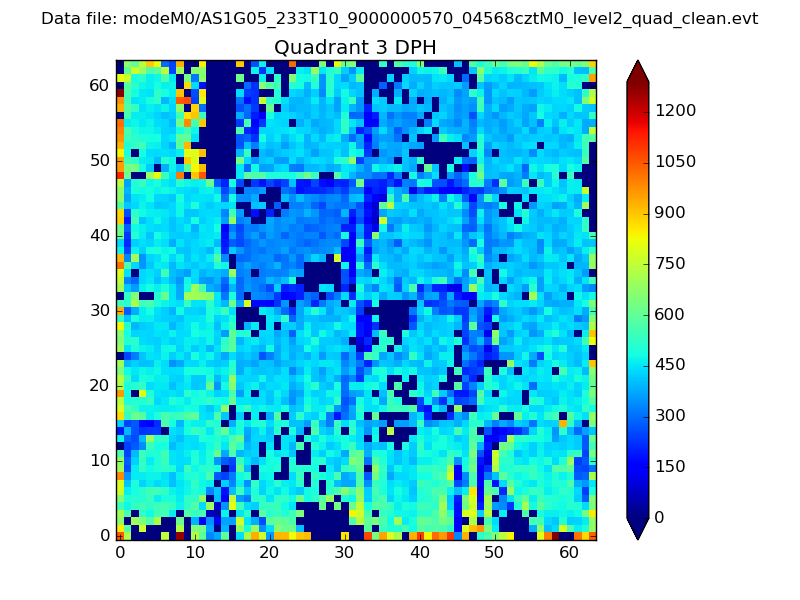 |
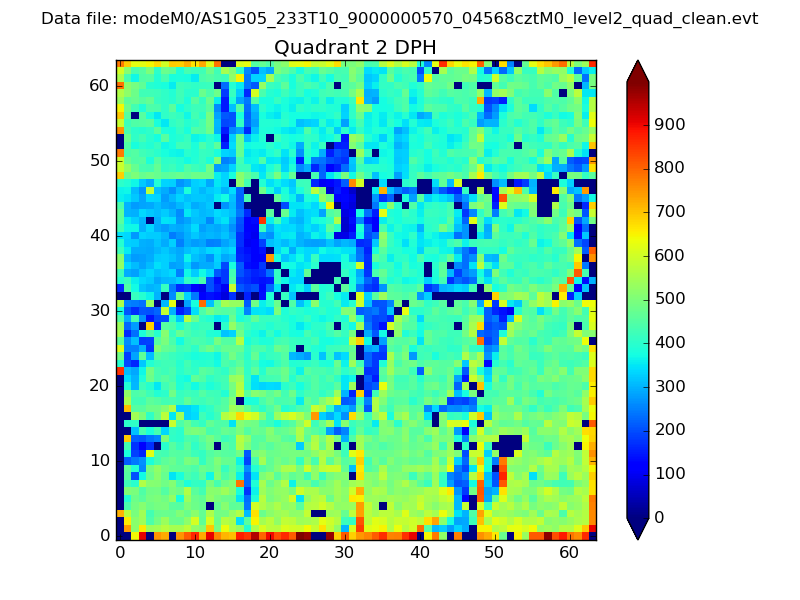 |
Quadrant C |
| Plot type | Count rate plots | Images |
|---|---|---|
| Comparison with Poisson distribution Blue bars denote a histogram of data divided into 1 sec bins. Red curve is a Poisson curve with rate = median count rate of data. |
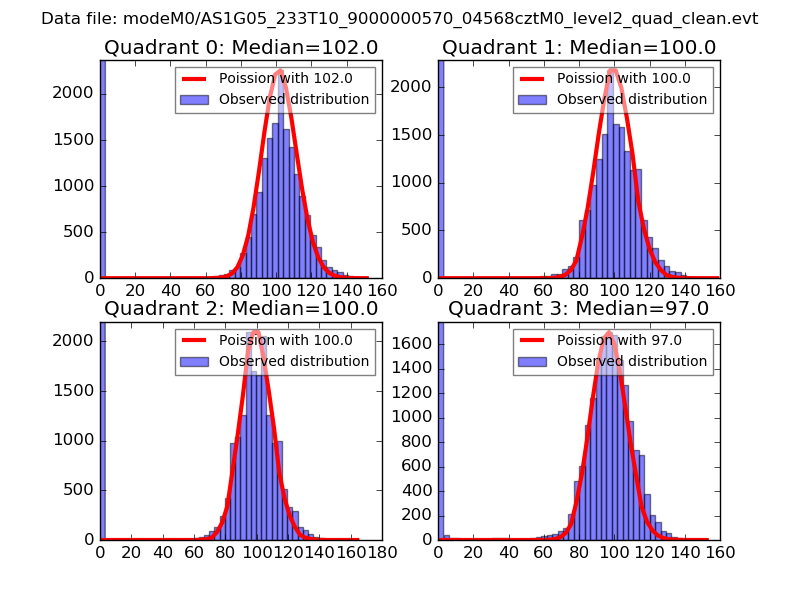 |
 |
| Quadrant-wise count rates Data is divided into 100 sec bins |
 |
|
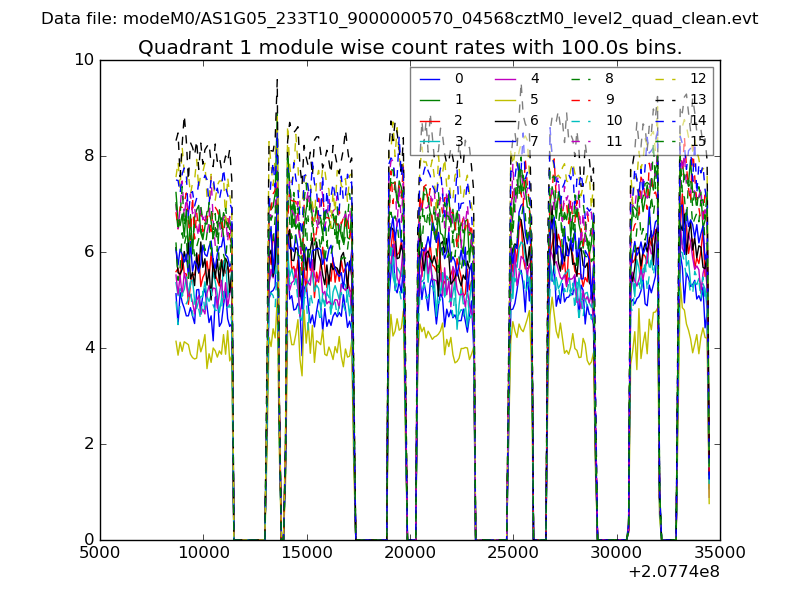
| Module-wise count rates for Quadrant A Data is divided into 100 sec bins |
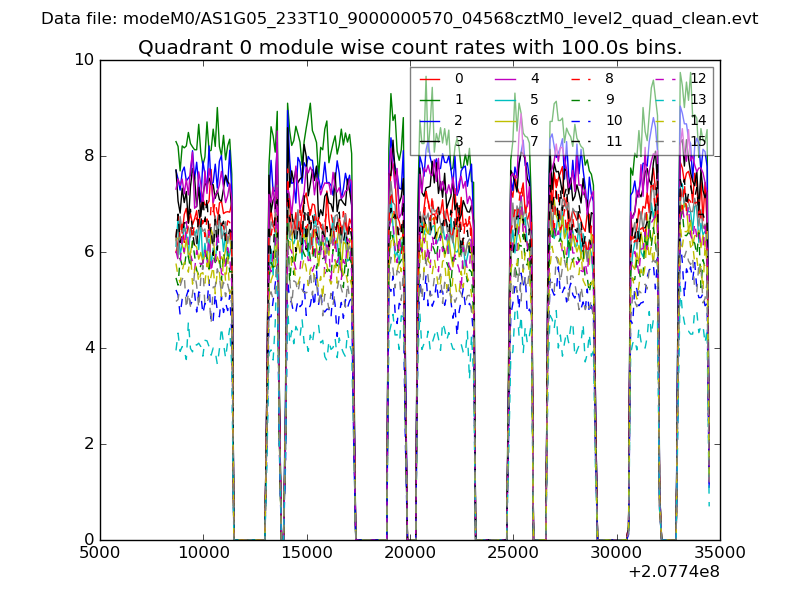 |
 |
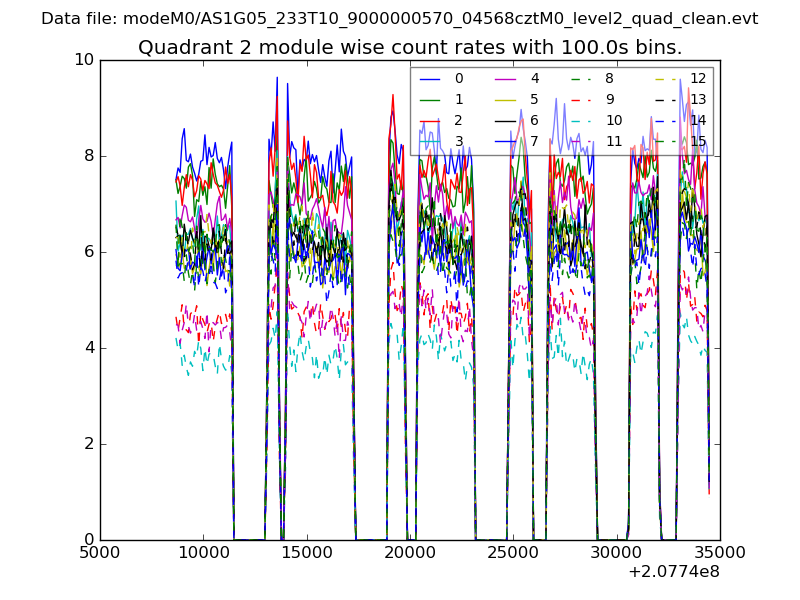
| Module-wise count rates for Quadrant B Data is divided into 100 sec bins |
 |
 |
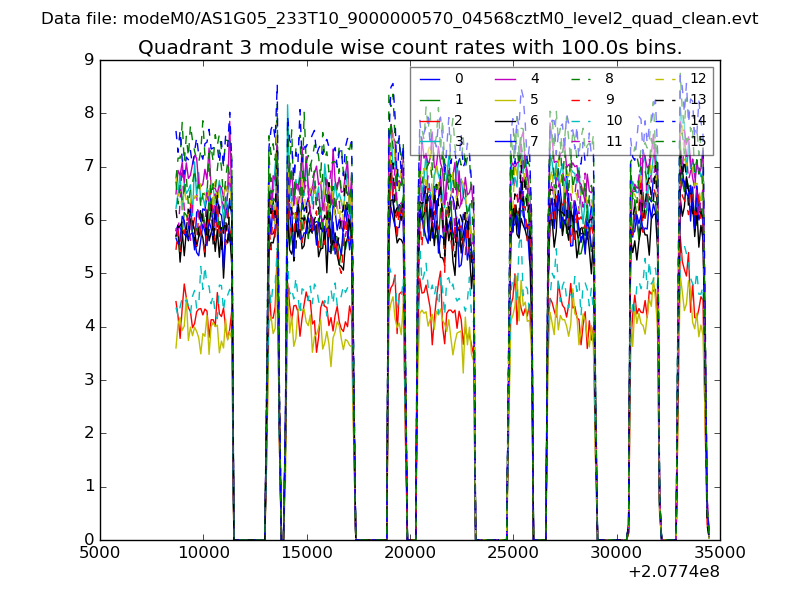
| Module-wise count rates for Quadrant C Data is divided into 100 sec bins |
 |
 |
| Module-wise count rates for Quadrant D Data is divided into 100 sec bins |
 |
 |
| Parameter | Plot |
|---|---|
| CZT HV Monitor | 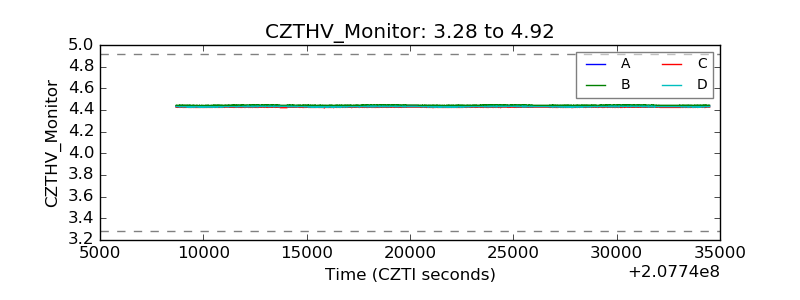 |
| D_VDD | 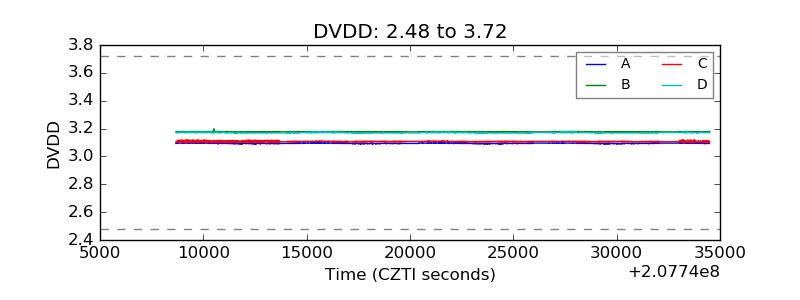 |
| Temperature 1 | 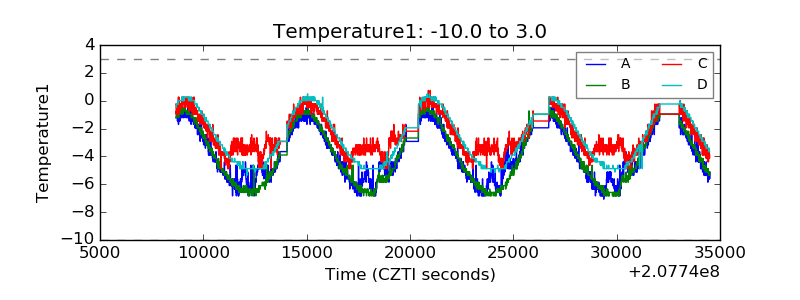 |
| Veto HV Monitor | 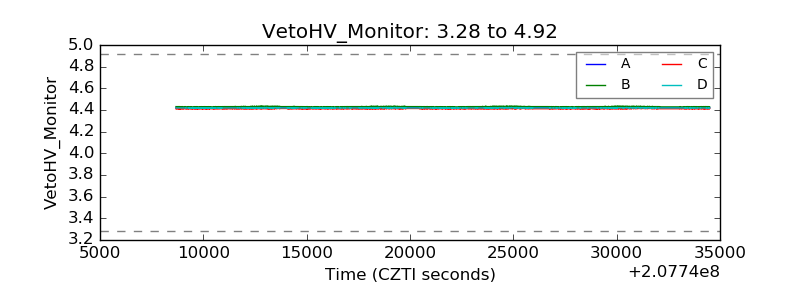 |
| Veto LLD | 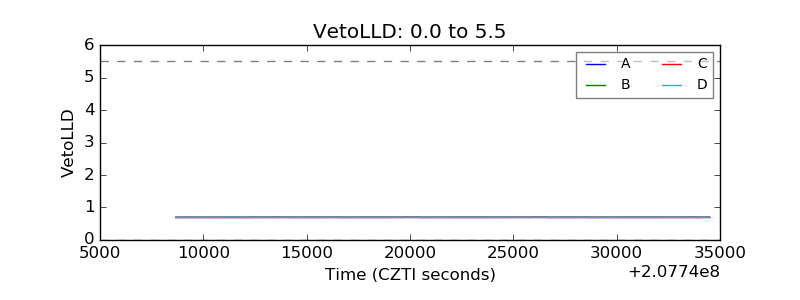 |
| Alpha Counter | 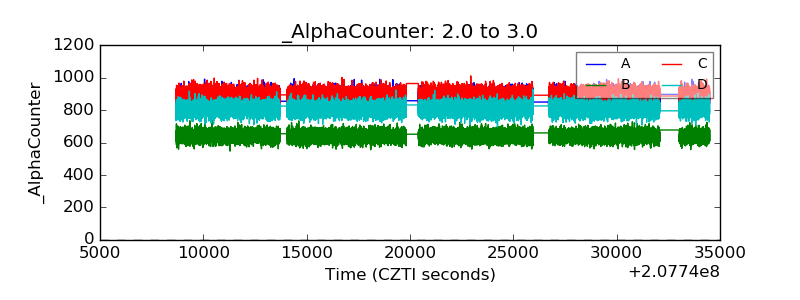 |
| _CPM_Rate | 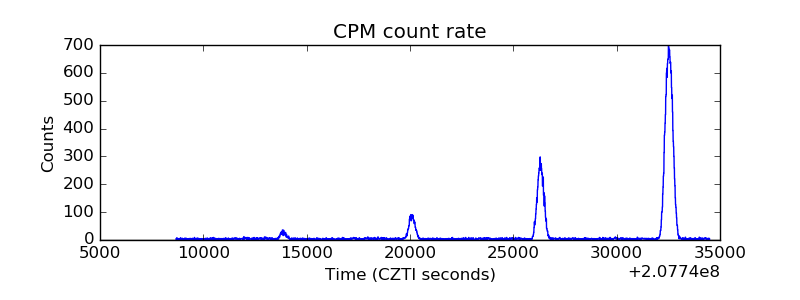 |
| CZT Counter | 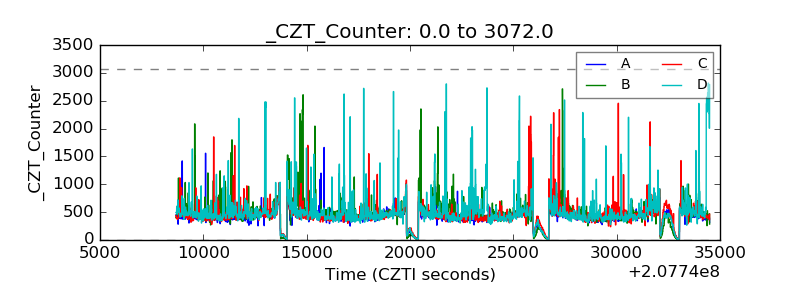 |
| +2.5 Volts monitor |  |
| +5 Volts monitor |  |
| _ROLL_ROT | 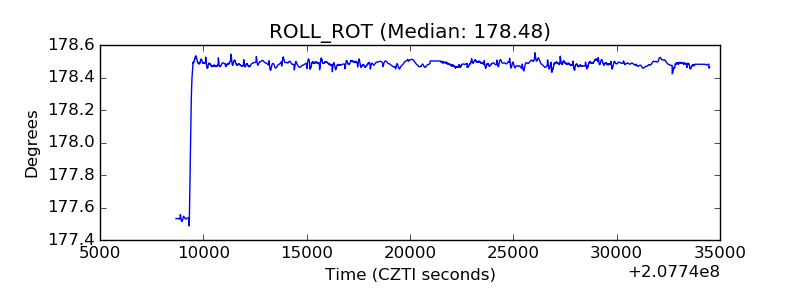 |
| _Roll_DEC | 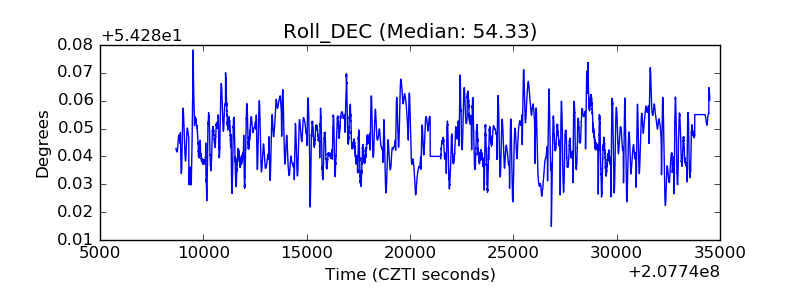 |
| _Roll_RA | 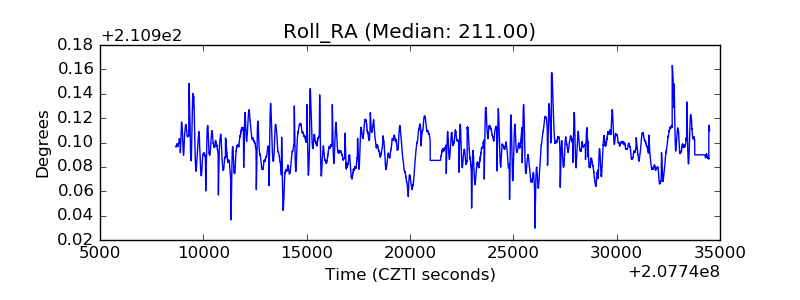 |
| Veto Counter | 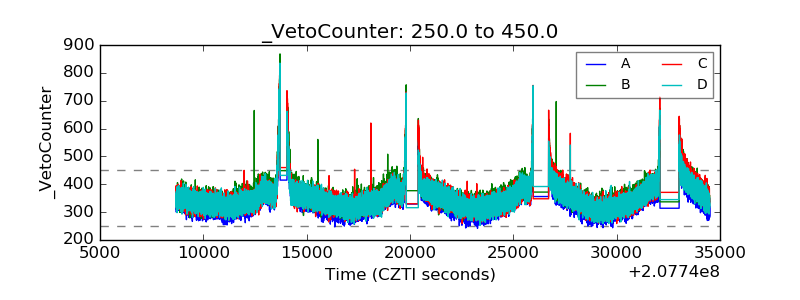 |