| Param | Original file | Final file |
|---|---|---|
| Filename | modeM0/AS1G05_233T10_9000000570_04569cztM0_level2.evt | modeM0/AS1G05_233T10_9000000570_04569cztM0_level2_quad_clean.evt |
| Size (bytes) | 542,819,520 | 82,359,360 |
| Size | 517.7 MB | 78.5 MB |
| Events in quadrant A | 2,980,198 | 528,703 |
| Events in quadrant B | 3,282,113 | 523,221 |
| Events in quadrant C | 3,245,052 | 517,518 |
| Events in quadrant D | 6,488,081 | 467,952 |
| Mode M9 | |||
|---|---|---|---|
| Quadrant | BADHDUFLAG | Total packets | Discarded packets |
| A | 0 | 16 | 0 |
| B | 0 | 16 | 0 |
| C | 0 | 16 | 0 |
| D | 0 | 17 | 0 |
| Mode M0 | |||
|---|---|---|---|
| Quadrant | BADHDUFLAG | Total packets | Discarded packets |
| A | 0 | 13582 | 3 |
| B | 0 | 14272 | 2 |
| C | 0 | 14119 | 2 |
| D | 0 | 23685 | 2 |
| Mode SS | |||
|---|---|---|---|
| Quadrant | BADHDUFLAG | Total packets | Discarded packets |
| A | 0 | 132 | 0 |
| B | 0 | 132 | 0 |
| C | 0 | 132 | 0 |
| D | 0 | 132 | 0 |
| Quadrant | Total seconds | Saturated seconds | Saturation percentage |
|---|---|---|---|
| A | 6546 | 9 | 0.137489% |
| B | 6546 | 53 | 0.809655% |
| C | 6546 | 46 | 0.702719% |
| D | 6546 | 954 | 14.573786% |
Noise dominated data is calculated using 1-second bins in cleaned event files. If a bin has >2000 counts, and if more than 50% of those come from <1% of pixels, then it is considered to be noise-dominated and hence unusable.
| Quadrant | # 1 sec bins | Bins with >0 counts | Bins with >2000 counts | High rate bins dominated by noise | Noise dominated (total time) | Noise dominated (detector-on time) | Marked lightcurve |
|---|---|---|---|---|---|---|---|
| A | 7641 | 6547 | 0 | 0 | 0.00% | 0.00% | 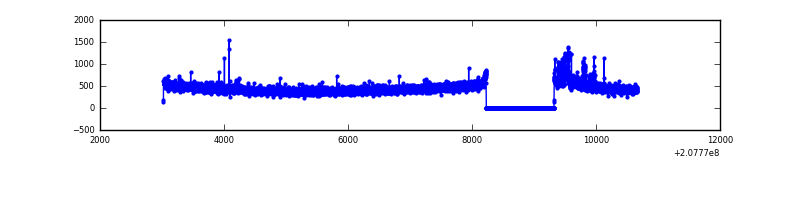 |
| B | 7641 | 6547 | 11 | 11 | 0.14% | 0.17% | 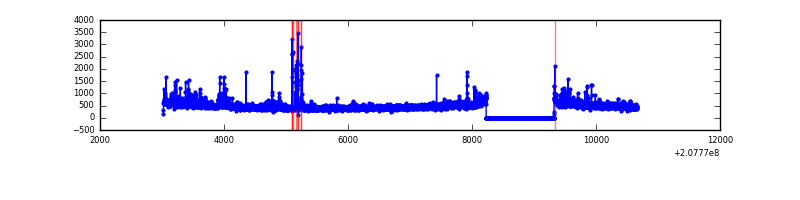 |
| C | 7641 | 6547 | 26 | 26 | 0.34% | 0.40% | 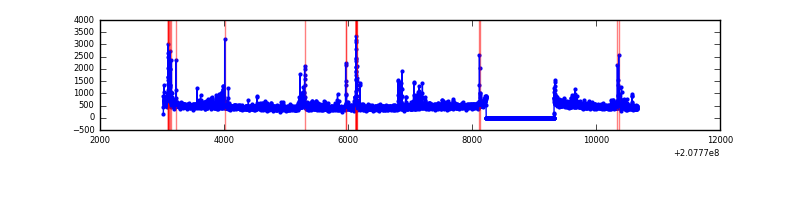 |
| D | 7641 | 6547 | 911 | 911 | 11.92% | 13.91% | 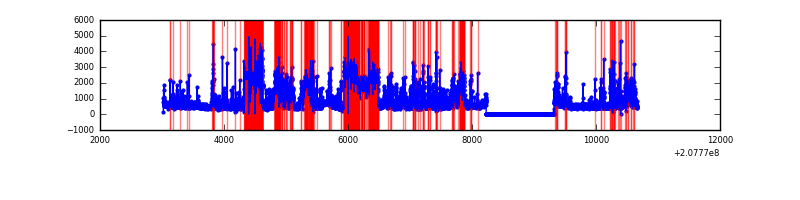 |
Top three noisy pixels from each quadrant. If the there are fewer than three noisy pixels in the level2.evt file, extra rows are filled as -1
| Pixel properties | Quadrant properties | ||||||
|---|---|---|---|---|---|---|---|
| Quadrant | DetID | PixID | Counts | Sigma | Mean | Median | Sigma |
| A | 0 | 50 | 86139 | 555.26 | 744 | 725 | 153.8 |
| A | 8 | 15 | 21574 | 135.54 | 744 | 725 | 153.8 |
| A | 12 | 194 | 7732 | 45.55 | 744 | 725 | 153.8 |
| B | 10 | 16 | 117612 | 817.73 | 751 | 733 | 142.9 |
| B | 14 | 167 | 102455 | 711.69 | 751 | 733 | 142.9 |
| B | 15 | 204 | 58606 | 404.9 | 751 | 733 | 142.9 |
| C | 14 | 48 | 306177 | 1780.22 | 729 | 731 | 171.6 |
| C | 9 | 247 | 37085 | 211.88 | 729 | 731 | 171.6 |
| C | 5 | 250 | 14635 | 81.04 | 729 | 731 | 171.6 |
| D | 13 | 235 | 2899436 | 17752.58 | 673 | 651 | 163.3 |
| D | 13 | 25 | 312709 | 1911.09 | 673 | 651 | 163.3 |
| D | 7 | 67 | 285612 | 1745.14 | 673 | 651 | 163.3 |
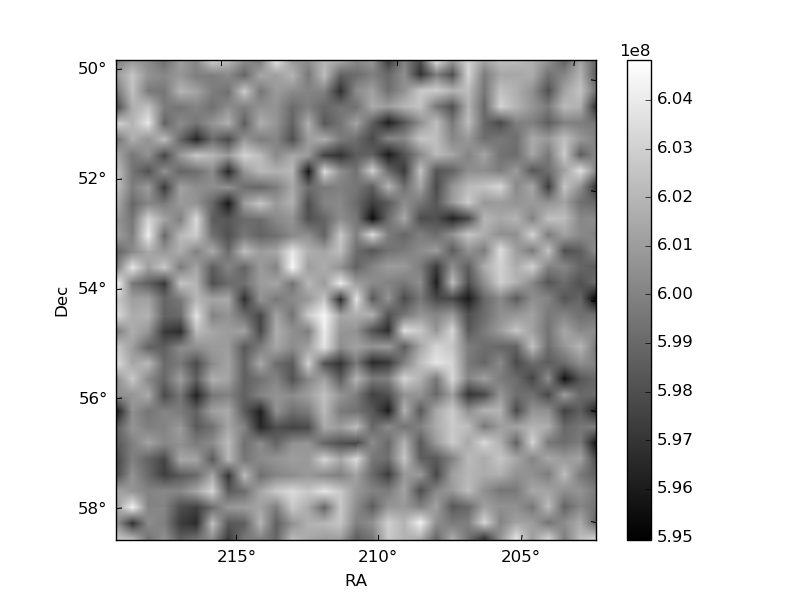
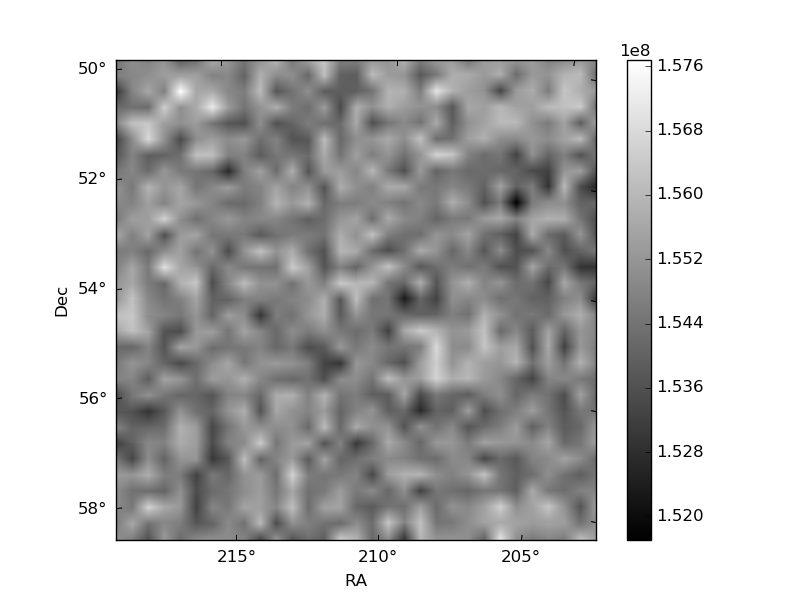
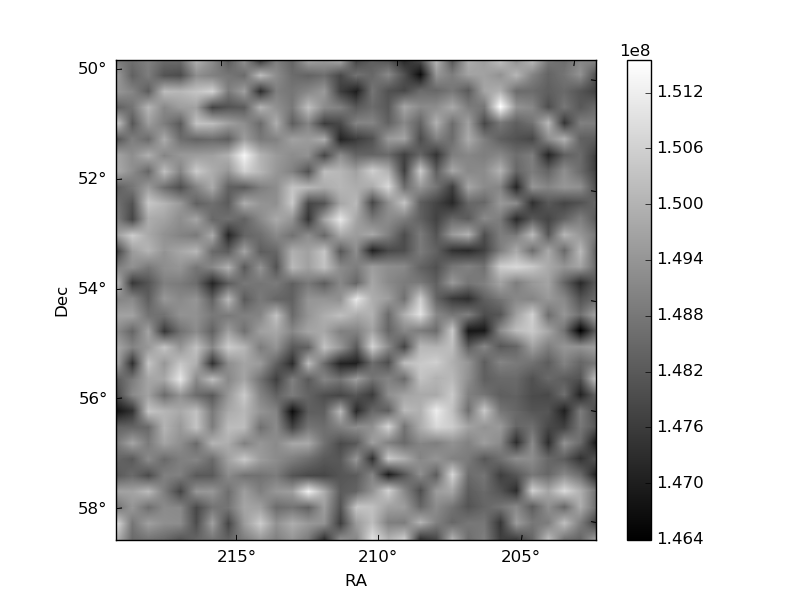
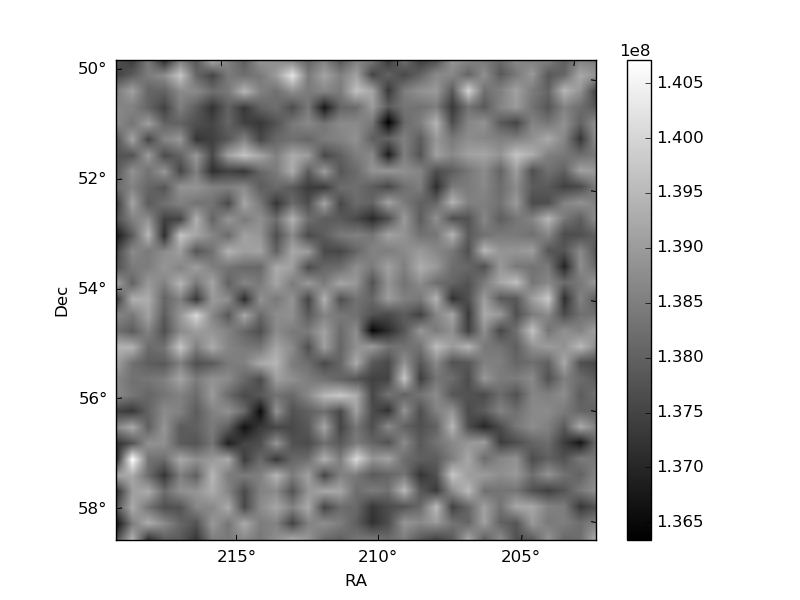
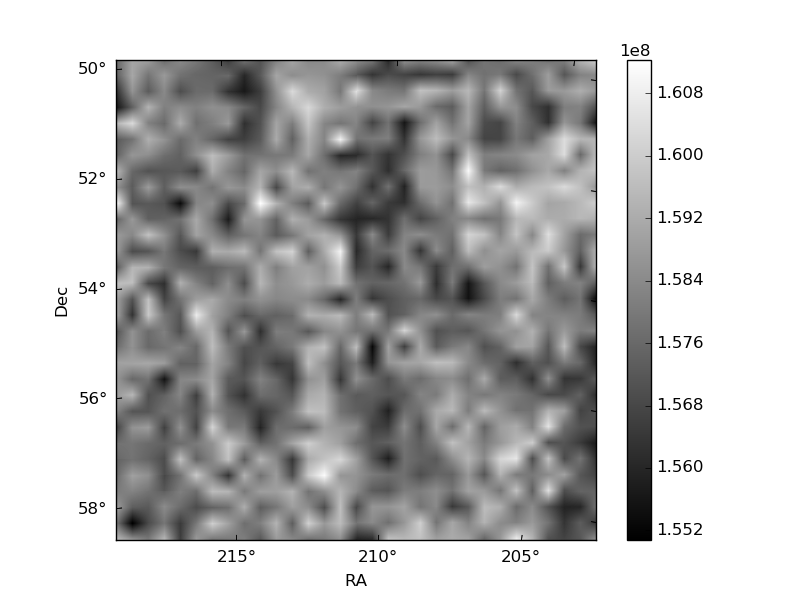
Histogram calculated using DETX and DETY for each event in the final _common_clean file
| Quadrant A | 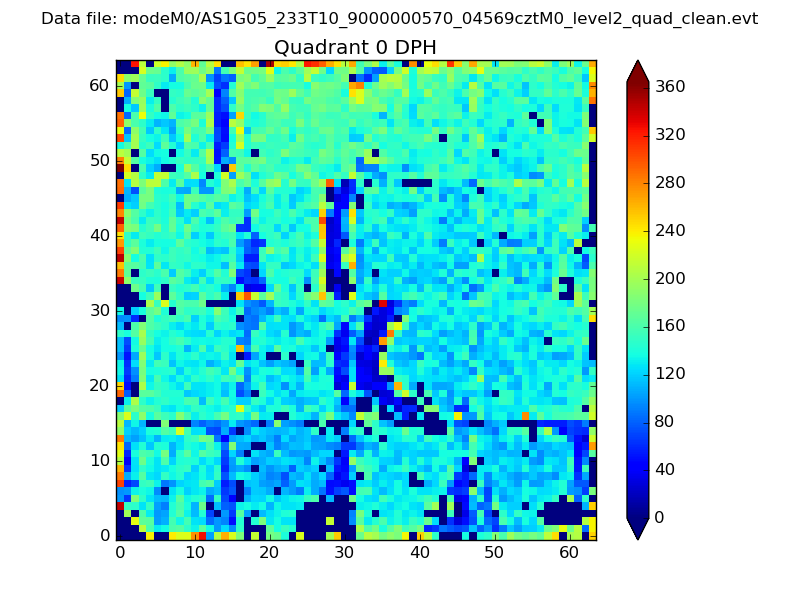 |
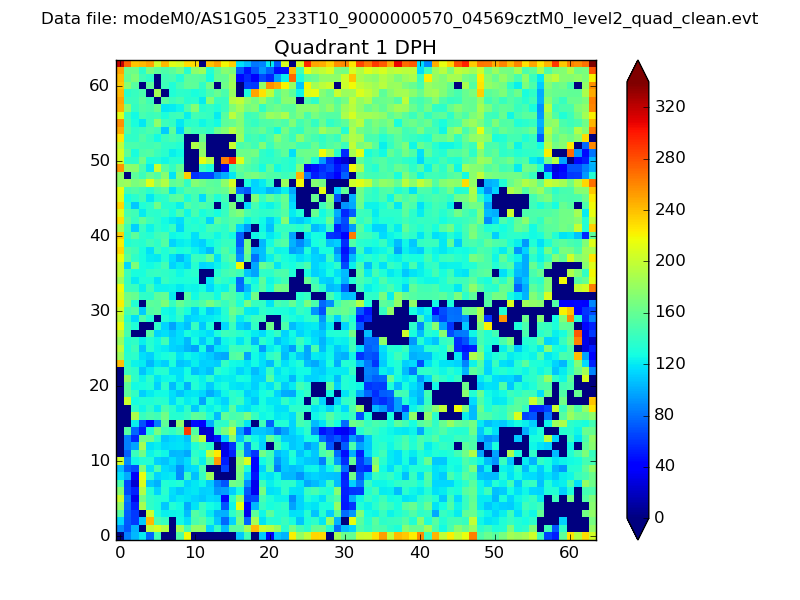 |
Quadrant B |
|---|---|---|---|
| Quadrant D | 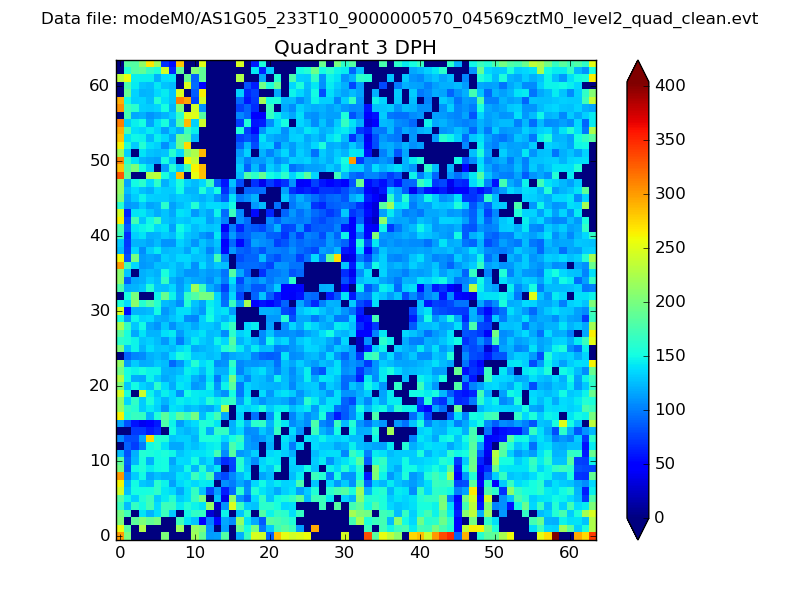 |
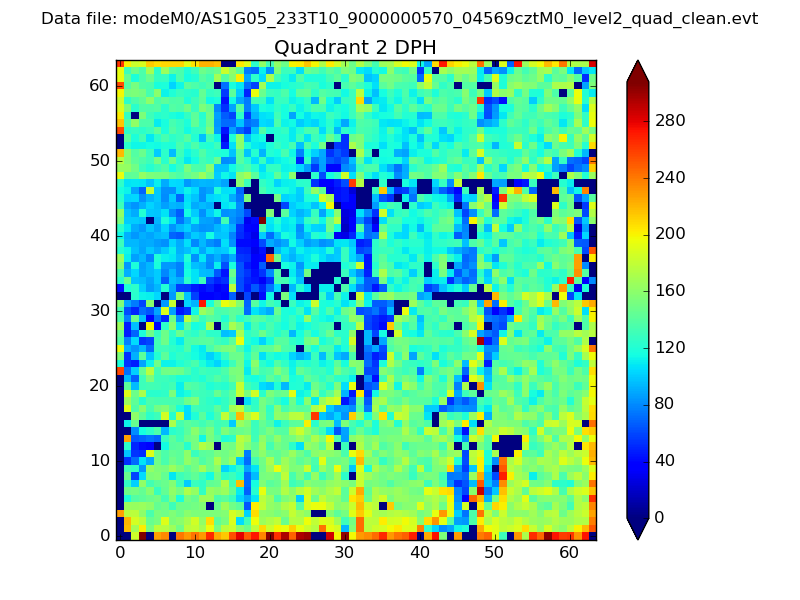 |
Quadrant C |
| Plot type | Count rate plots | Images |
|---|---|---|
| Comparison with Poisson distribution Blue bars denote a histogram of data divided into 1 sec bins. Red curve is a Poisson curve with rate = median count rate of data. |
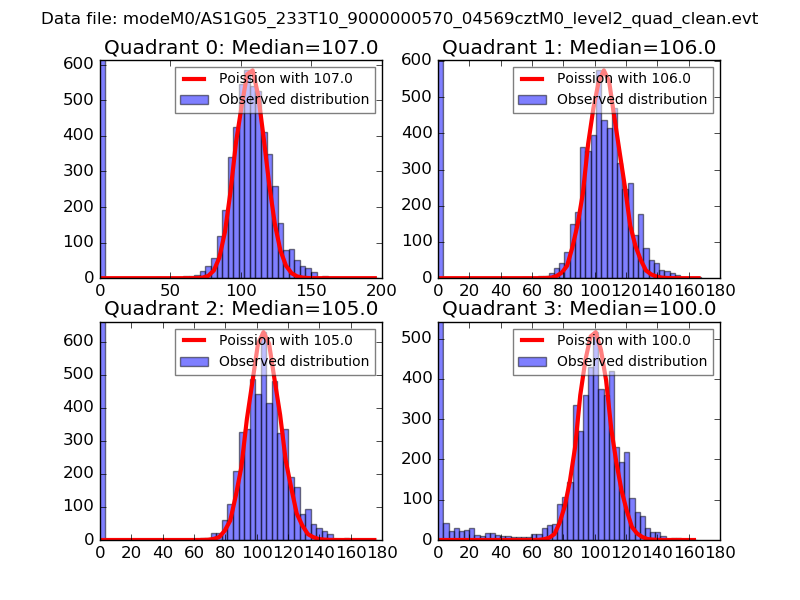 |
 |
| Quadrant-wise count rates Data is divided into 100 sec bins |
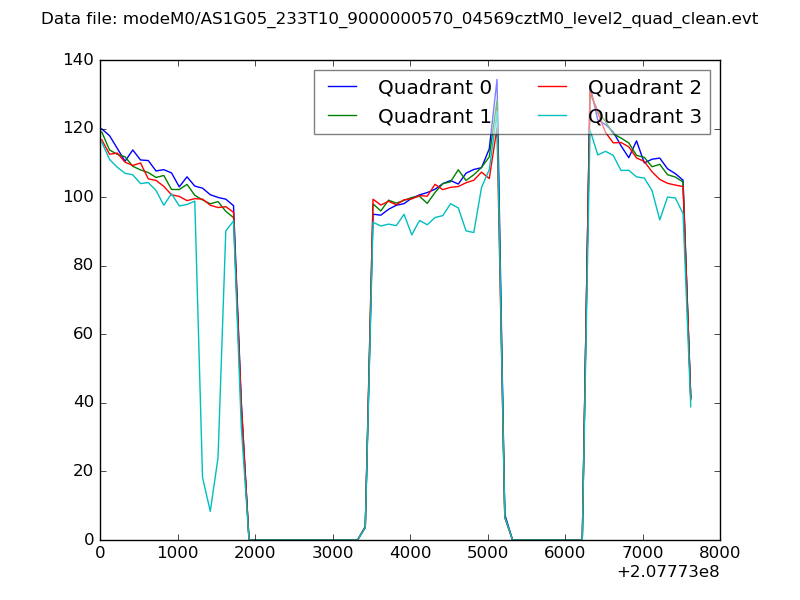 |
|
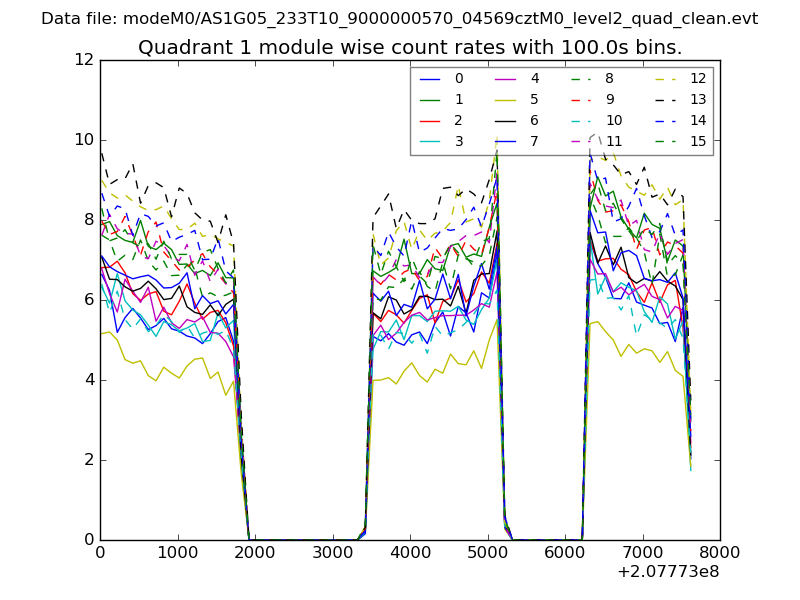
| Module-wise count rates for Quadrant A Data is divided into 100 sec bins |
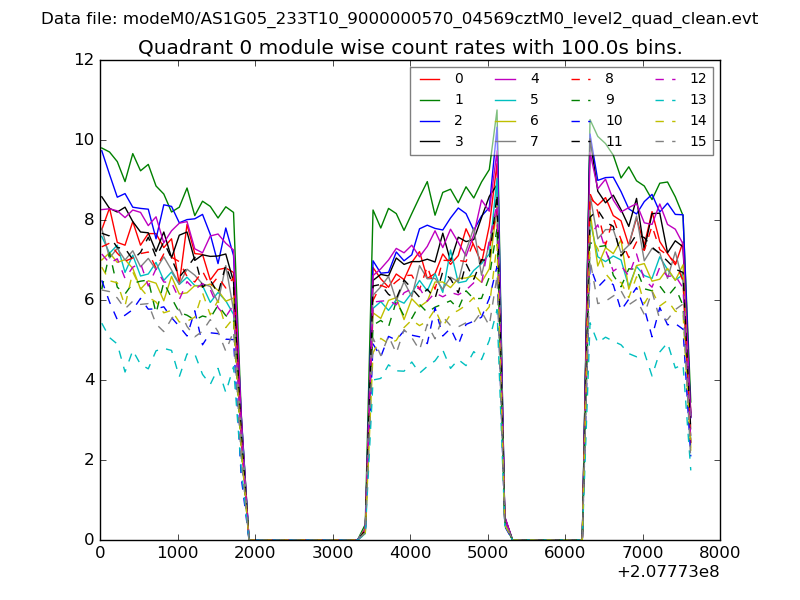 |
 |
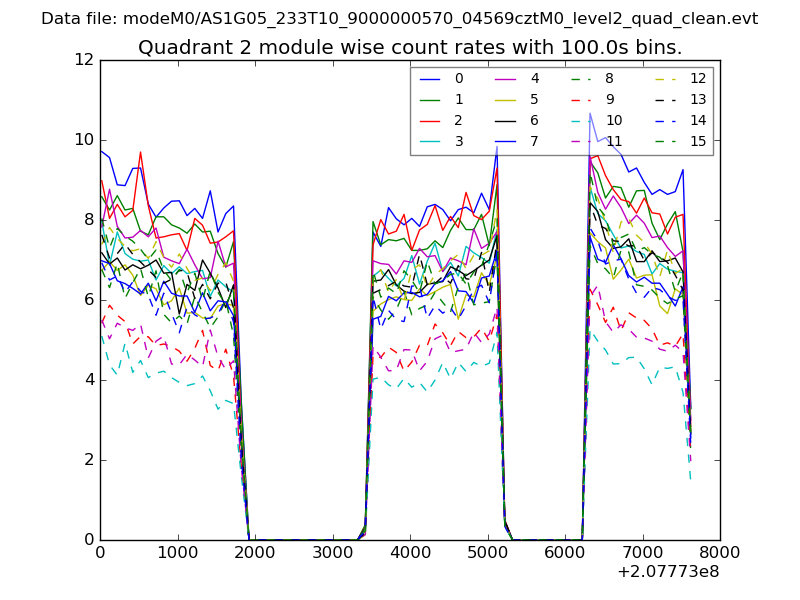
| Module-wise count rates for Quadrant B Data is divided into 100 sec bins |
 |
 |
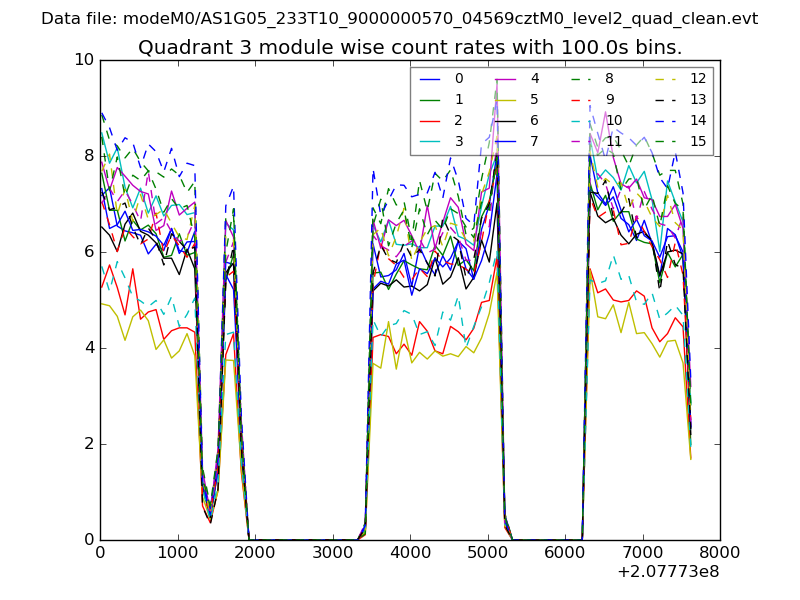
| Module-wise count rates for Quadrant C Data is divided into 100 sec bins |
 |
 |
| Module-wise count rates for Quadrant D Data is divided into 100 sec bins |
 |
 |
| Parameter | Plot |
|---|---|
| CZT HV Monitor | 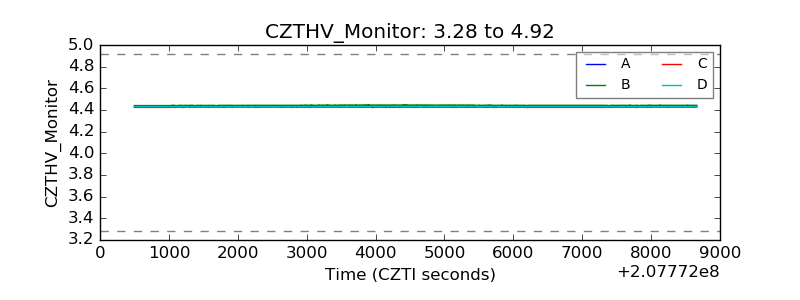 |
| D_VDD | 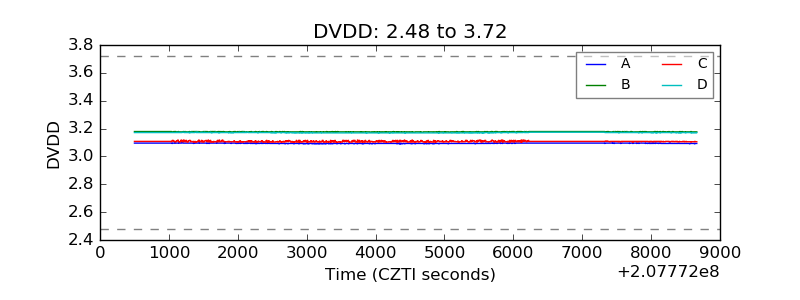 |
| Temperature 1 | 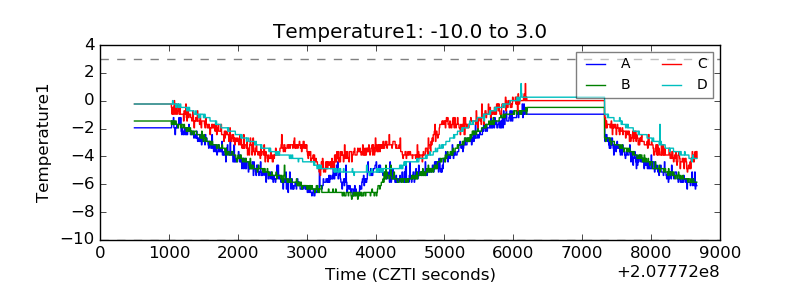 |
| Veto HV Monitor | 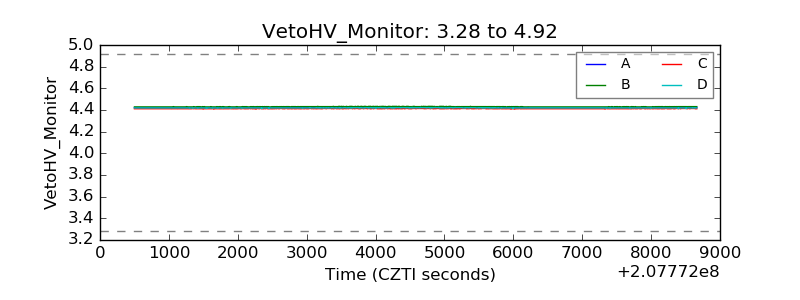 |
| Veto LLD | 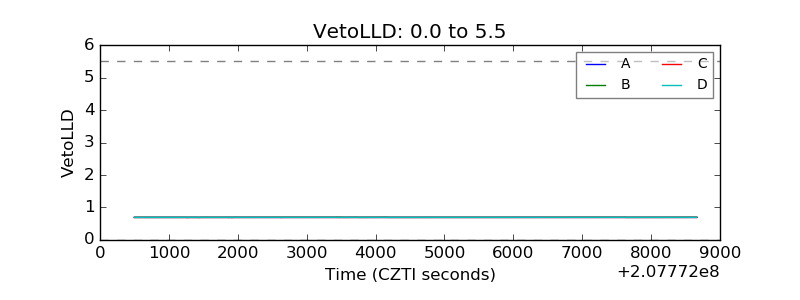 |
| Alpha Counter | 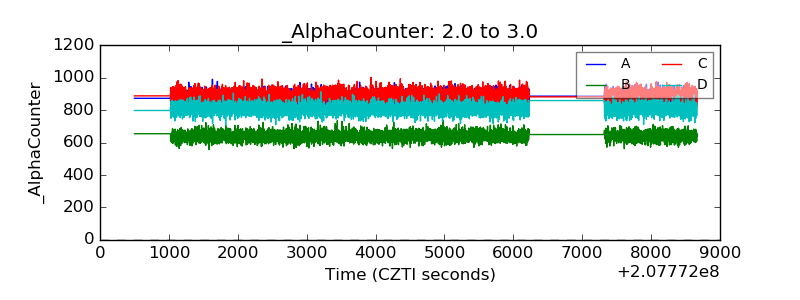 |
| _CPM_Rate | 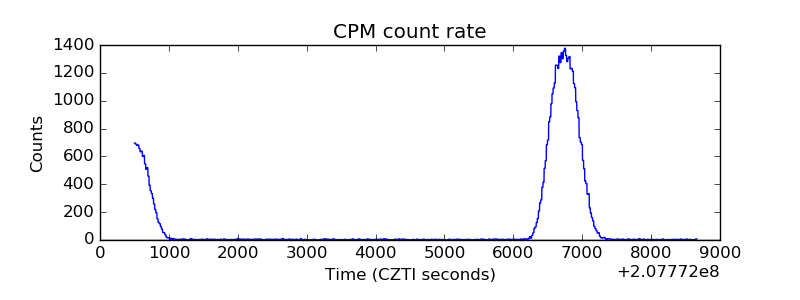 |
| CZT Counter | 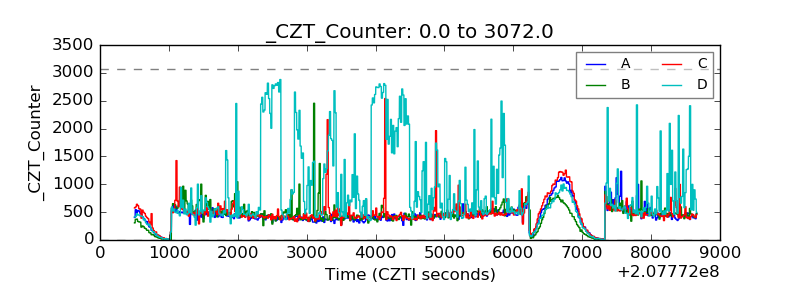 |
| +2.5 Volts monitor |  |
| +5 Volts monitor | 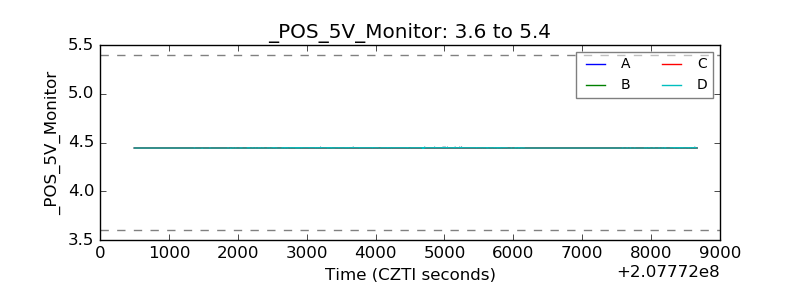 |
| _ROLL_ROT | 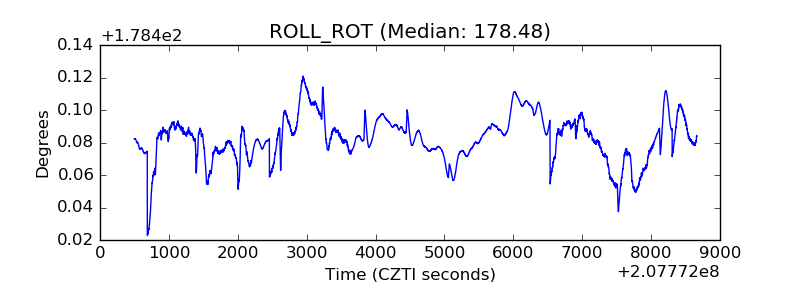 |
| _Roll_DEC | 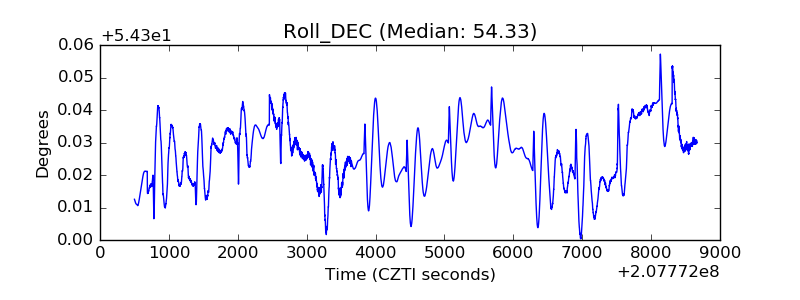 |
| _Roll_RA | 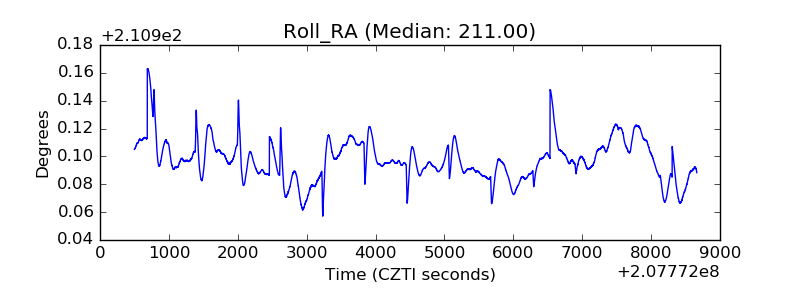 |
| Veto Counter | 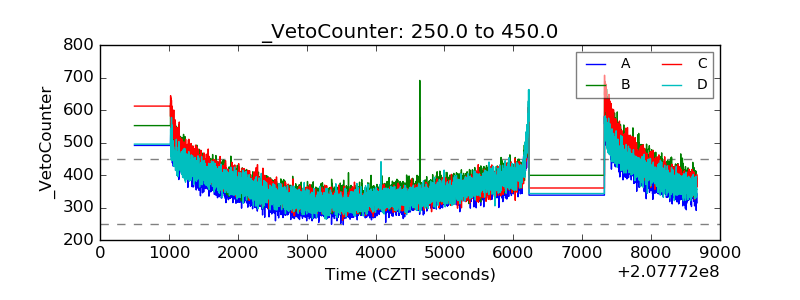 |