| Param | Original file | Final file |
|---|---|---|
| Filename | modeM0/AS1G05_233T10_9000000570_04571cztM0_level2.evt | modeM0/AS1G05_233T10_9000000570_04571cztM0_level2_quad_clean.evt |
| Size (bytes) | 477,676,800 | 77,541,120 |
| Size | 455.5 MB | 73.9 MB |
| Events in quadrant A | 2,918,792 | 486,428 |
| Events in quadrant B | 3,367,833 | 485,235 |
| Events in quadrant C | 2,934,924 | 482,496 |
| Events in quadrant D | 4,813,839 | 450,765 |
| Mode M9 | |||
|---|---|---|---|
| Quadrant | BADHDUFLAG | Total packets | Discarded packets |
| A | 0 | 23 | 0 |
| B | 0 | 23 | 0 |
| C | 0 | 23 | 0 |
| D | 0 | 23 | 0 |
| Mode M0 | |||
|---|---|---|---|
| Quadrant | BADHDUFLAG | Total packets | Discarded packets |
| A | 0 | 13189 | 3 |
| B | 0 | 14319 | 2 |
| C | 0 | 13208 | 2 |
| D | 0 | 18574 | 2 |
| Mode SS | |||
|---|---|---|---|
| Quadrant | BADHDUFLAG | Total packets | Discarded packets |
| A | 0 | 130 | 0 |
| B | 0 | 130 | 0 |
| C | 0 | 130 | 0 |
| D | 0 | 130 | 0 |
| Quadrant | Total seconds | Saturated seconds | Saturation percentage |
|---|---|---|---|
| A | 6352 | 9 | 0.141688% |
| B | 6352 | 75 | 1.180730% |
| C | 6352 | 9 | 0.141688% |
| D | 6352 | 404 | 6.360202% |
Noise dominated data is calculated using 1-second bins in cleaned event files. If a bin has >2000 counts, and if more than 50% of those come from <1% of pixels, then it is considered to be noise-dominated and hence unusable.
| Quadrant | # 1 sec bins | Bins with >0 counts | Bins with >2000 counts | High rate bins dominated by noise | Noise dominated (total time) | Noise dominated (detector-on time) | Marked lightcurve |
|---|---|---|---|---|---|---|---|
| A | 8668 | 6354 | 0 | 0 | 0.00% | 0.00% | 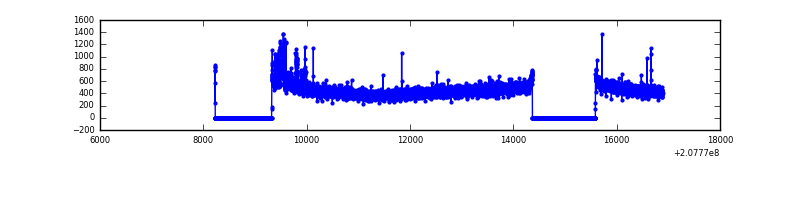 |
| B | 8668 | 6354 | 40 | 40 | 0.46% | 0.63% | 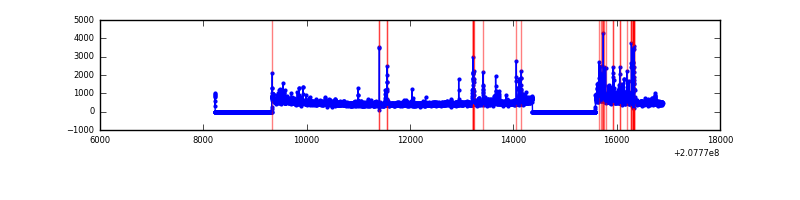 |
| C | 8668 | 6354 | 2 | 2 | 0.02% | 0.03% | 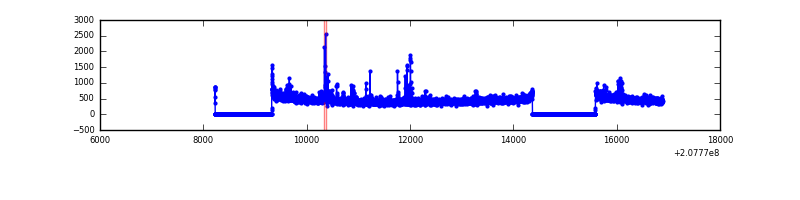 |
| D | 8668 | 6354 | 374 | 374 | 4.31% | 5.89% | 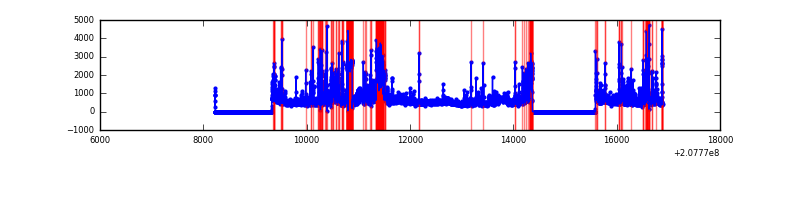 |
Top three noisy pixels from each quadrant. If the there are fewer than three noisy pixels in the level2.evt file, extra rows are filled as -1
| Pixel properties | Quadrant properties | ||||||
|---|---|---|---|---|---|---|---|
| Quadrant | DetID | PixID | Counts | Sigma | Mean | Median | Sigma |
| A | 0 | 50 | 82522 | 548.95 | 730 | 712 | 149.0 |
| A | 8 | 15 | 19227 | 124.24 | 730 | 712 | 149.0 |
| A | 12 | 194 | 7579 | 46.08 | 730 | 712 | 149.0 |
| B | 10 | 16 | 293215 | 2086.67 | 740 | 723 | 140.2 |
| B | 14 | 167 | 90703 | 641.93 | 740 | 723 | 140.2 |
| B | 15 | 54 | 24917 | 172.6 | 740 | 723 | 140.2 |
| C | 14 | 48 | 98253 | 581.57 | 719 | 721 | 167.7 |
| C | 5 | 250 | 14539 | 82.4 | 719 | 721 | 167.7 |
| C | 13 | 61 | 5780 | 30.17 | 719 | 721 | 167.7 |
| D | 13 | 235 | 1557911 | 9335.47 | 686 | 667 | 166.8 |
| D | 2 | 136 | 176619 | 1054.81 | 686 | 667 | 166.8 |
| D | 9 | 35 | 124787 | 744.08 | 686 | 667 | 166.8 |
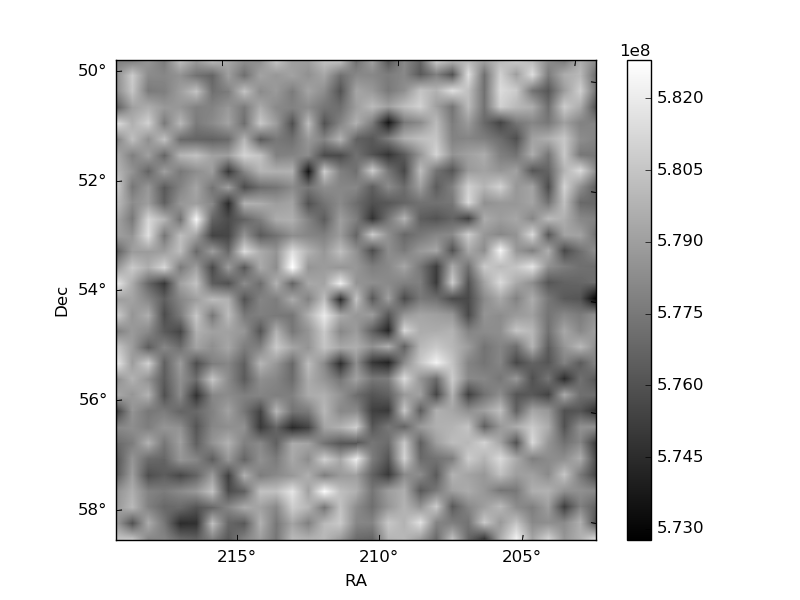
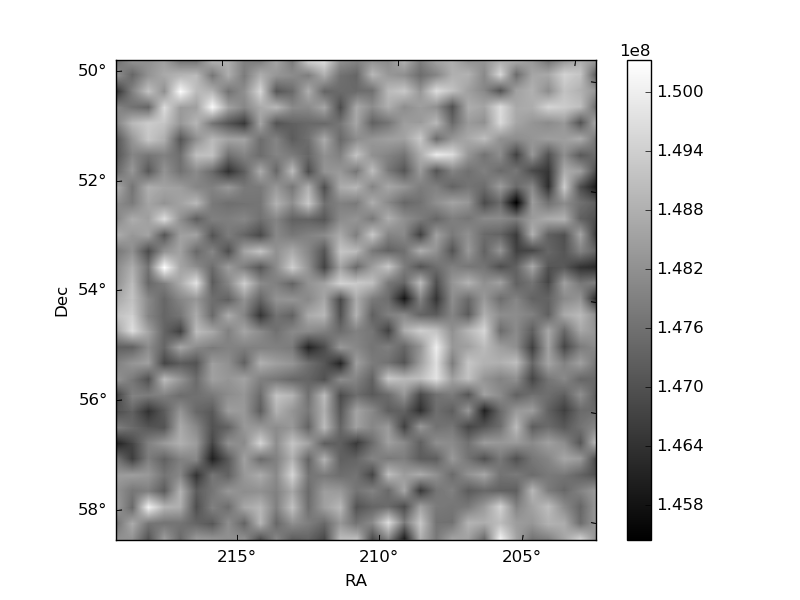
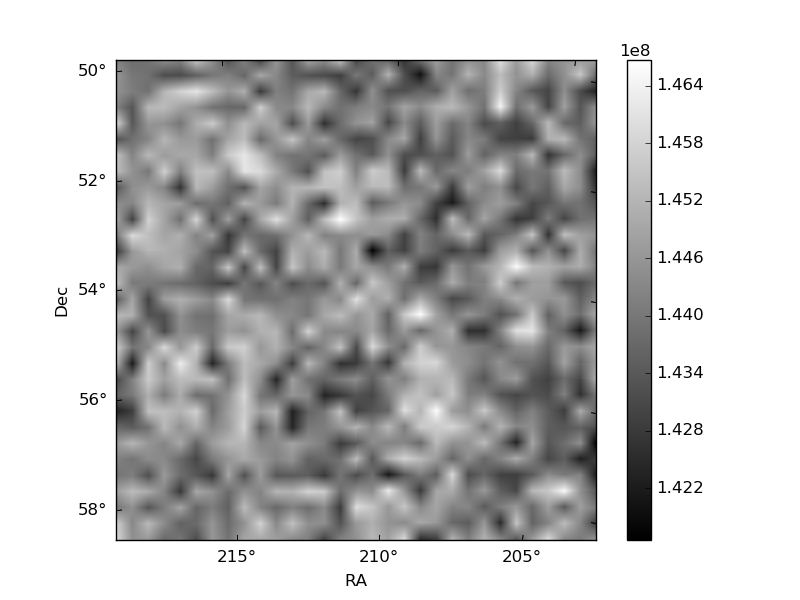
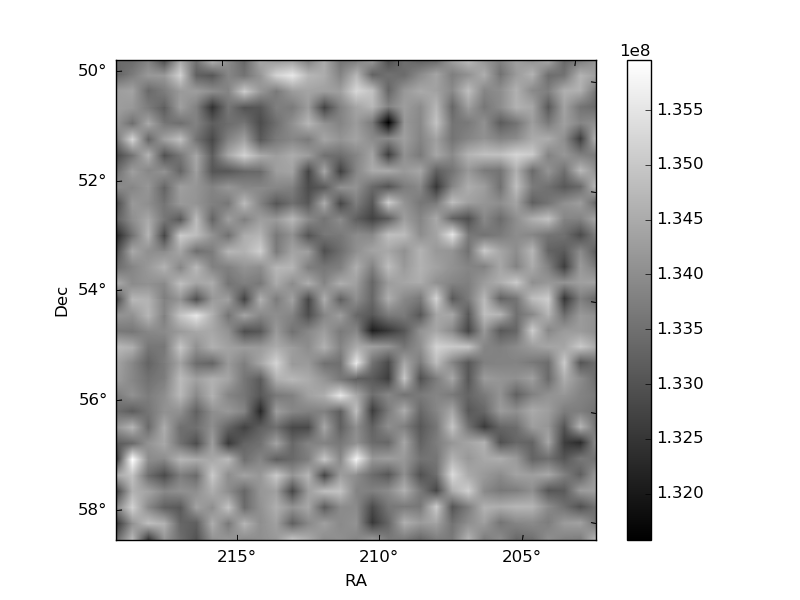
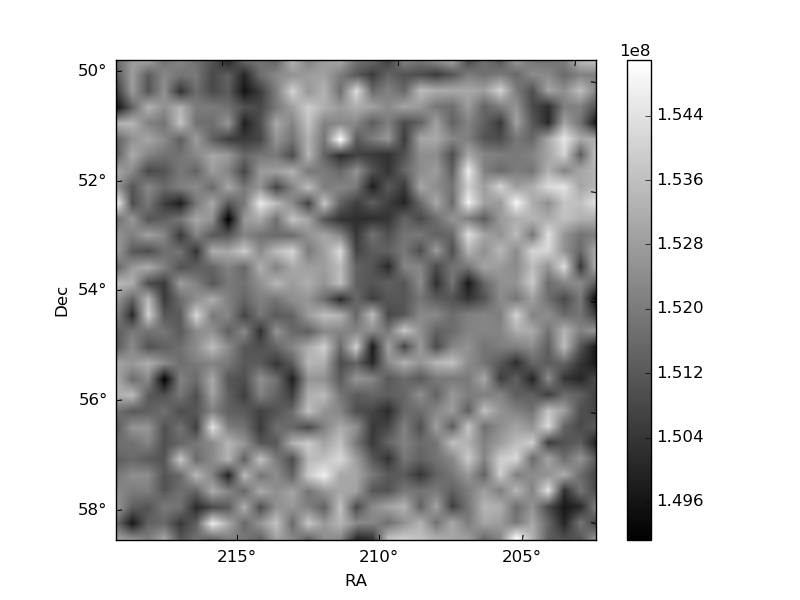
Histogram calculated using DETX and DETY for each event in the final _common_clean file
| Quadrant A | 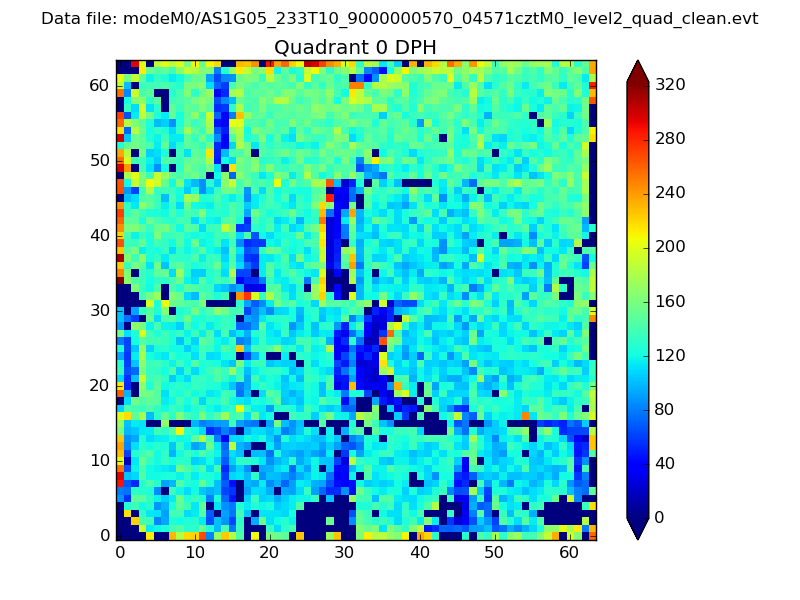 |
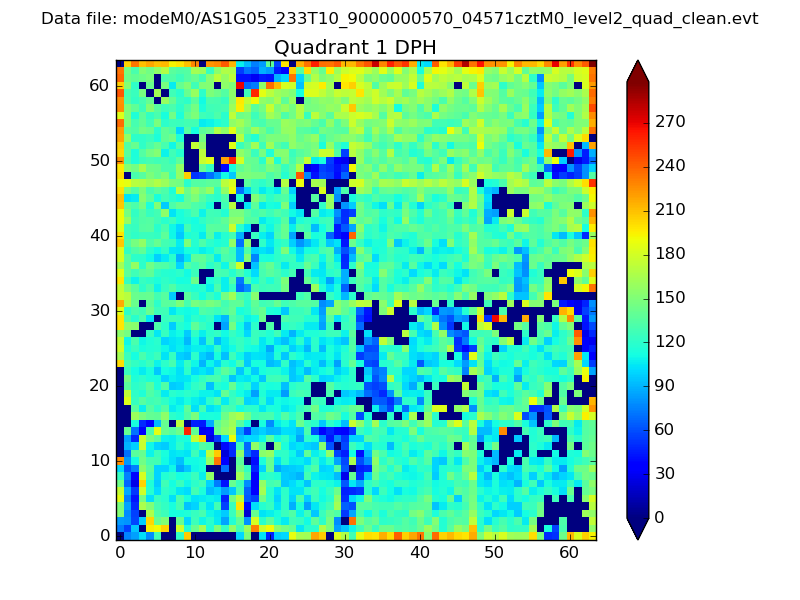 |
Quadrant B |
|---|---|---|---|
| Quadrant D | 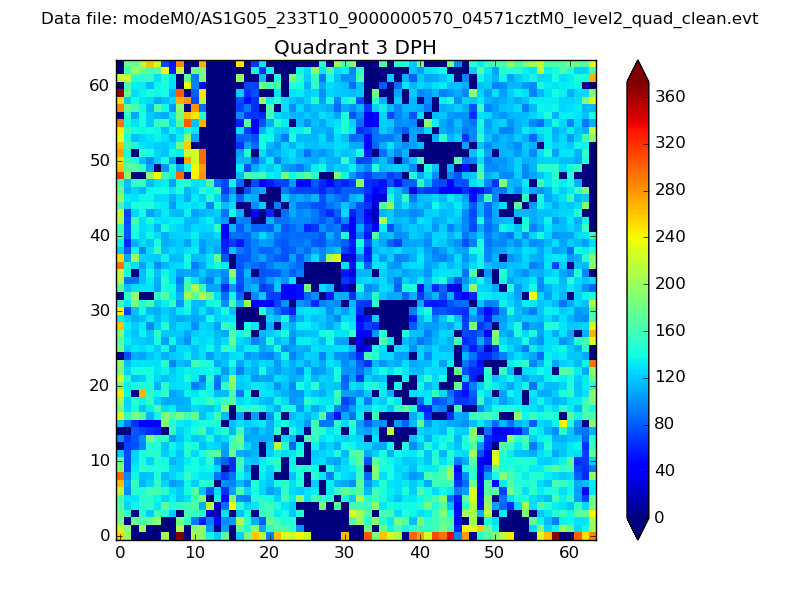 |
 |
Quadrant C |
| Plot type | Count rate plots | Images |
|---|---|---|
| Comparison with Poisson distribution Blue bars denote a histogram of data divided into 1 sec bins. Red curve is a Poisson curve with rate = median count rate of data. |
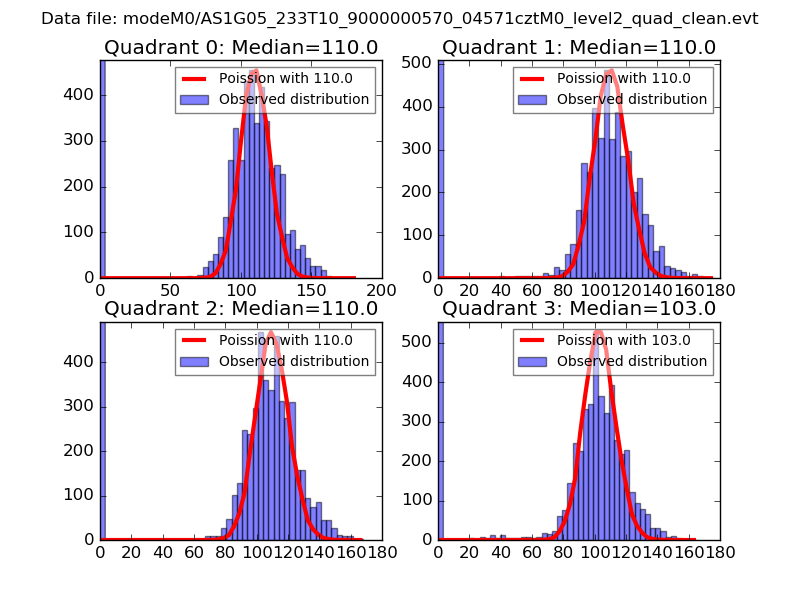 |
 |
| Quadrant-wise count rates Data is divided into 100 sec bins |
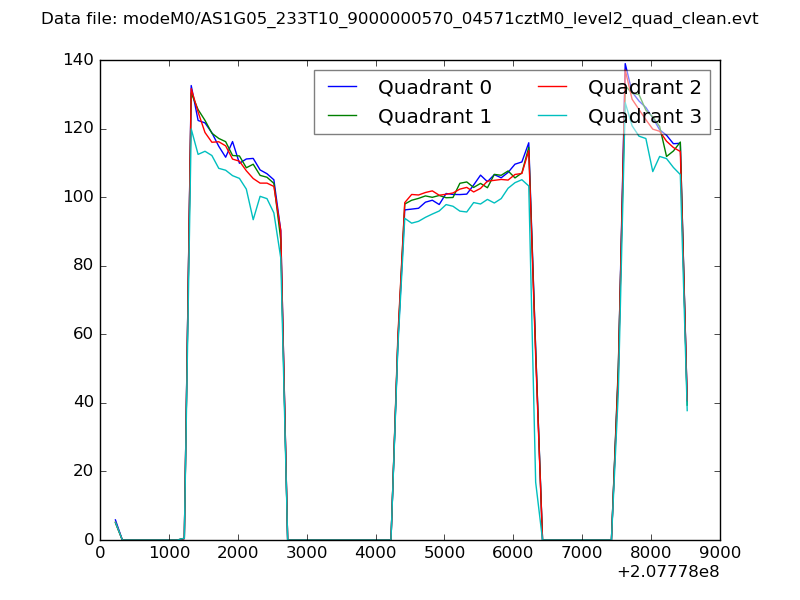 |
|
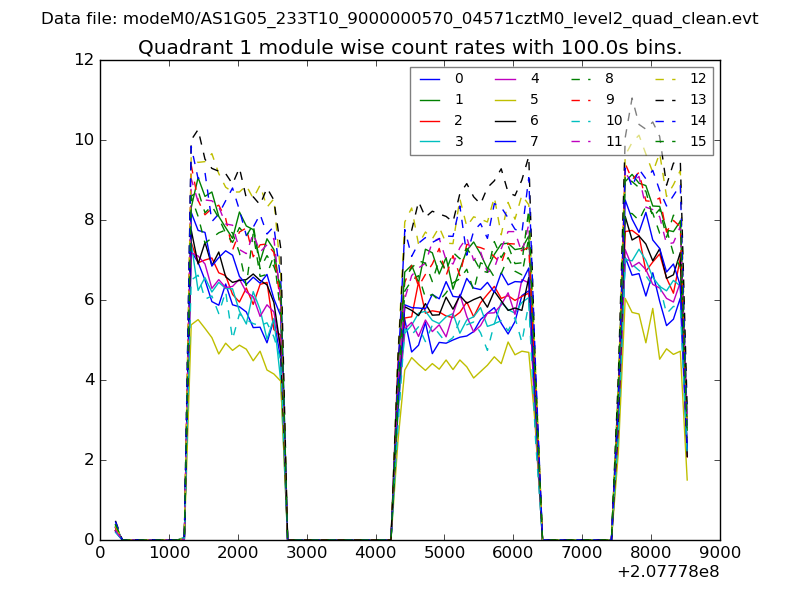
| Module-wise count rates for Quadrant A Data is divided into 100 sec bins |
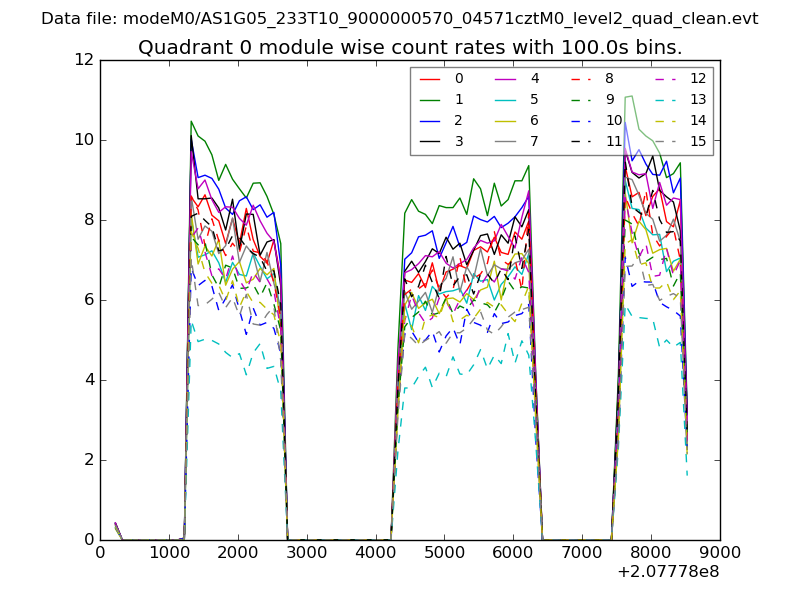 |
 |
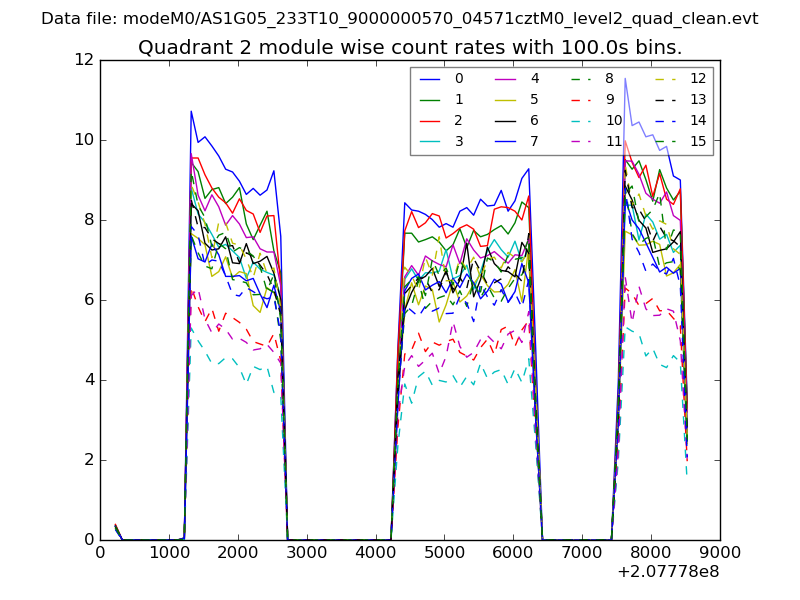
| Module-wise count rates for Quadrant B Data is divided into 100 sec bins |
 |
 |
| Module-wise count rates for Quadrant C Data is divided into 100 sec bins |
 |
 |
| Module-wise count rates for Quadrant D Data is divided into 100 sec bins |
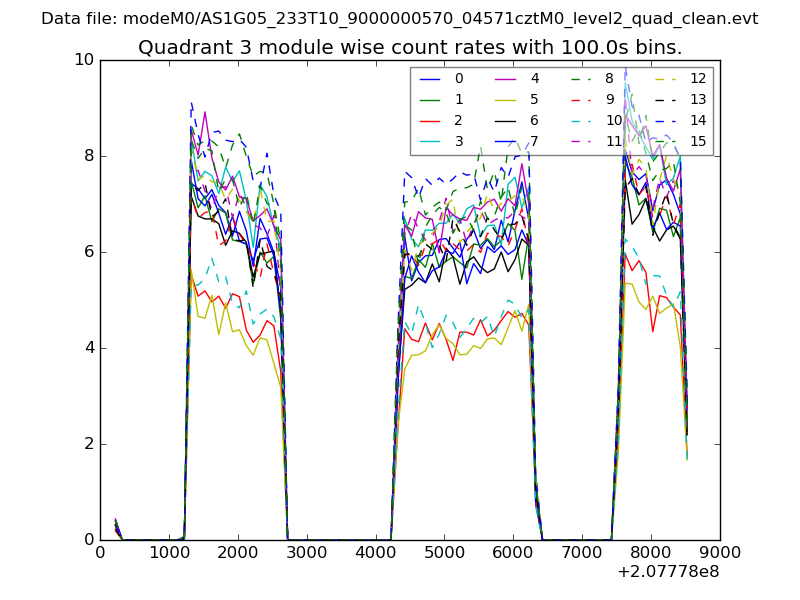 |
 |
| Parameter | Plot |
|---|---|
| CZT HV Monitor | 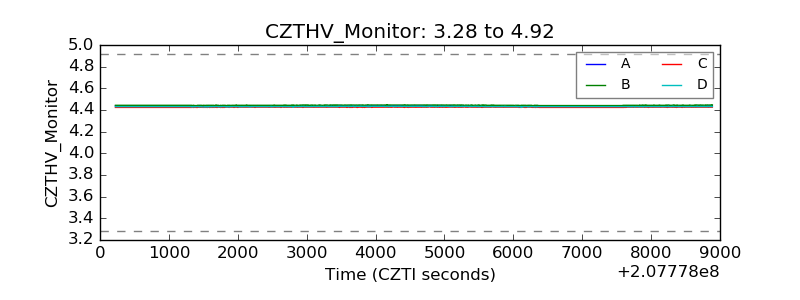 |
| D_VDD | 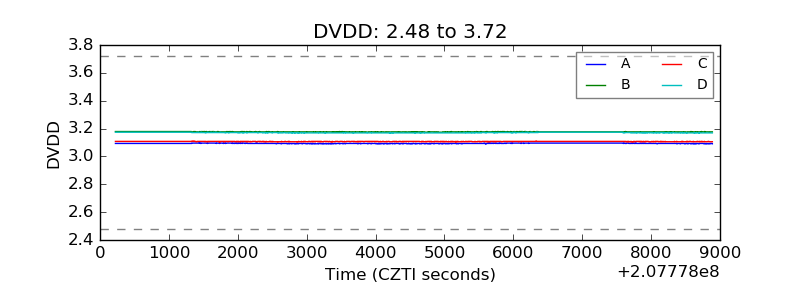 |
| Temperature 1 | 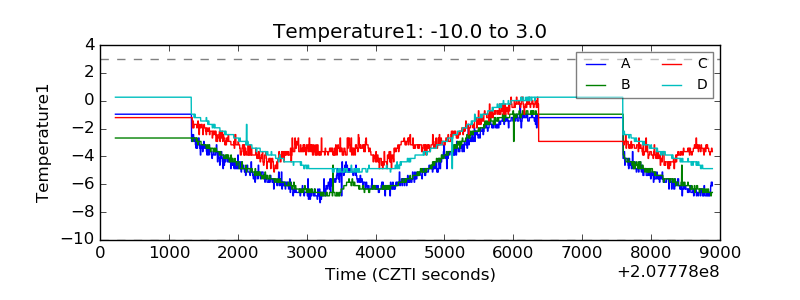 |
| Veto HV Monitor | 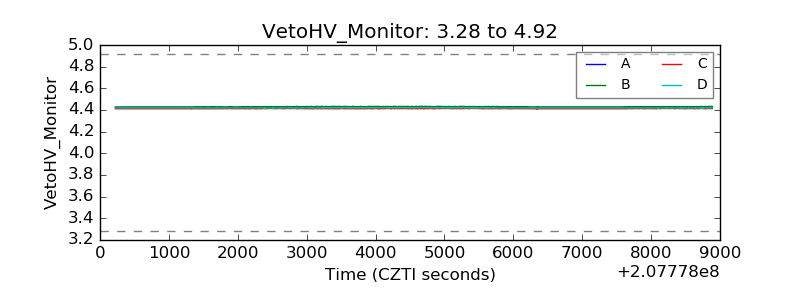 |
| Veto LLD | 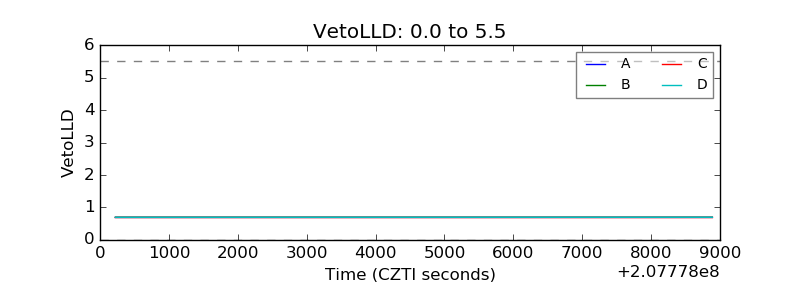 |
| Alpha Counter | 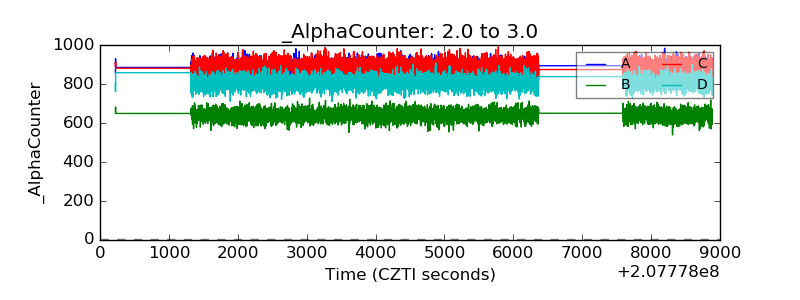 |
| _CPM_Rate | 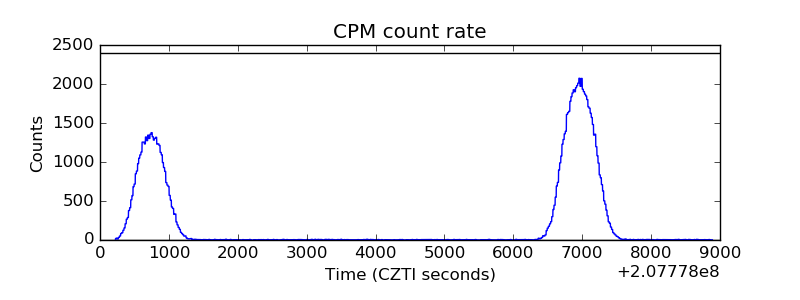 |
| CZT Counter | 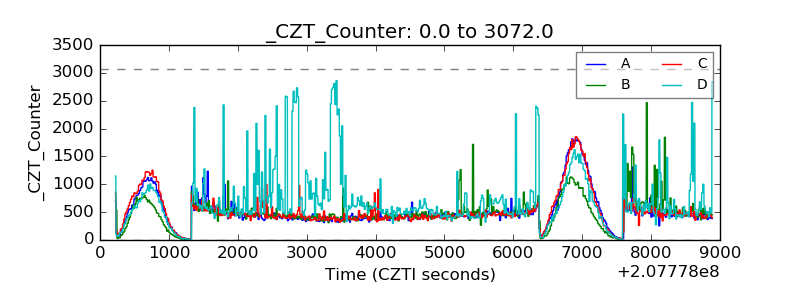 |
| +2.5 Volts monitor |  |
| +5 Volts monitor |  |
| _ROLL_ROT | 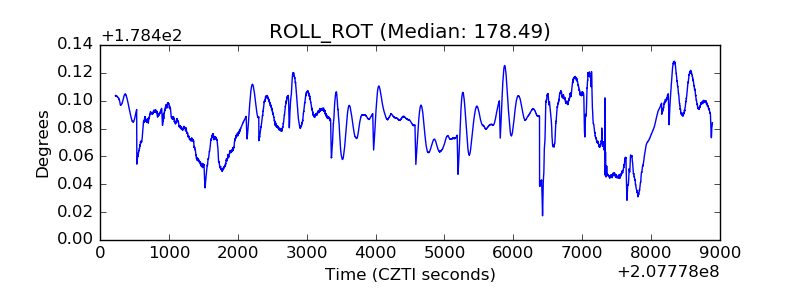 |
| _Roll_DEC | 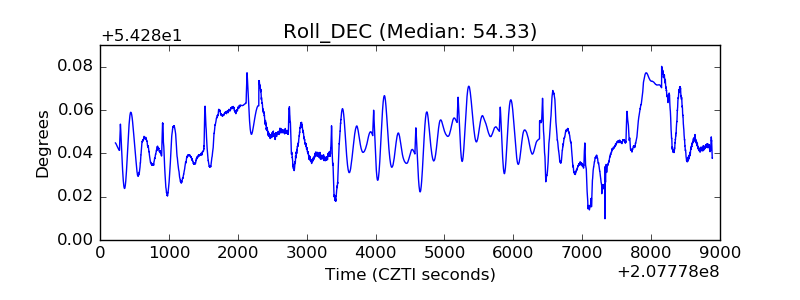 |
| _Roll_RA | 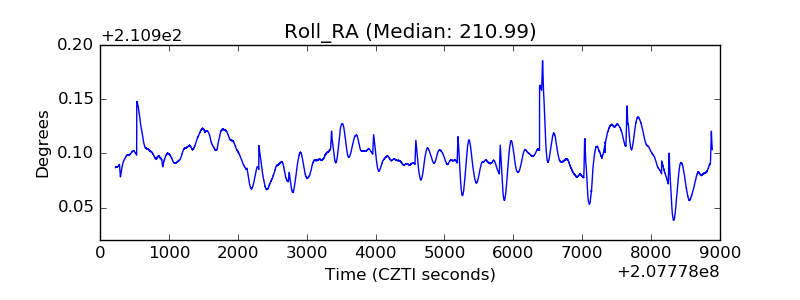 |
| Veto Counter | 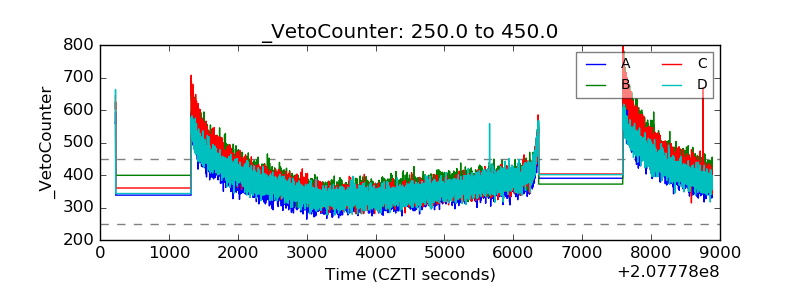 |