| Param | Original file | Final file |
|---|---|---|
| Filename | modeM0/AS1G05_233T10_9000000570_04572cztM0_level2.evt | modeM0/AS1G05_233T10_9000000570_04572cztM0_level2_quad_clean.evt |
| Size (bytes) | 547,652,160 | 71,873,280 |
| Size | 522.3 MB | 68.5 MB |
| Events in quadrant A | 2,982,844 | 445,601 |
| Events in quadrant B | 3,786,254 | 442,859 |
| Events in quadrant C | 3,035,224 | 440,751 |
| Events in quadrant D | 6,337,562 | 390,973 |
| Mode M9 | |||
|---|---|---|---|
| Quadrant | BADHDUFLAG | Total packets | Discarded packets |
| A | 0 | 16 | 0 |
| B | 0 | 16 | 0 |
| C | 0 | 16 | 0 |
| D | 0 | 17 | 0 |
| Mode M0 | |||
|---|---|---|---|
| Quadrant | BADHDUFLAG | Total packets | Discarded packets |
| A | 0 | 13351 | 3 |
| B | 0 | 15631 | 2 |
| C | 0 | 13508 | 2 |
| D | 0 | 23384 | 2 |
| Mode SS | |||
|---|---|---|---|
| Quadrant | BADHDUFLAG | Total packets | Discarded packets |
| A | 0 | 134 | 0 |
| B | 0 | 134 | 0 |
| C | 0 | 134 | 0 |
| D | 0 | 134 | 0 |
| Quadrant | Total seconds | Saturated seconds | Saturation percentage |
|---|---|---|---|
| A | 6532 | 15 | 0.229639% |
| B | 6532 | 116 | 1.775873% |
| C | 6532 | 18 | 0.275566% |
| D | 6532 | 1280 | 19.595836% |
Noise dominated data is calculated using 1-second bins in cleaned event files. If a bin has >2000 counts, and if more than 50% of those come from <1% of pixels, then it is considered to be noise-dominated and hence unusable.
| Quadrant | # 1 sec bins | Bins with >0 counts | Bins with >2000 counts | High rate bins dominated by noise | Noise dominated (total time) | Noise dominated (detector-on time) | Marked lightcurve |
|---|---|---|---|---|---|---|---|
| A | 7827 | 6533 | 0 | 0 | 0.00% | 0.00% | 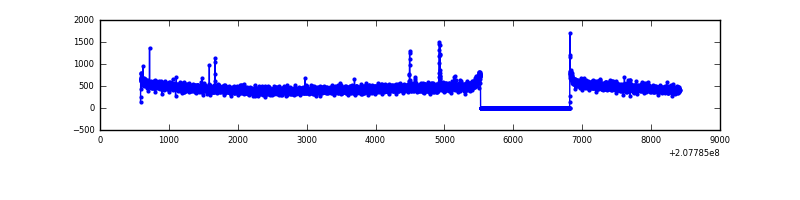 |
| B | 7827 | 6533 | 62 | 62 | 0.79% | 0.95% | 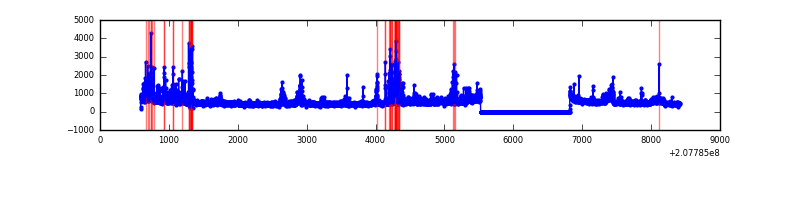 |
| C | 7827 | 6533 | 7 | 7 | 0.09% | 0.11% | 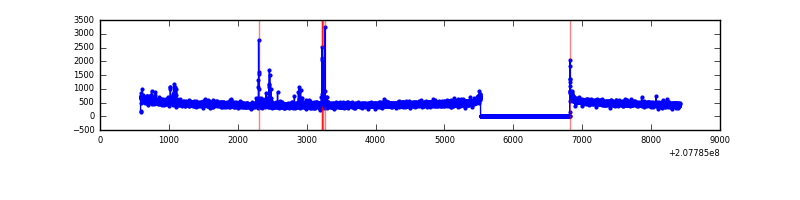 |
| D | 7827 | 6533 | 1240 | 1240 | 15.84% | 18.98% | 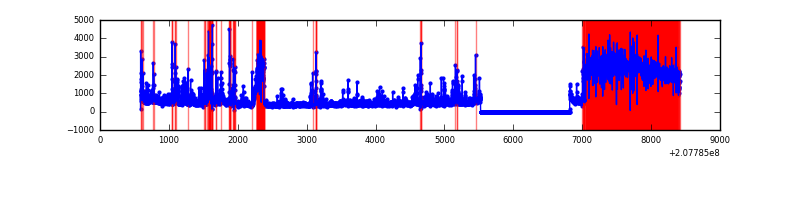 |
Top three noisy pixels from each quadrant. If the there are fewer than three noisy pixels in the level2.evt file, extra rows are filled as -1
| Pixel properties | Quadrant properties | ||||||
|---|---|---|---|---|---|---|---|
| Quadrant | DetID | PixID | Counts | Sigma | Mean | Median | Sigma |
| A | 0 | 50 | 13486 | 81.48 | 767 | 749 | 156.3 |
| A | 15 | 174 | 8195 | 47.63 | 767 | 749 | 156.3 |
| A | 12 | 194 | 7752 | 44.8 | 767 | 749 | 156.3 |
| B | 14 | 167 | 314396 | 2148.04 | 778 | 761 | 146.0 |
| B | 10 | 16 | 212618 | 1450.98 | 778 | 761 | 146.0 |
| B | 15 | 204 | 70028 | 474.4 | 778 | 761 | 146.0 |
| C | 14 | 48 | 56752 | 321.96 | 751 | 757 | 173.9 |
| C | 9 | 247 | 25255 | 140.86 | 751 | 757 | 173.9 |
| C | 1 | 3 | 7744 | 40.17 | 751 | 757 | 173.9 |
| D | 13 | 235 | 3255495 | 20102.56 | 672 | 653 | 161.9 |
| D | 2 | 136 | 135957 | 835.66 | 672 | 653 | 161.9 |
| D | 2 | 63 | 102235 | 627.39 | 672 | 653 | 161.9 |
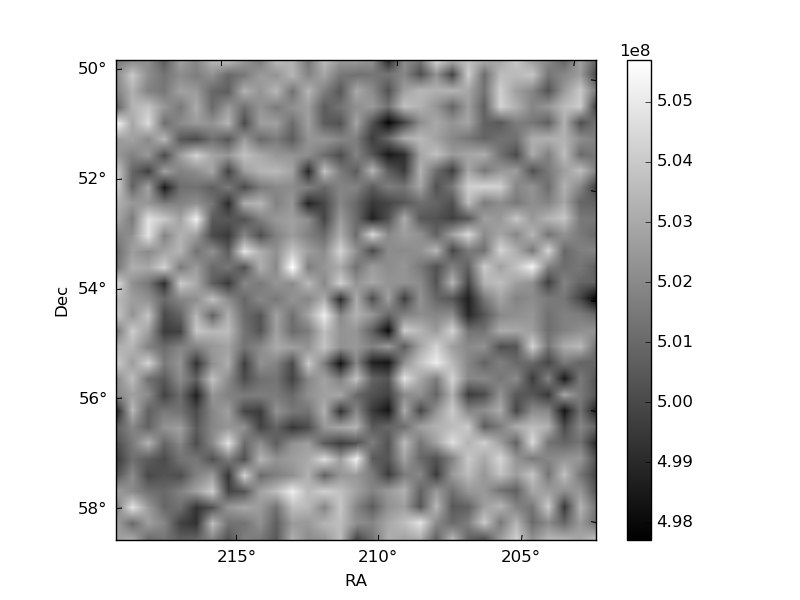
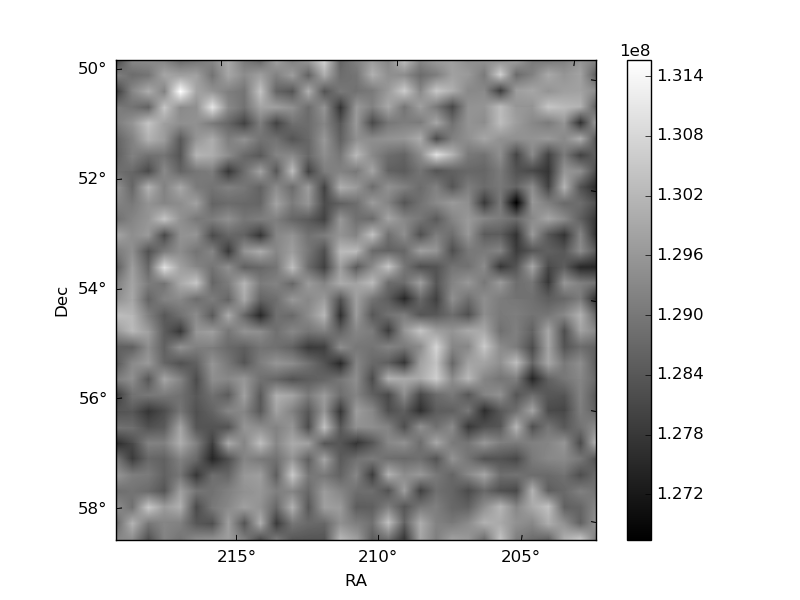
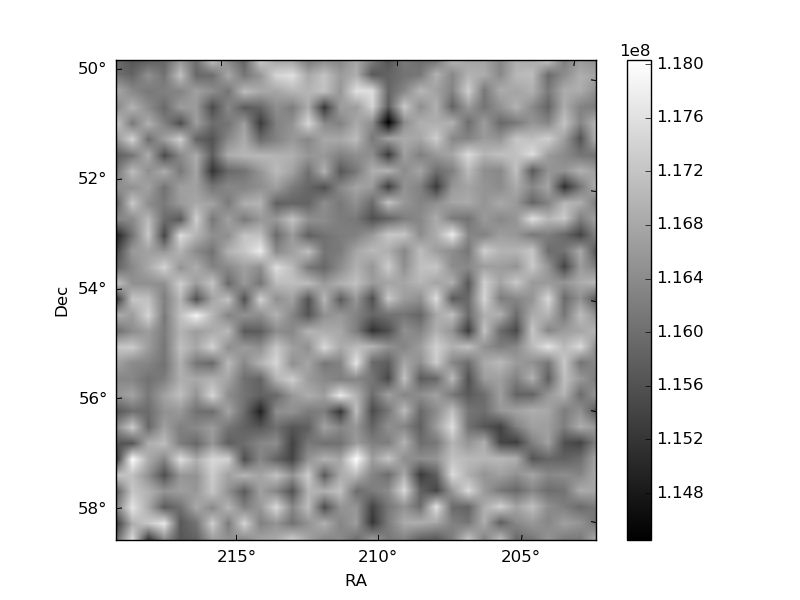
Histogram calculated using DETX and DETY for each event in the final _common_clean file
| Quadrant A | 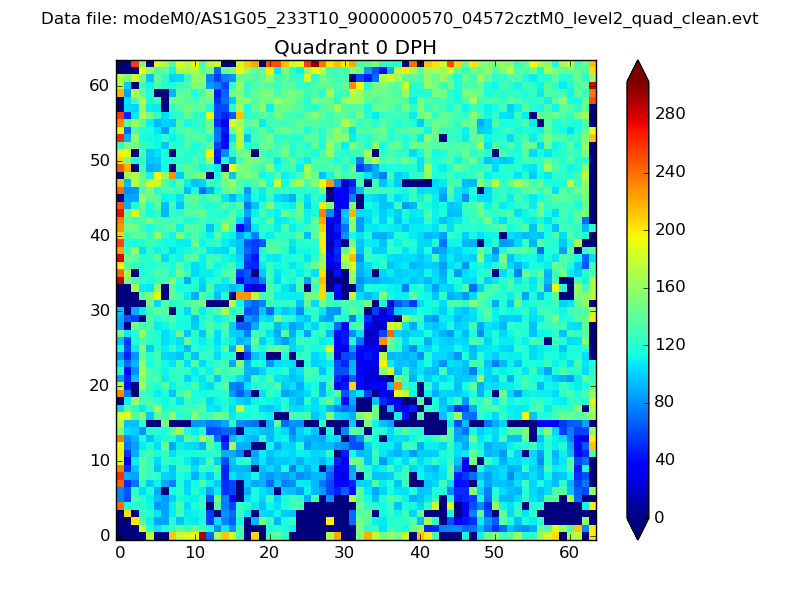 |
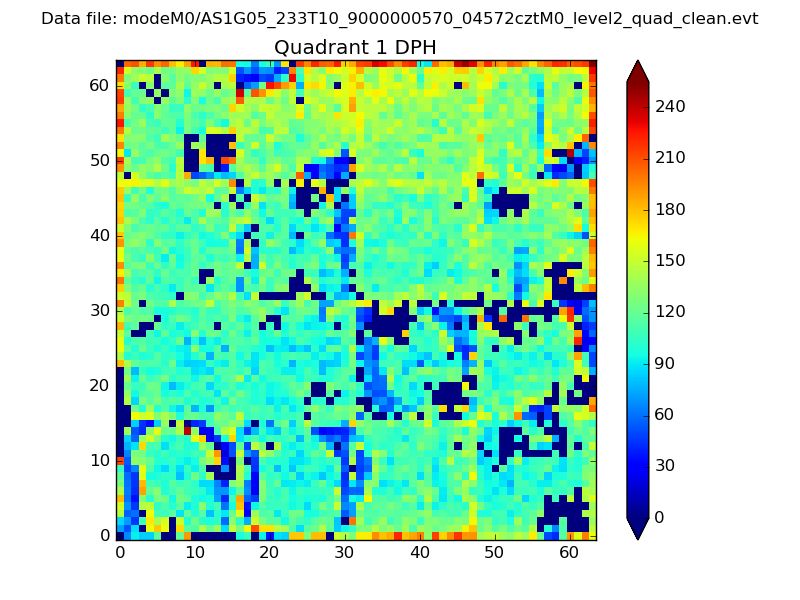 |
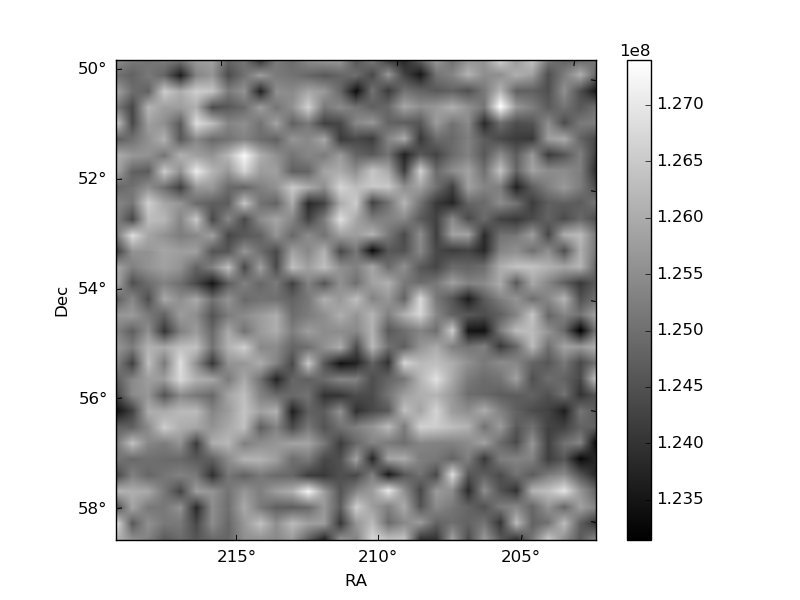
Quadrant B |
|---|---|---|---|
| Quadrant D | 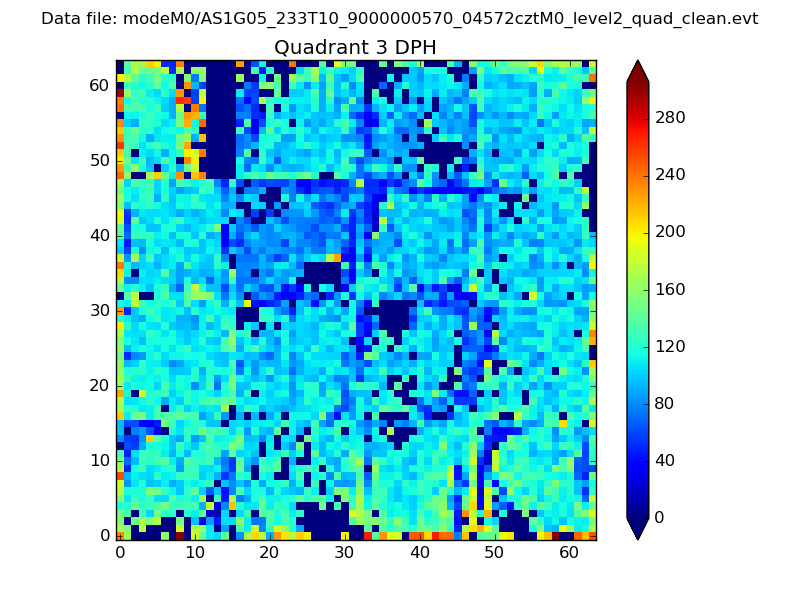 |
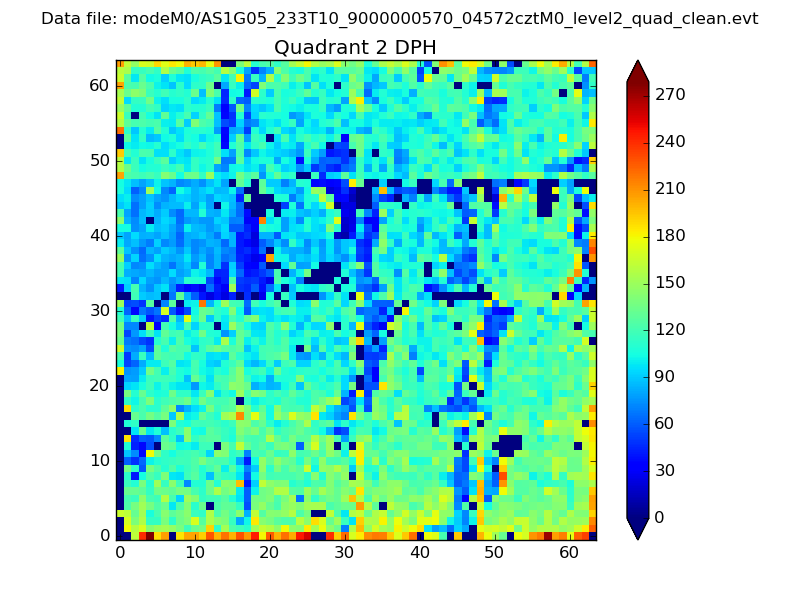 |
Quadrant C |
| Plot type | Count rate plots | Images |
|---|---|---|
| Comparison with Poisson distribution Blue bars denote a histogram of data divided into 1 sec bins. Red curve is a Poisson curve with rate = median count rate of data. |
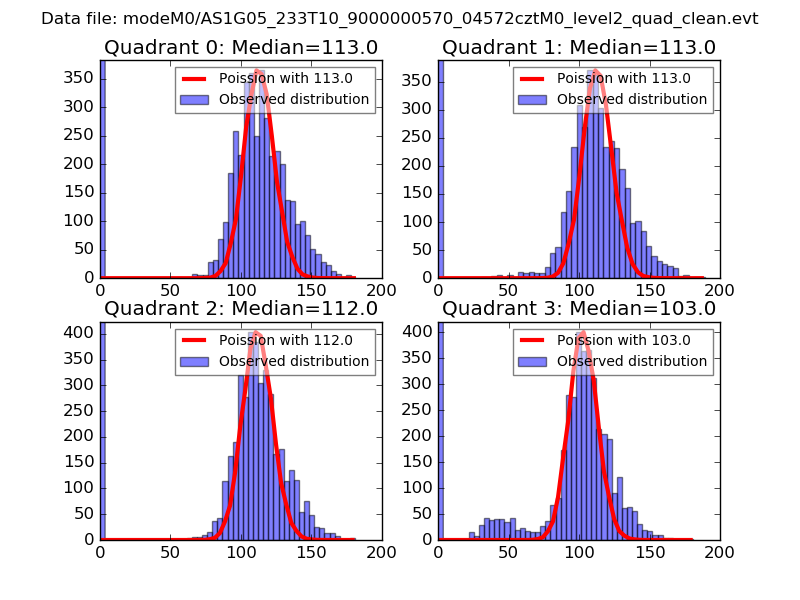 |
 |
| Quadrant-wise count rates Data is divided into 100 sec bins |
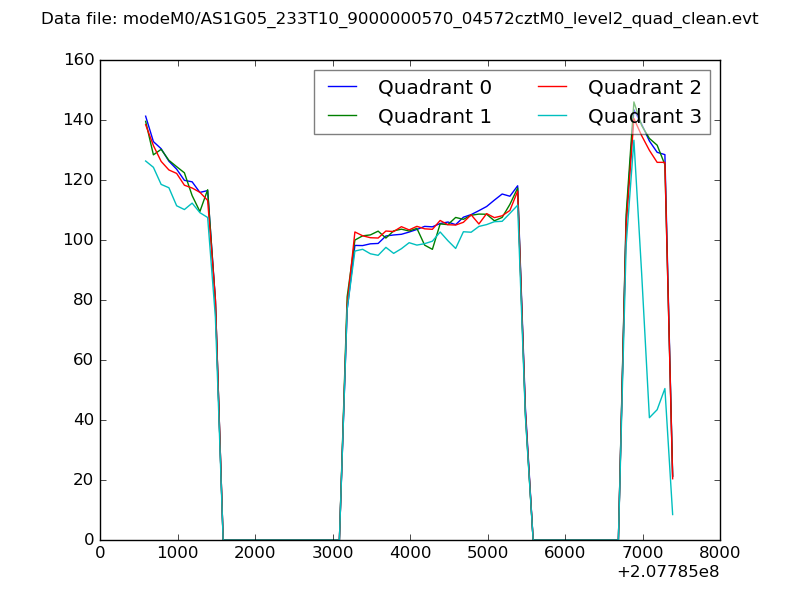 |
|
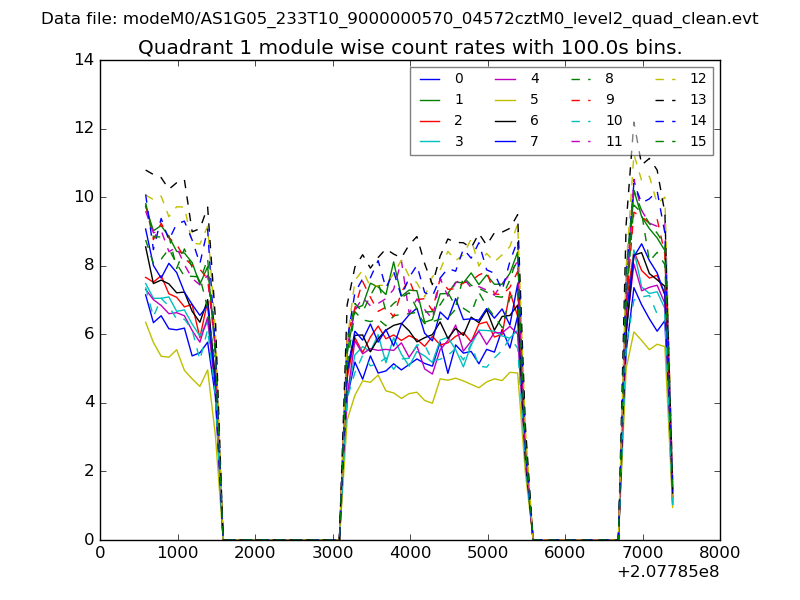
| Module-wise count rates for Quadrant A Data is divided into 100 sec bins |
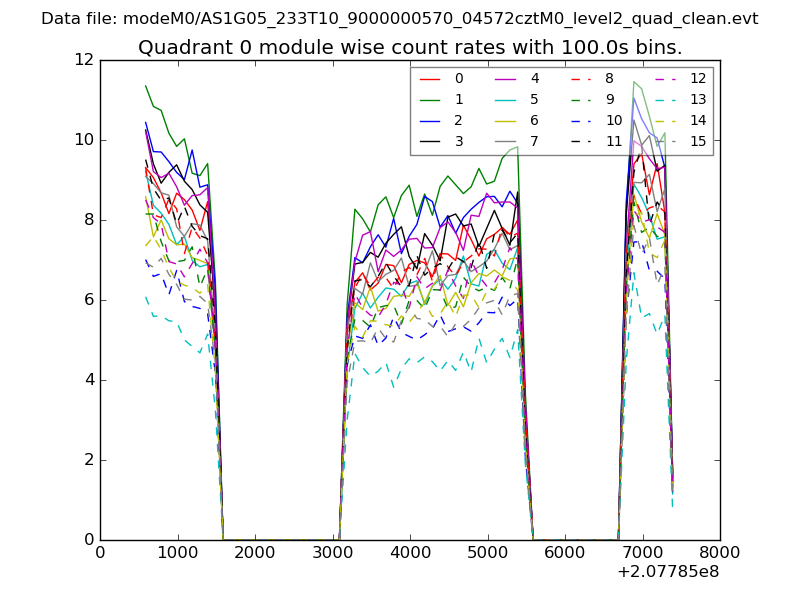 |
 |
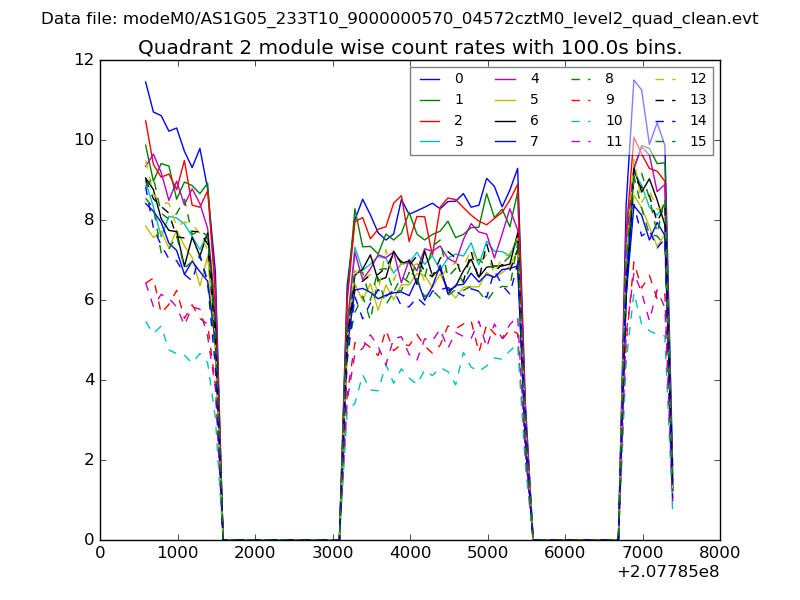
| Module-wise count rates for Quadrant B Data is divided into 100 sec bins |
 |
 |
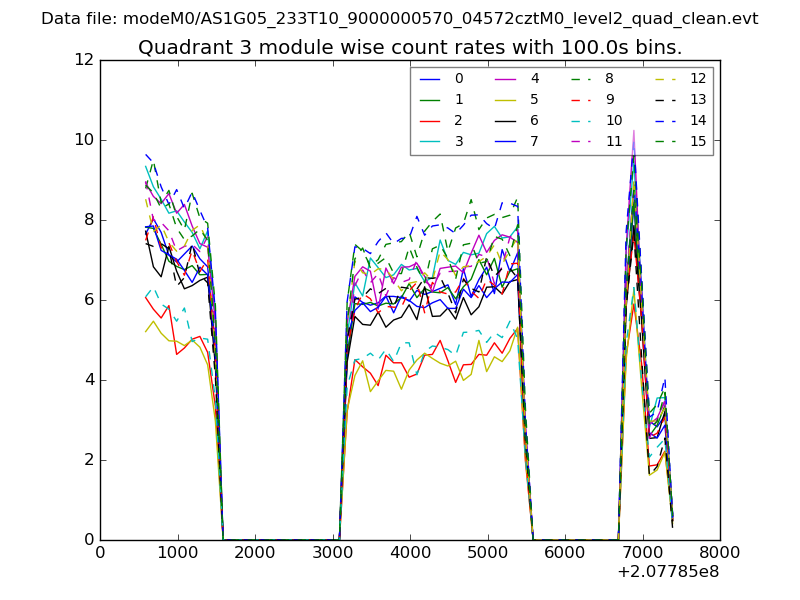
| Module-wise count rates for Quadrant C Data is divided into 100 sec bins |
 |
 |
| Module-wise count rates for Quadrant D Data is divided into 100 sec bins |
 |
 |
| Parameter | Plot |
|---|---|
| CZT HV Monitor | 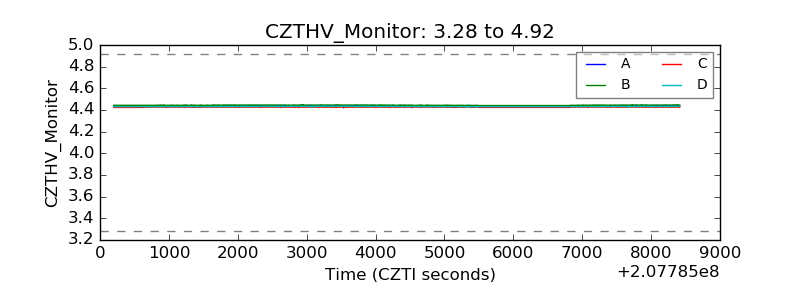 |
| D_VDD | 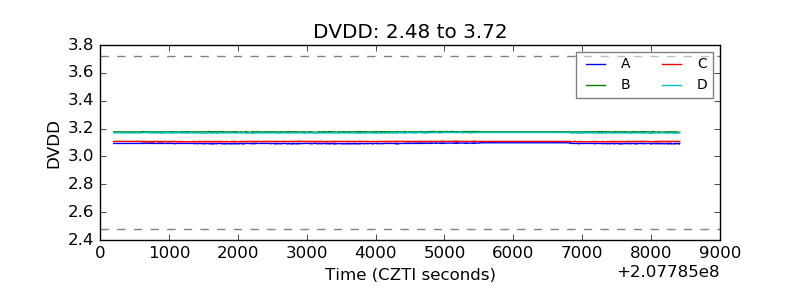 |
| Temperature 1 | 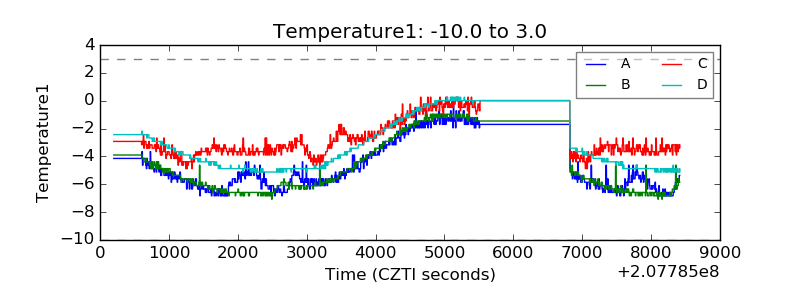 |
| Veto HV Monitor | 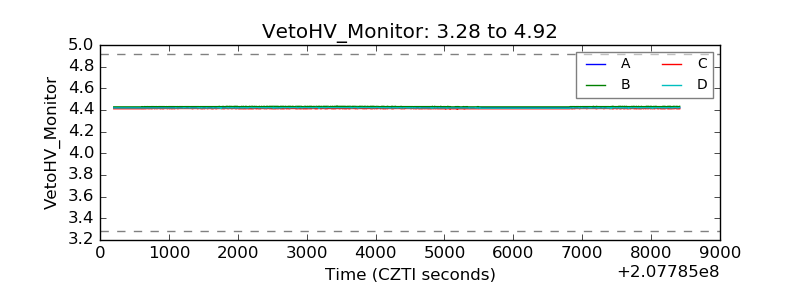 |
| Veto LLD | 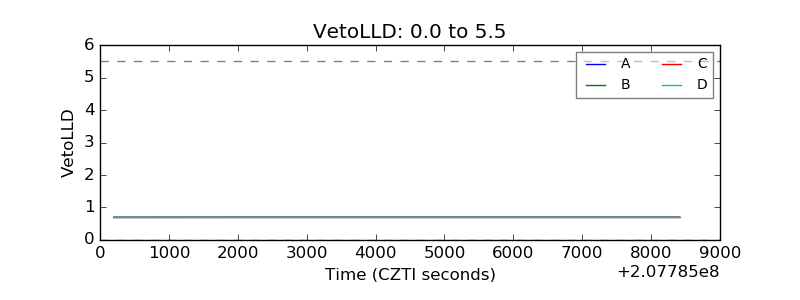 |
| Alpha Counter | 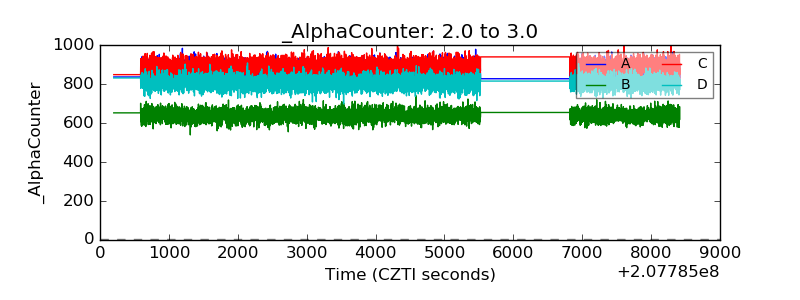 |
| _CPM_Rate | 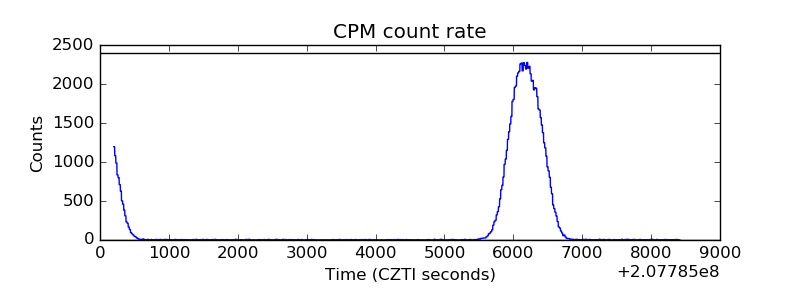 |
| CZT Counter |  |
| +2.5 Volts monitor |  |
| +5 Volts monitor |  |
| _ROLL_ROT | 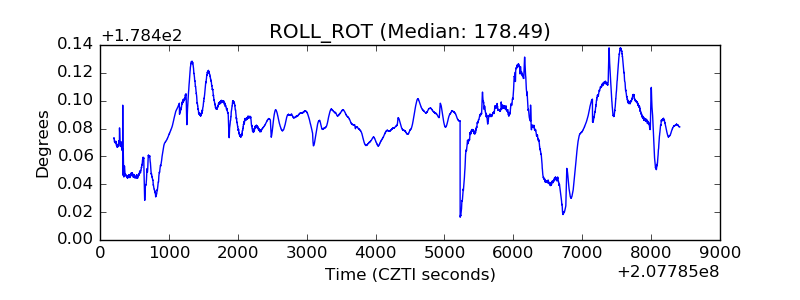 |
| _Roll_DEC | 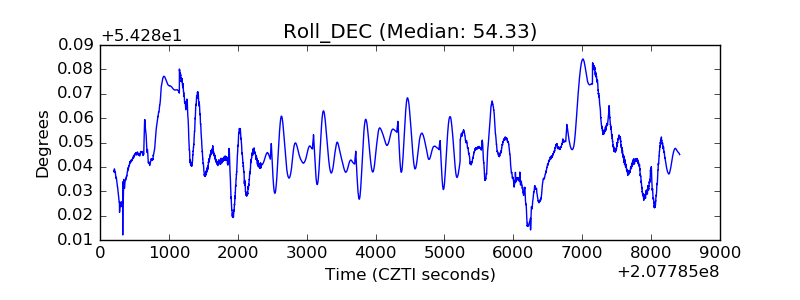 |
| _Roll_RA | 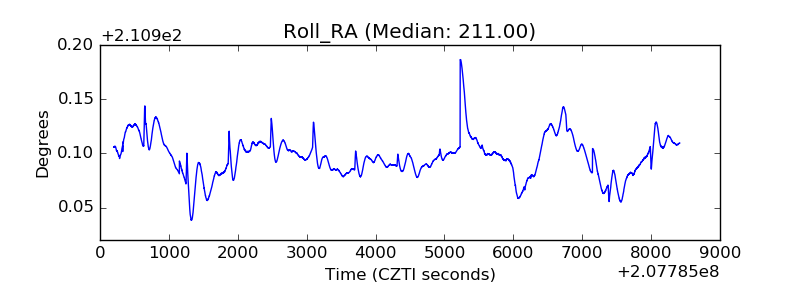 |
| Veto Counter | 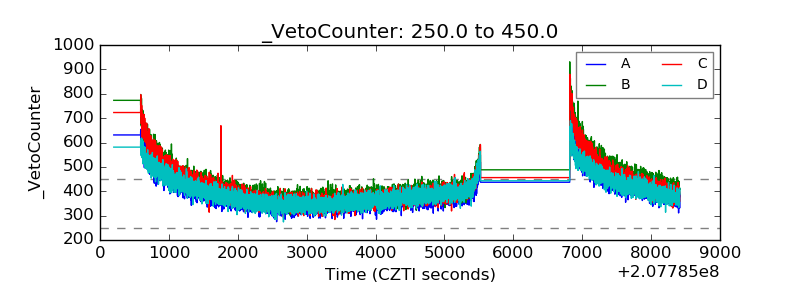 |