| Param | Original file | Final file |
|---|---|---|
| Filename | modeM0/AS1G05_233T10_9000000570_04573cztM0_level2.evt | modeM0/AS1G05_233T10_9000000570_04573cztM0_level2_quad_clean.evt |
| Size (bytes) | 541,448,640 | 65,390,400 |
| Size | 516.4 MB | 62.4 MB |
| Events in quadrant A | 3,128,846 | 397,038 |
| Events in quadrant B | 3,542,566 | 397,678 |
| Events in quadrant C | 2,972,373 | 393,434 |
| Events in quadrant D | 6,318,476 | 343,786 |
| Mode M9 | |||
|---|---|---|---|
| Quadrant | BADHDUFLAG | Total packets | Discarded packets |
| A | 0 | 19 | 0 |
| B | 0 | 19 | 0 |
| C | 0 | 19 | 0 |
| D | 0 | 20 | 0 |
| Mode M0 | |||
|---|---|---|---|
| Quadrant | BADHDUFLAG | Total packets | Discarded packets |
| A | 0 | 13540 | 3 |
| B | 0 | 14739 | 2 |
| C | 0 | 13184 | 2 |
| D | 0 | 23233 | 2 |
| Mode SS | |||
|---|---|---|---|
| Quadrant | BADHDUFLAG | Total packets | Discarded packets |
| A | 0 | 130 | 0 |
| B | 0 | 130 | 0 |
| C | 0 | 130 | 0 |
| D | 0 | 130 | 0 |
| Quadrant | Total seconds | Saturated seconds | Saturation percentage |
|---|---|---|---|
| A | 6417 | 61 | 0.950600% |
| B | 6417 | 87 | 1.355774% |
| C | 6417 | 21 | 0.327256% |
| D | 6417 | 1310 | 20.414524% |
Noise dominated data is calculated using 1-second bins in cleaned event files. If a bin has >2000 counts, and if more than 50% of those come from <1% of pixels, then it is considered to be noise-dominated and hence unusable.
| Quadrant | # 1 sec bins | Bins with >0 counts | Bins with >2000 counts | High rate bins dominated by noise | Noise dominated (total time) | Noise dominated (detector-on time) | Marked lightcurve |
|---|---|---|---|---|---|---|---|
| A | 7757 | 6418 | 12 | 12 | 0.15% | 0.19% | 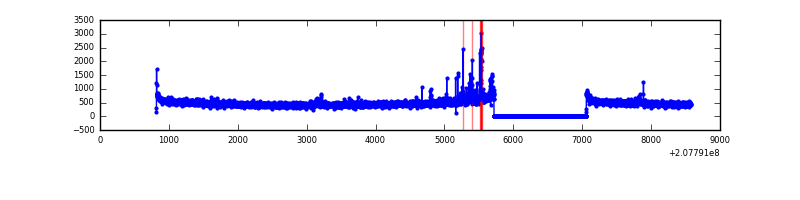 |
| B | 7757 | 6418 | 20 | 20 | 0.26% | 0.31% | 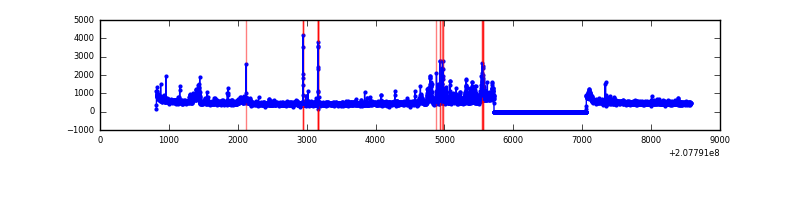 |
| C | 7757 | 6418 | 1 | 1 | 0.01% | 0.02% | 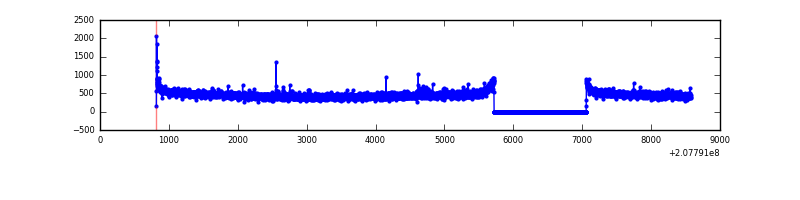 |
| D | 7757 | 6418 | 1240 | 1240 | 15.99% | 19.32% | 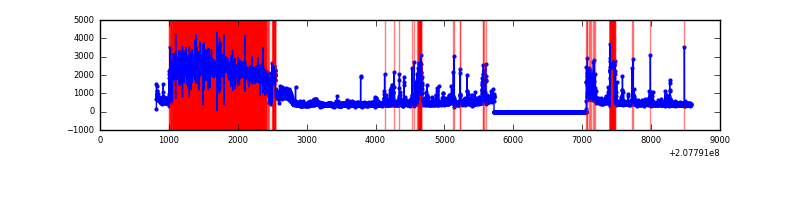 |
Top three noisy pixels from each quadrant. If the there are fewer than three noisy pixels in the level2.evt file, extra rows are filled as -1
| Pixel properties | Quadrant properties | ||||||
|---|---|---|---|---|---|---|---|
| Quadrant | DetID | PixID | Counts | Sigma | Mean | Median | Sigma |
| A | 0 | 13 | 104261 | 663.04 | 773 | 757 | 156.1 |
| A | 13 | 251 | 21514 | 132.97 | 773 | 757 | 156.1 |
| A | 15 | 174 | 9509 | 56.06 | 773 | 757 | 156.1 |
| B | 14 | 167 | 239852 | 1632.36 | 783 | 766 | 146.5 |
| B | 10 | 16 | 88670 | 600.17 | 783 | 766 | 146.5 |
| B | 12 | 18 | 83797 | 566.9 | 783 | 766 | 146.5 |
| C | 14 | 48 | 22225 | 123.47 | 752 | 756 | 173.9 |
| C | 1 | 3 | 8714 | 45.77 | 752 | 756 | 173.9 |
| C | 13 | 61 | 6262 | 31.66 | 752 | 756 | 173.9 |
| D | 13 | 235 | 3467596 | 21798.74 | 668 | 649 | 159.0 |
| D | 2 | 136 | 118586 | 741.54 | 668 | 649 | 159.0 |
| D | 10 | 15 | 66396 | 413.39 | 668 | 649 | 159.0 |
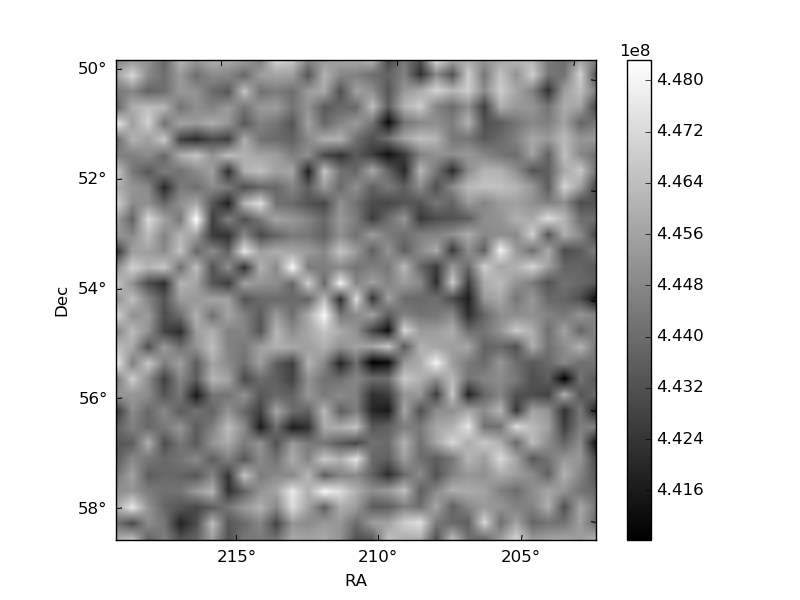
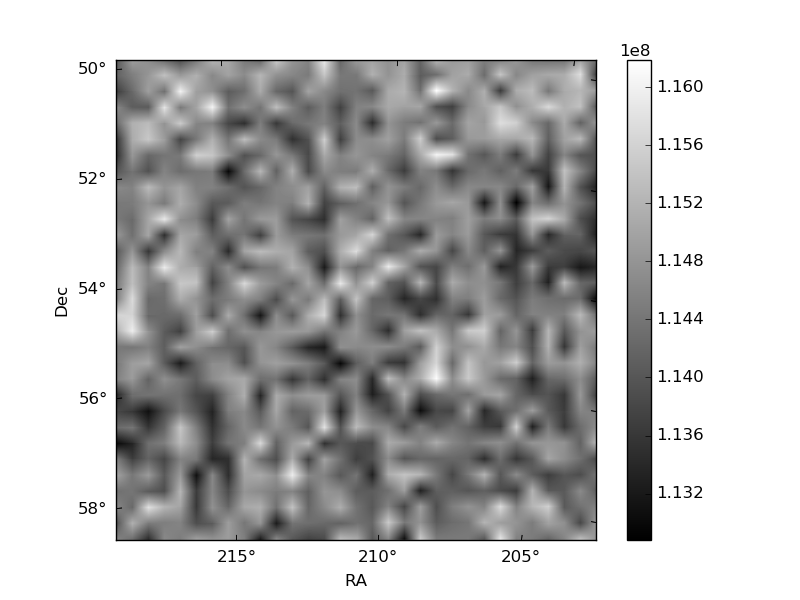
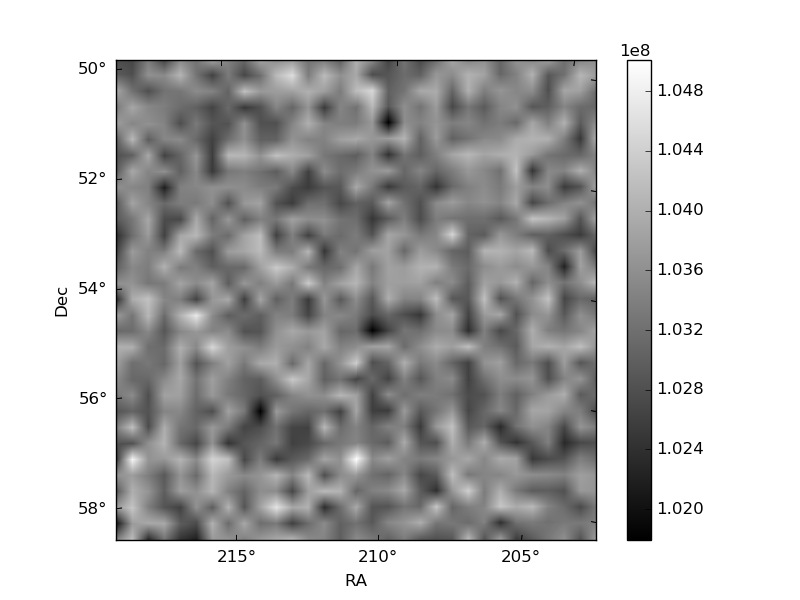
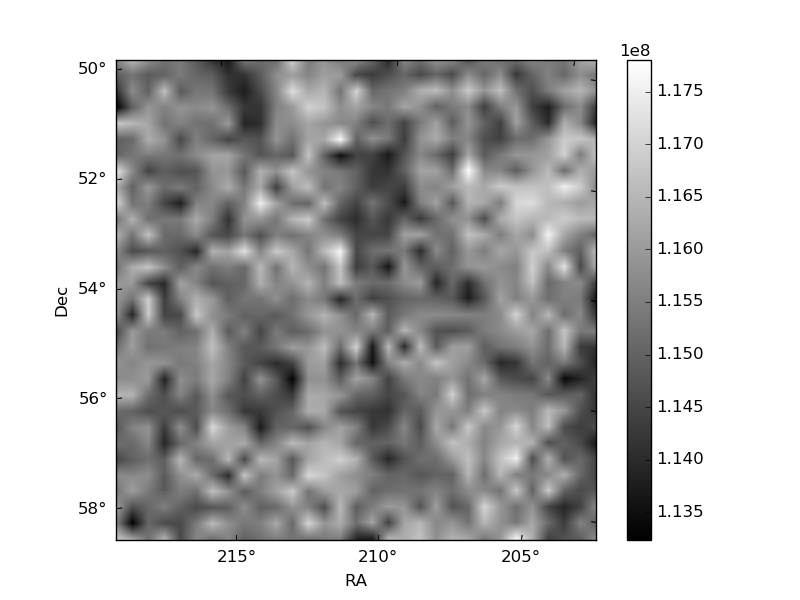
Histogram calculated using DETX and DETY for each event in the final _common_clean file
| Quadrant A | 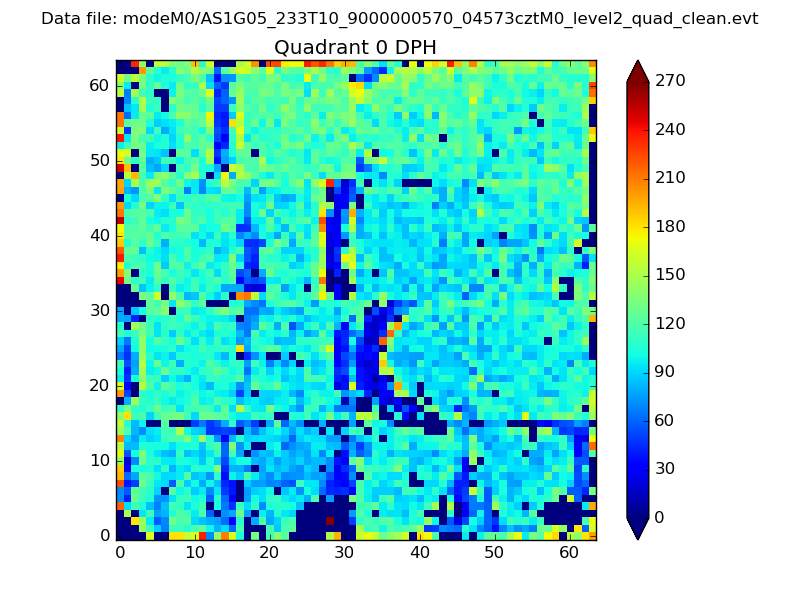 |
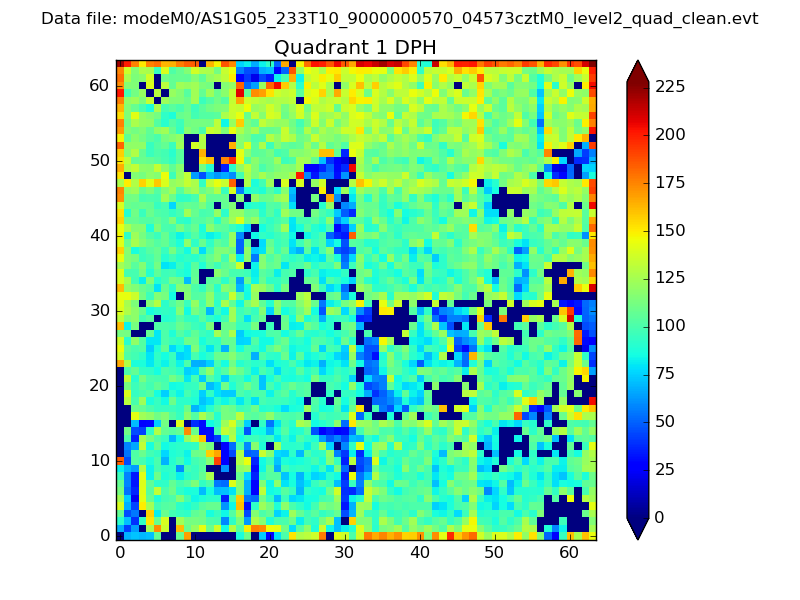 |
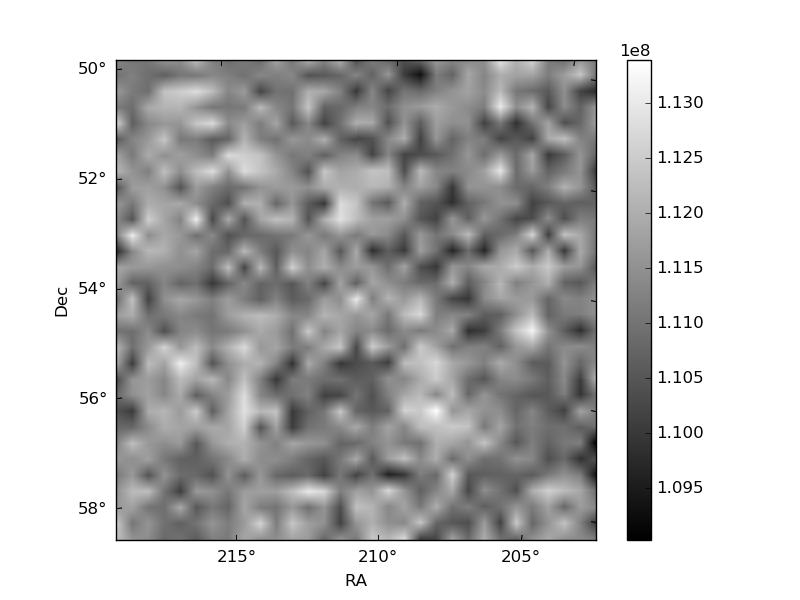
Quadrant B |
|---|---|---|---|
| Quadrant D | 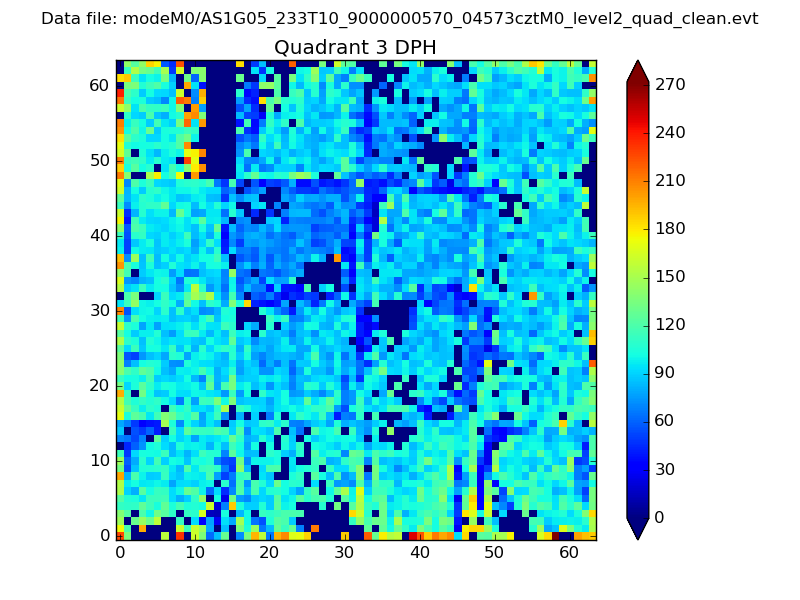 |
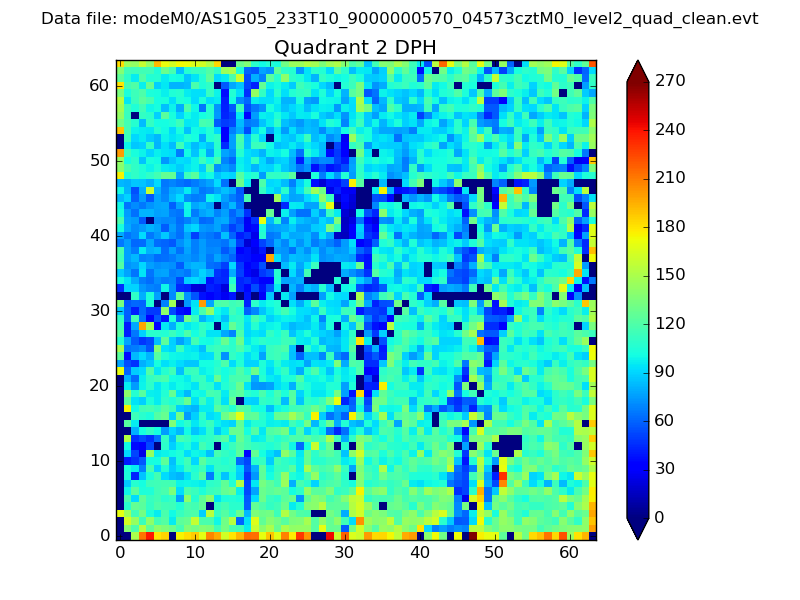 |
Quadrant C |
| Plot type | Count rate plots | Images |
|---|---|---|
| Comparison with Poisson distribution Blue bars denote a histogram of data divided into 1 sec bins. Red curve is a Poisson curve with rate = median count rate of data. |
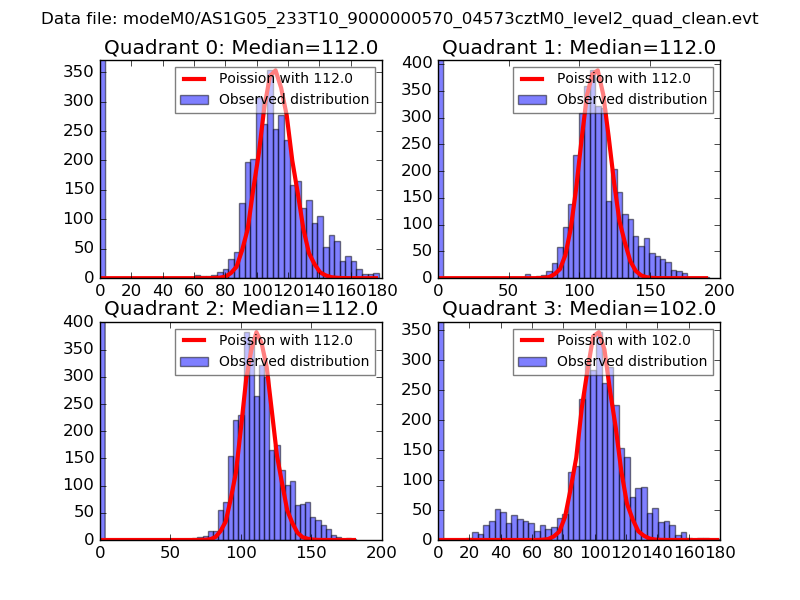 |
 |
| Quadrant-wise count rates Data is divided into 100 sec bins |
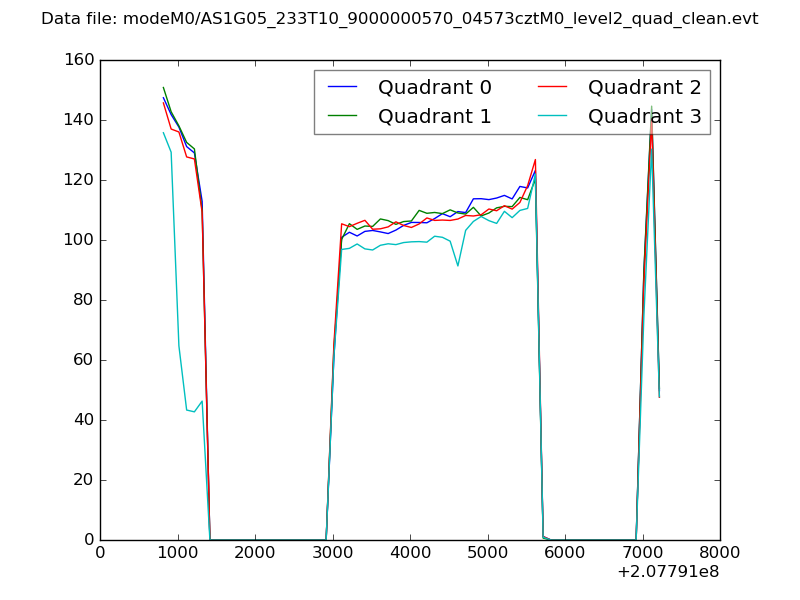 |
|
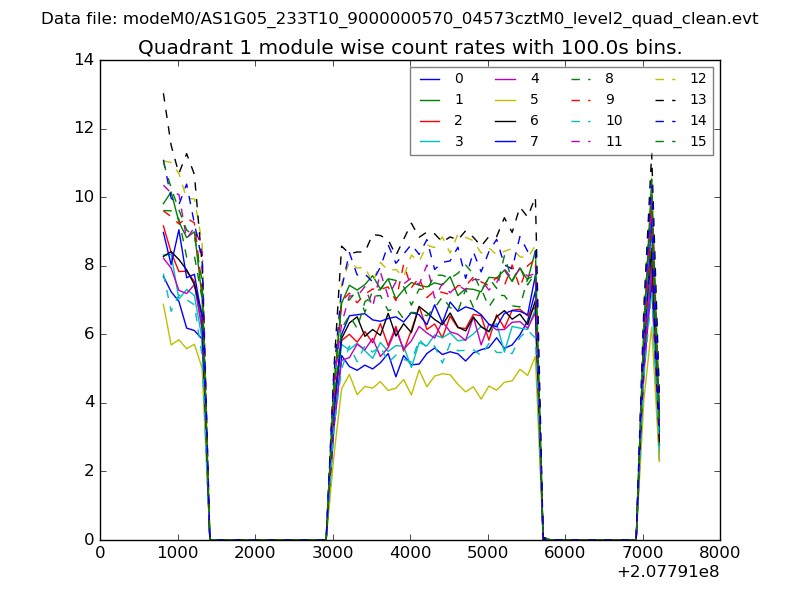
| Module-wise count rates for Quadrant A Data is divided into 100 sec bins |
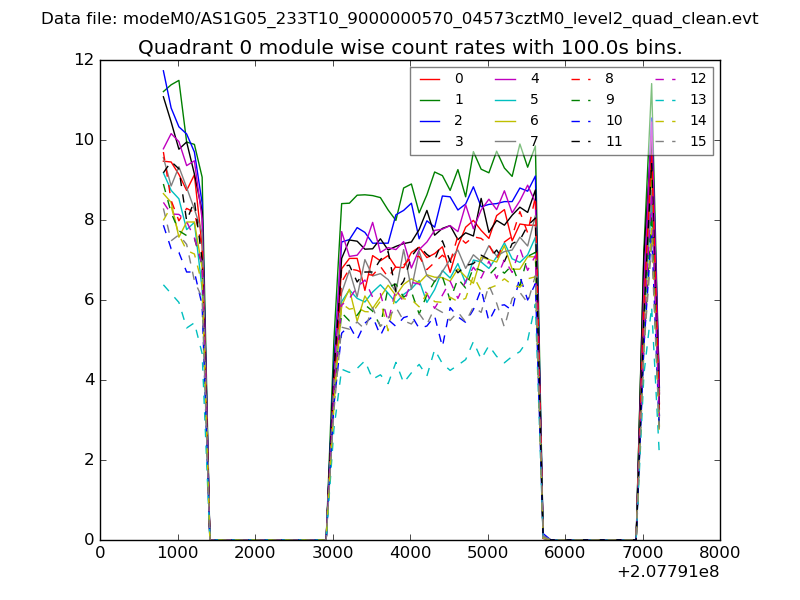 |
 |
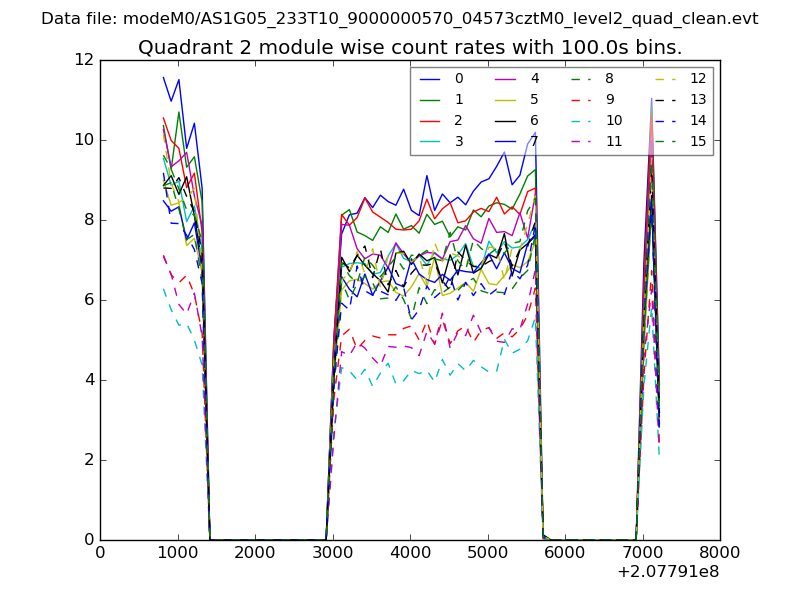
| Module-wise count rates for Quadrant B Data is divided into 100 sec bins |
 |
 |
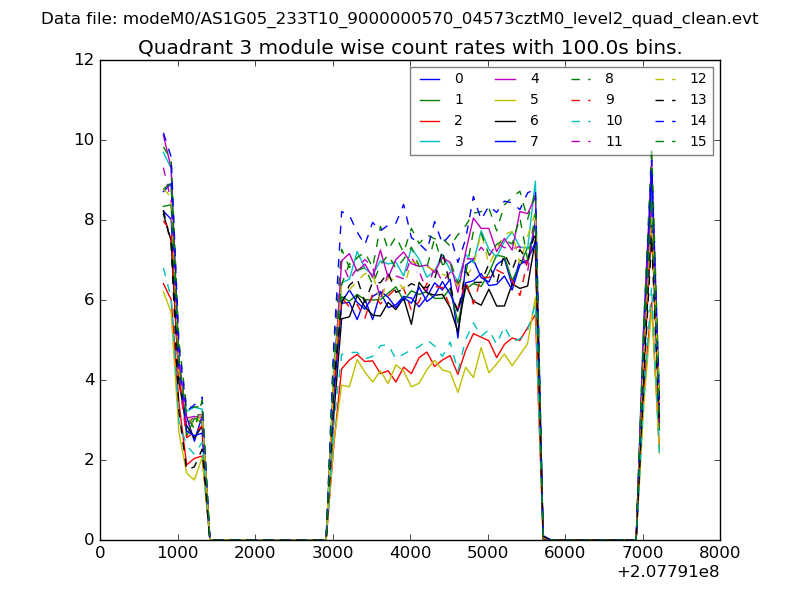
| Module-wise count rates for Quadrant C Data is divided into 100 sec bins |
 |
 |
| Module-wise count rates for Quadrant D Data is divided into 100 sec bins |
 |
 |
| Parameter | Plot |
|---|---|
| CZT HV Monitor | 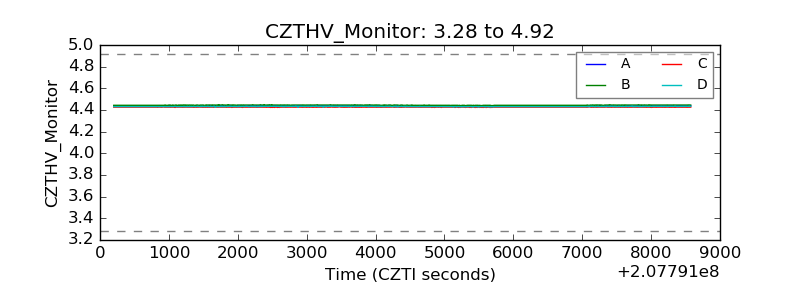 |
| D_VDD | 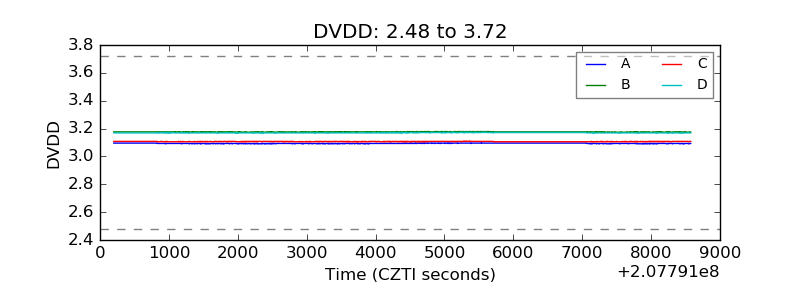 |
| Temperature 1 | 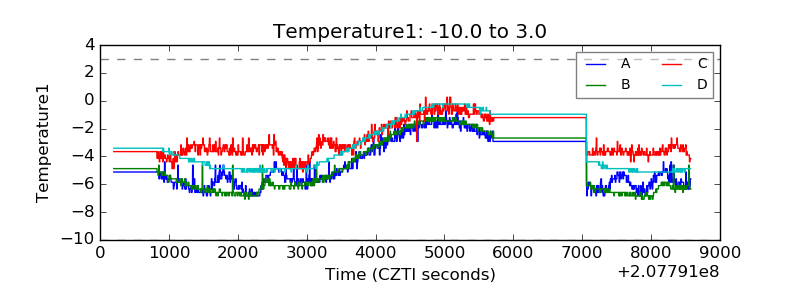 |
| Veto HV Monitor | 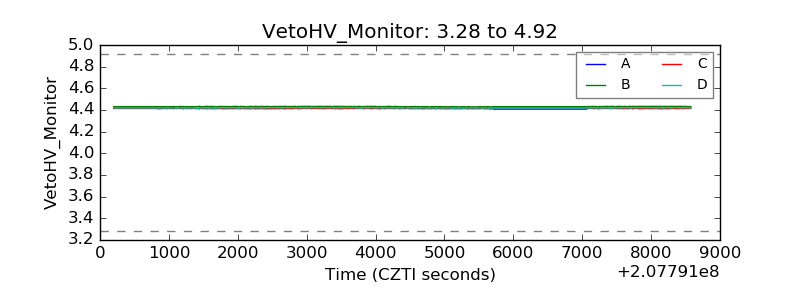 |
| Veto LLD | 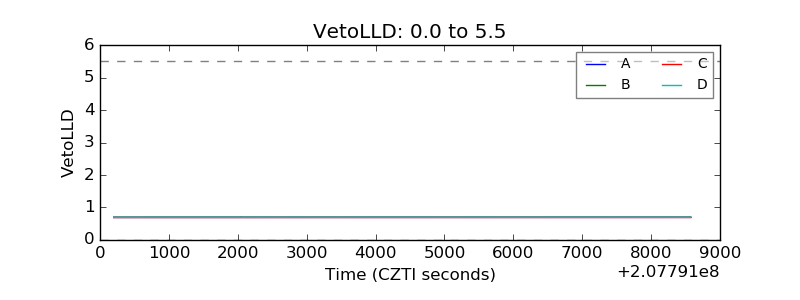 |
| Alpha Counter | 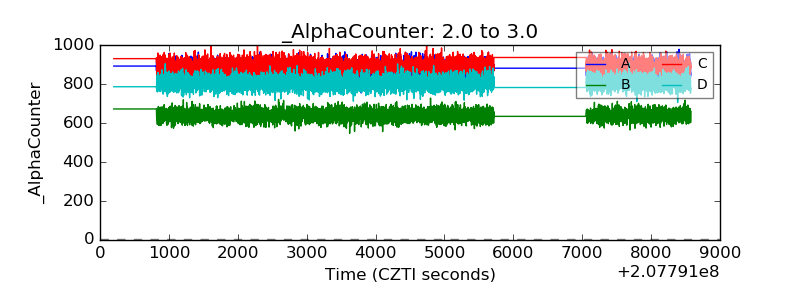 |
| _CPM_Rate | 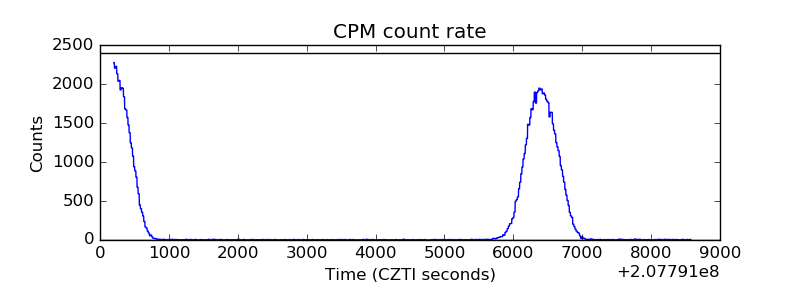 |
| CZT Counter | 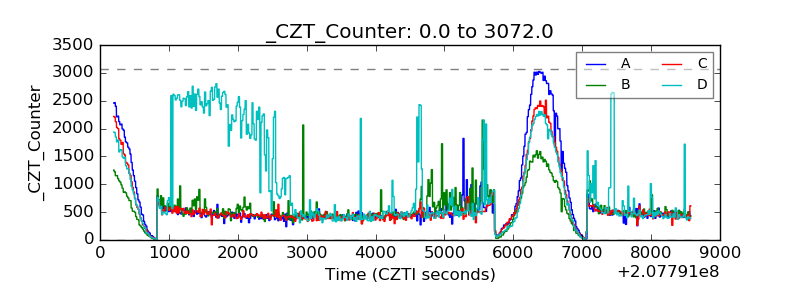 |
| +2.5 Volts monitor | 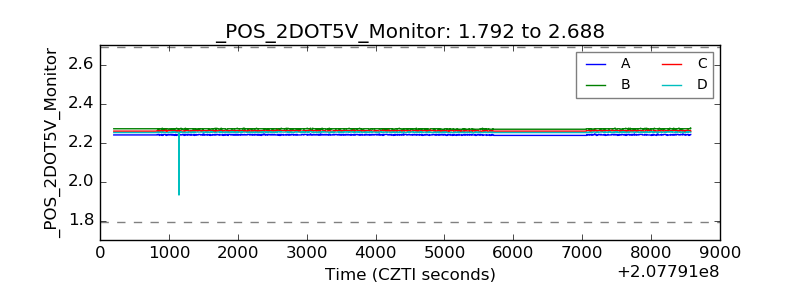 |
| +5 Volts monitor | 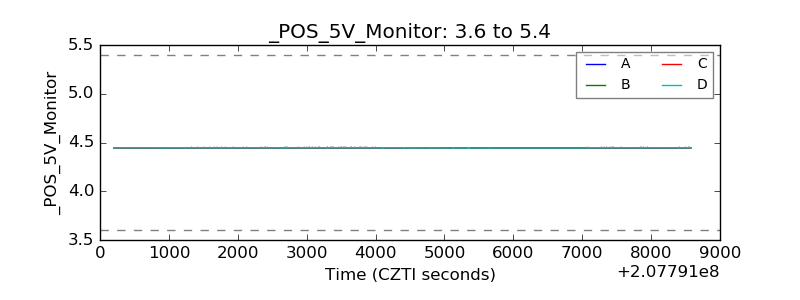 |
| _ROLL_ROT | 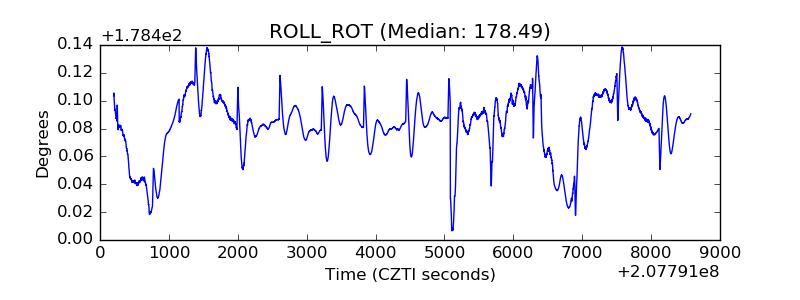 |
| _Roll_DEC | 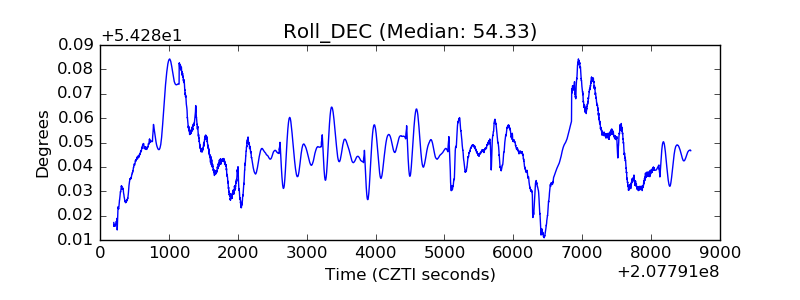 |
| _Roll_RA | 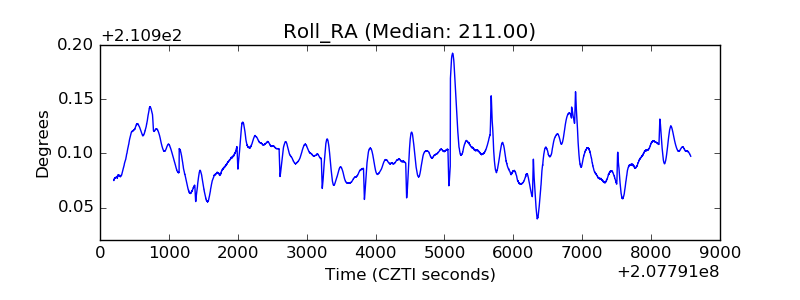 |
| Veto Counter | 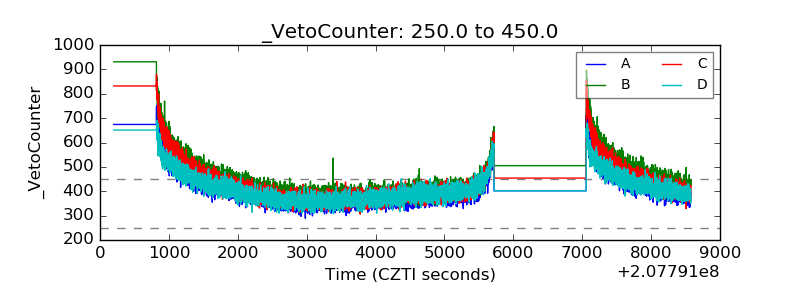 |