| Param | Original file | Final file |
|---|---|---|
| Filename | modeM0/AS1G05_233T10_9000000570_04574cztM0_level2.evt | modeM0/AS1G05_233T10_9000000570_04574cztM0_level2_quad_clean.evt |
| Size (bytes) | 451,088,640 | 63,501,120 |
| Size | 430.2 MB | 60.6 MB |
| Events in quadrant A | 3,349,303 | 373,591 |
| Events in quadrant B | 3,258,524 | 378,609 |
| Events in quadrant C | 3,069,519 | 372,865 |
| Events in quadrant D | 3,546,131 | 348,212 |
| Mode M9 | |||
|---|---|---|---|
| Quadrant | BADHDUFLAG | Total packets | Discarded packets |
| A | 0 | 14 | 0 |
| B | 0 | 14 | 0 |
| C | 0 | 14 | 0 |
| D | 0 | 15 | 0 |
| Mode M0 | |||
|---|---|---|---|
| Quadrant | BADHDUFLAG | Total packets | Discarded packets |
| A | 0 | 14207 | 3 |
| B | 0 | 13796 | 2 |
| C | 0 | 13532 | 2 |
| D | 0 | 15138 | 2 |
| Mode SS | |||
|---|---|---|---|
| Quadrant | BADHDUFLAG | Total packets | Discarded packets |
| A | 0 | 130 | 0 |
| B | 0 | 130 | 0 |
| C | 0 | 130 | 0 |
| D | 0 | 130 | 0 |
| Quadrant | Total seconds | Saturated seconds | Saturation percentage |
|---|---|---|---|
| A | 6441 | 123 | 1.909641% |
| B | 6441 | 72 | 1.117839% |
| C | 6441 | 50 | 0.776277% |
| D | 6441 | 232 | 3.601925% |
Noise dominated data is calculated using 1-second bins in cleaned event files. If a bin has >2000 counts, and if more than 50% of those come from <1% of pixels, then it is considered to be noise-dominated and hence unusable.
| Quadrant | # 1 sec bins | Bins with >0 counts | Bins with >2000 counts | High rate bins dominated by noise | Noise dominated (total time) | Noise dominated (detector-on time) | Marked lightcurve |
|---|---|---|---|---|---|---|---|
| A | 7791 | 6442 | 42 | 42 | 0.54% | 0.65% | 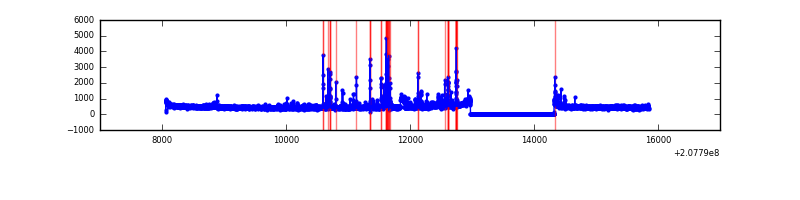 |
| B | 7791 | 6442 | 0 | 0 | 0.00% | 0.00% | 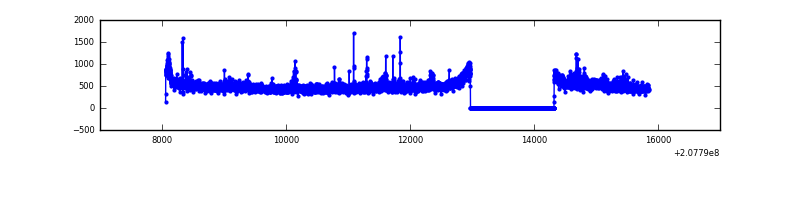 |
| C | 7791 | 6442 | 9 | 9 | 0.12% | 0.14% | 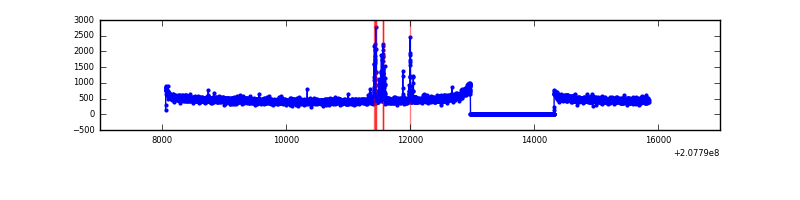 |
| D | 7791 | 6442 | 179 | 179 | 2.30% | 2.78% | 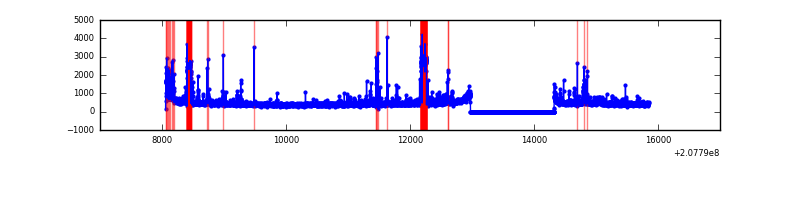 |
Top three noisy pixels from each quadrant. If the there are fewer than three noisy pixels in the level2.evt file, extra rows are filled as -1
| Pixel properties | Quadrant properties | ||||||
|---|---|---|---|---|---|---|---|
| Quadrant | DetID | PixID | Counts | Sigma | Mean | Median | Sigma |
| A | 0 | 13 | 288967 | 1851.01 | 774 | 758 | 155.7 |
| A | 0 | 50 | 69637 | 442.37 | 774 | 758 | 155.7 |
| A | 0 | 226 | 7811 | 45.3 | 774 | 758 | 155.7 |
| B | 12 | 18 | 74456 | 498.69 | 788 | 770 | 147.8 |
| B | 14 | 167 | 50373 | 335.7 | 788 | 770 | 147.8 |
| B | 15 | 54 | 17962 | 116.35 | 788 | 770 | 147.8 |
| C | 14 | 48 | 111618 | 639.97 | 753 | 756 | 173.2 |
| C | 14 | 67 | 10853 | 58.28 | 753 | 756 | 173.2 |
| C | 13 | 61 | 6274 | 31.85 | 753 | 756 | 173.2 |
| D | 13 | 235 | 288357 | 1632.98 | 730 | 708 | 176.1 |
| D | 10 | 15 | 285050 | 1614.2 | 730 | 708 | 176.1 |
| D | 2 | 136 | 69739 | 391.89 | 730 | 708 | 176.1 |
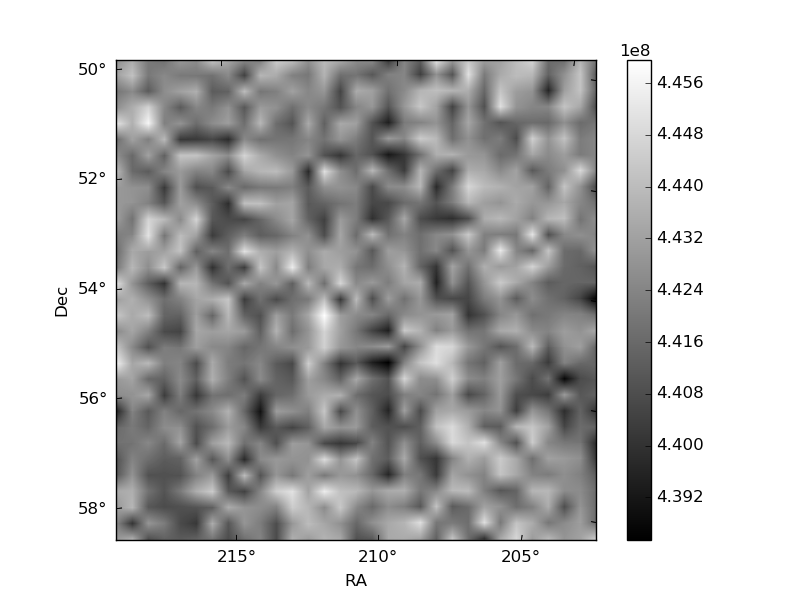
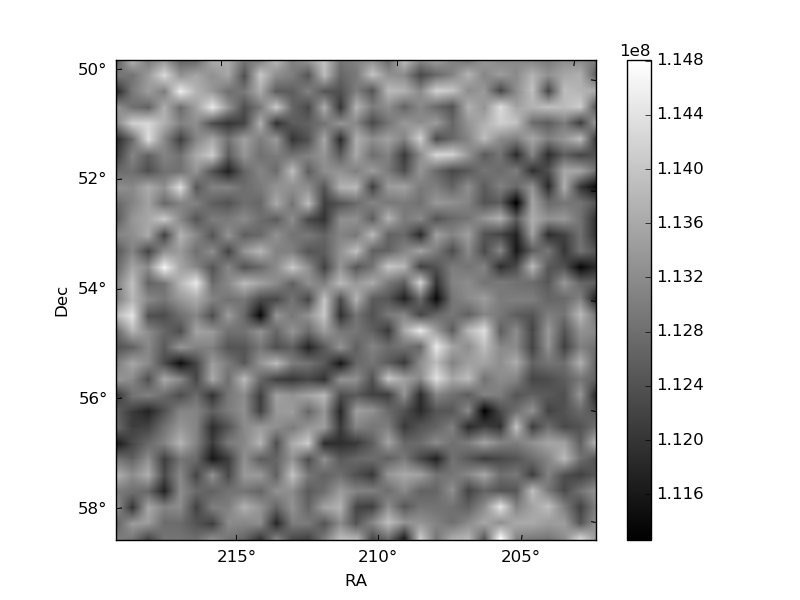
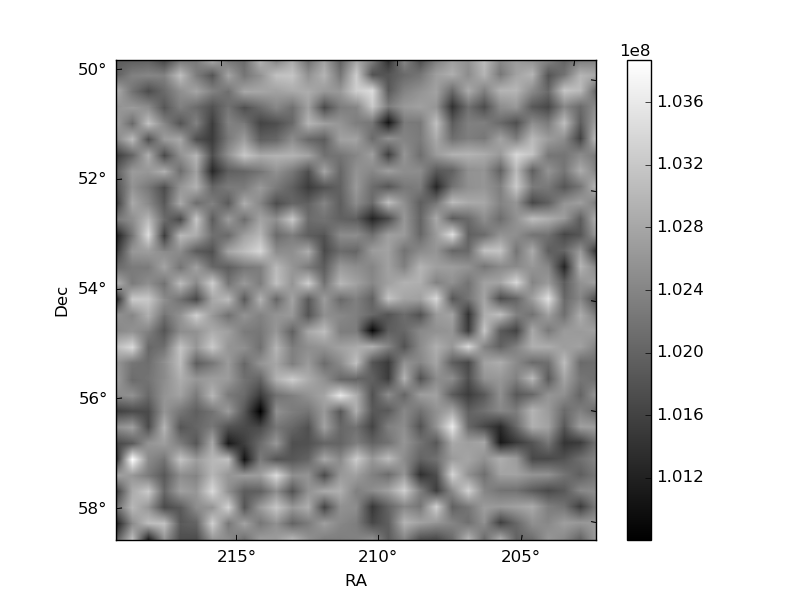
Histogram calculated using DETX and DETY for each event in the final _common_clean file
| Quadrant A | 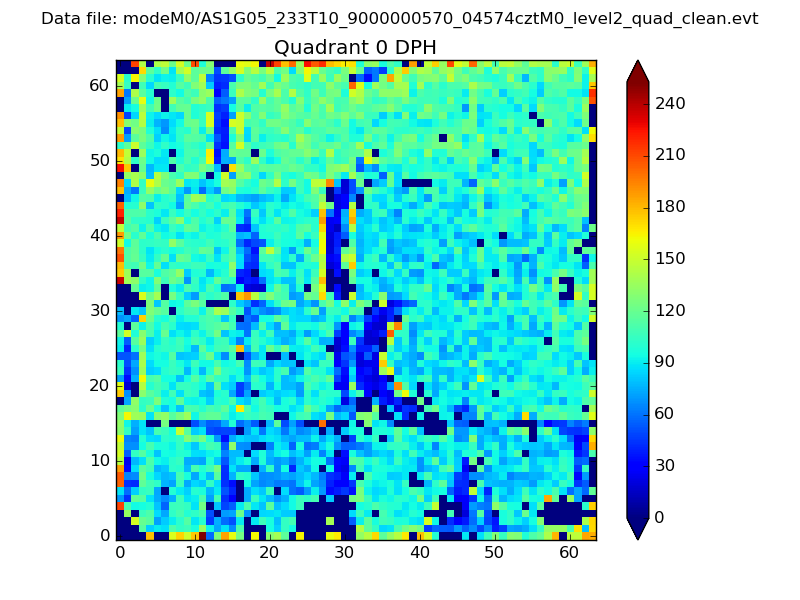 |
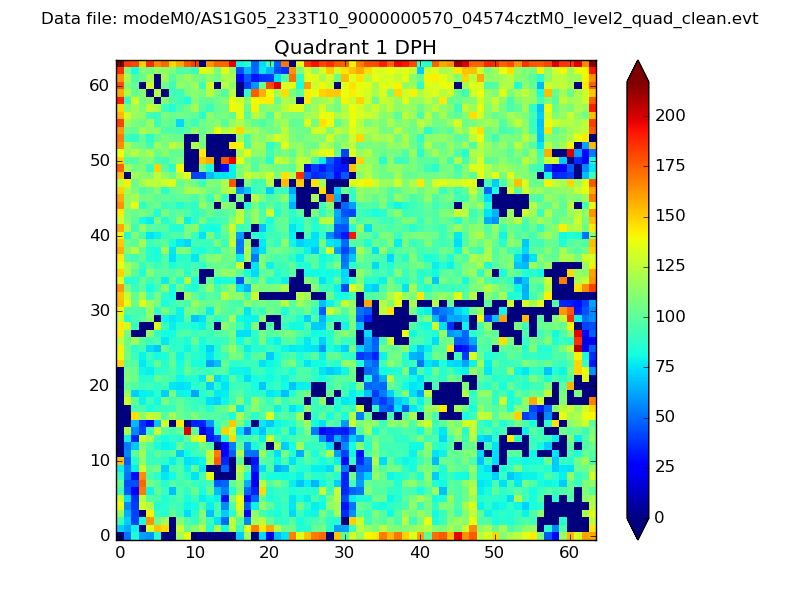 |
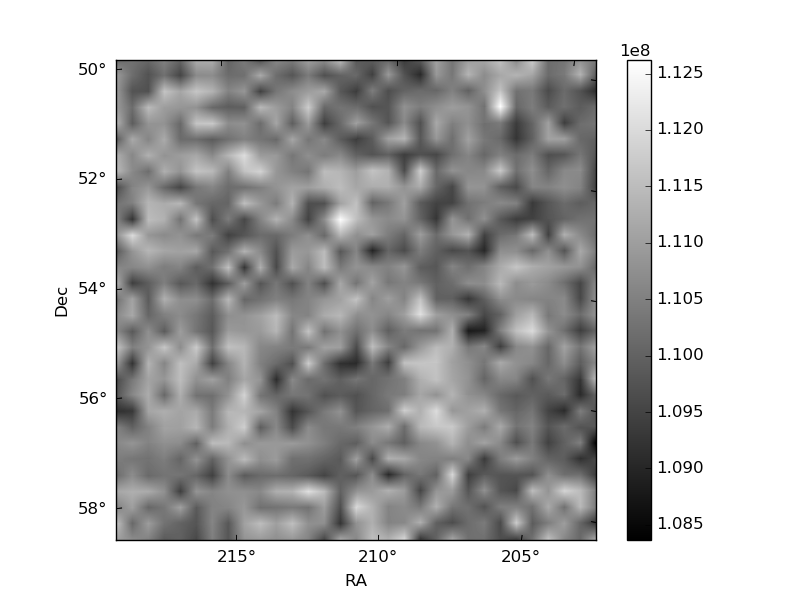
Quadrant B |
|---|---|---|---|
| Quadrant D | 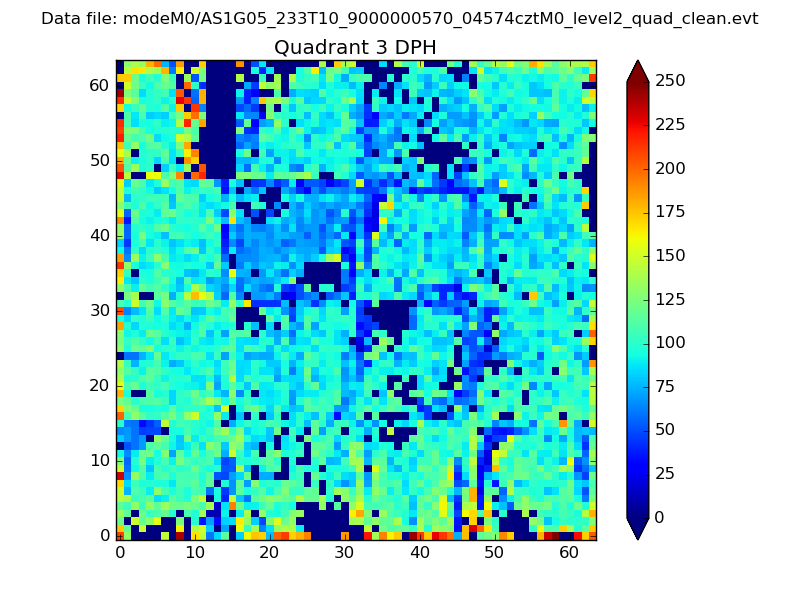 |
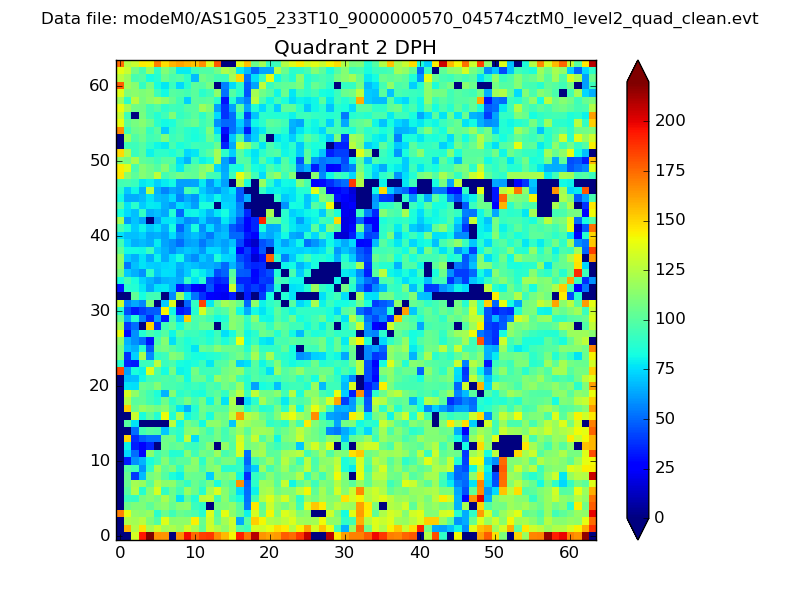 |
Quadrant C |
| Plot type | Count rate plots | Images |
|---|---|---|
| Comparison with Poisson distribution Blue bars denote a histogram of data divided into 1 sec bins. Red curve is a Poisson curve with rate = median count rate of data. |
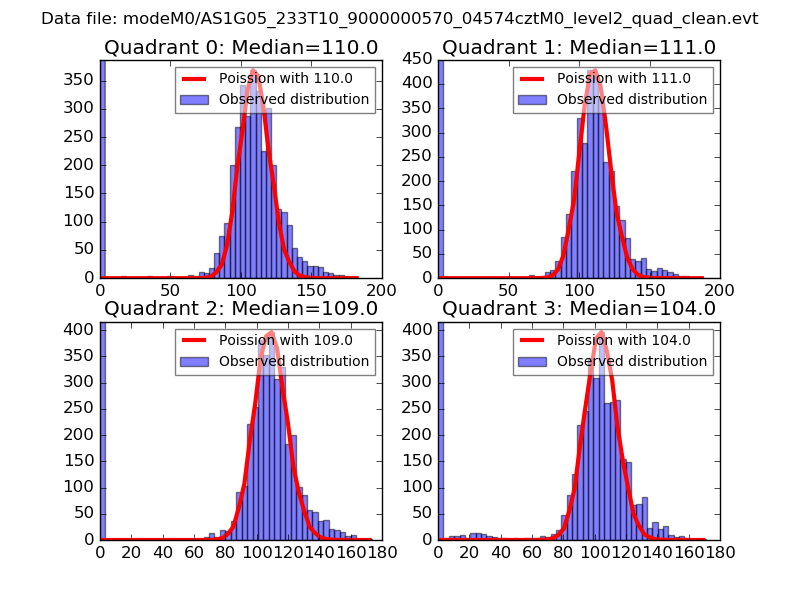 |
 |
| Quadrant-wise count rates Data is divided into 100 sec bins |
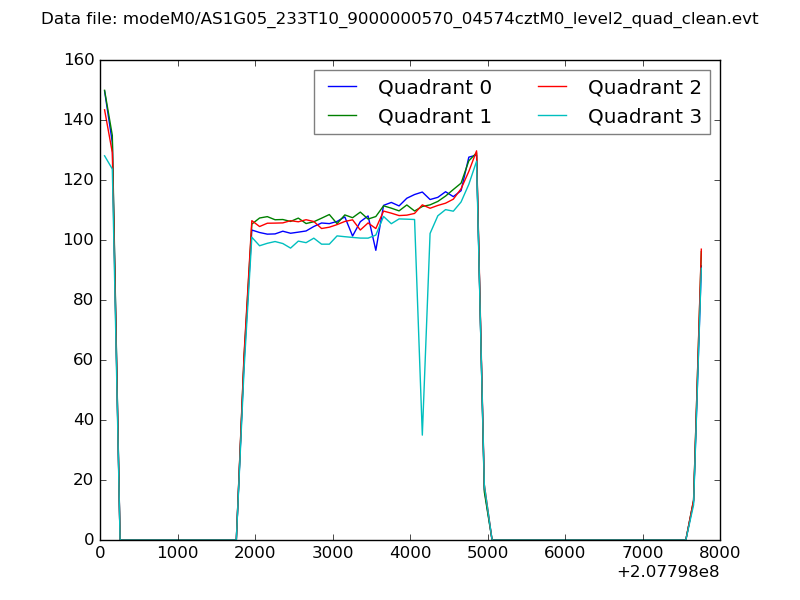 |
|
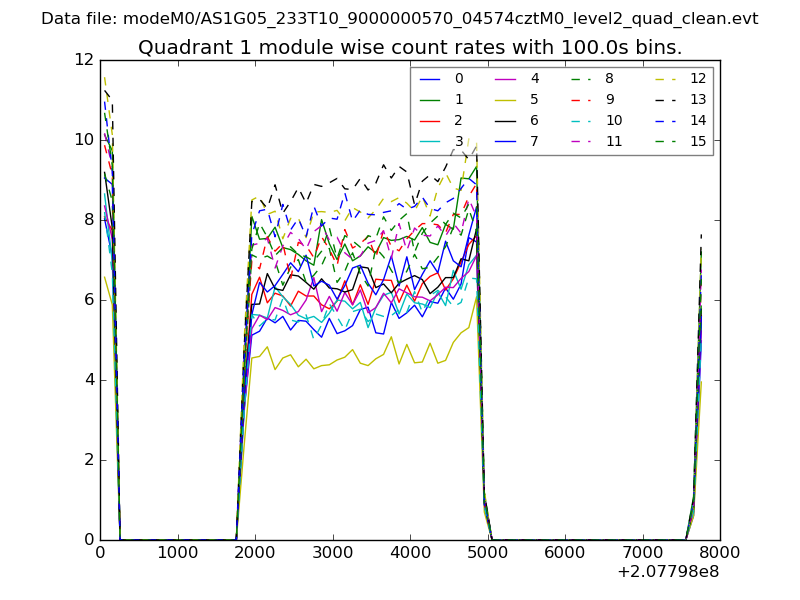
| Module-wise count rates for Quadrant A Data is divided into 100 sec bins |
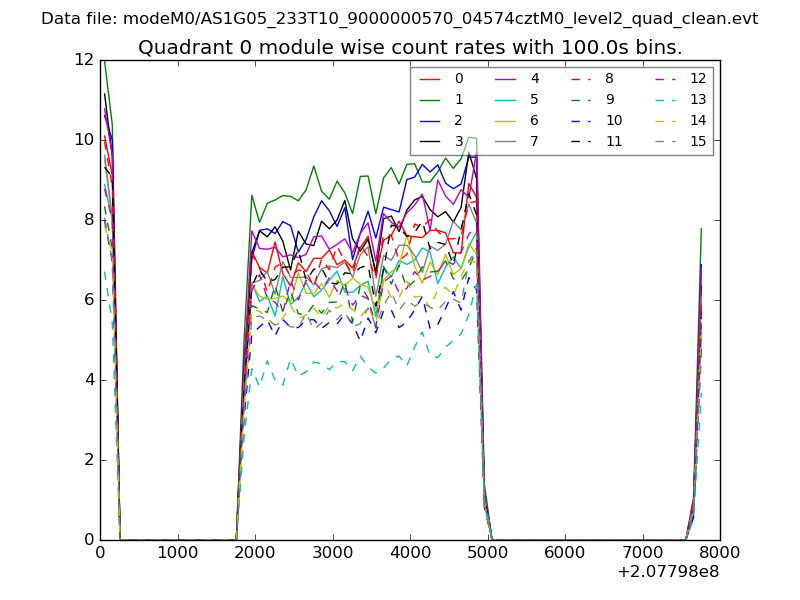 |
 |
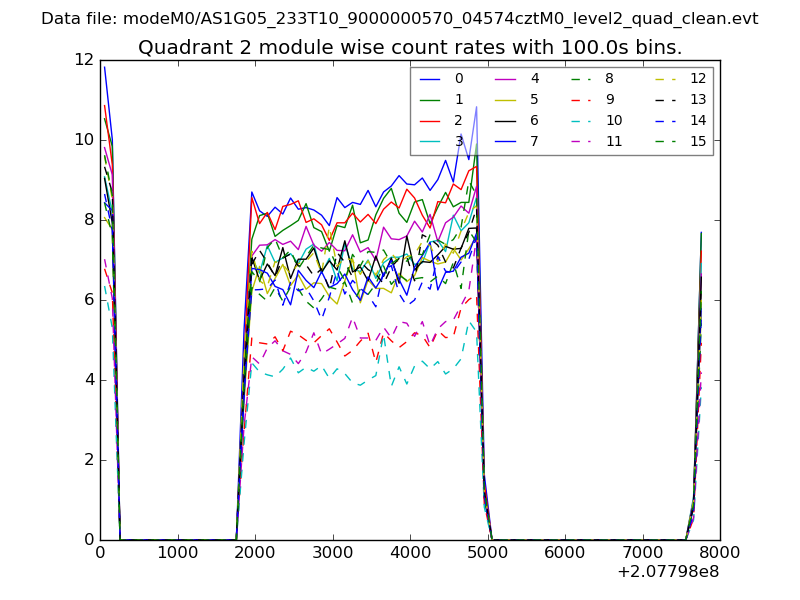
| Module-wise count rates for Quadrant B Data is divided into 100 sec bins |
 |
 |
| Module-wise count rates for Quadrant C Data is divided into 100 sec bins |
 |
 |
| Module-wise count rates for Quadrant D Data is divided into 100 sec bins |
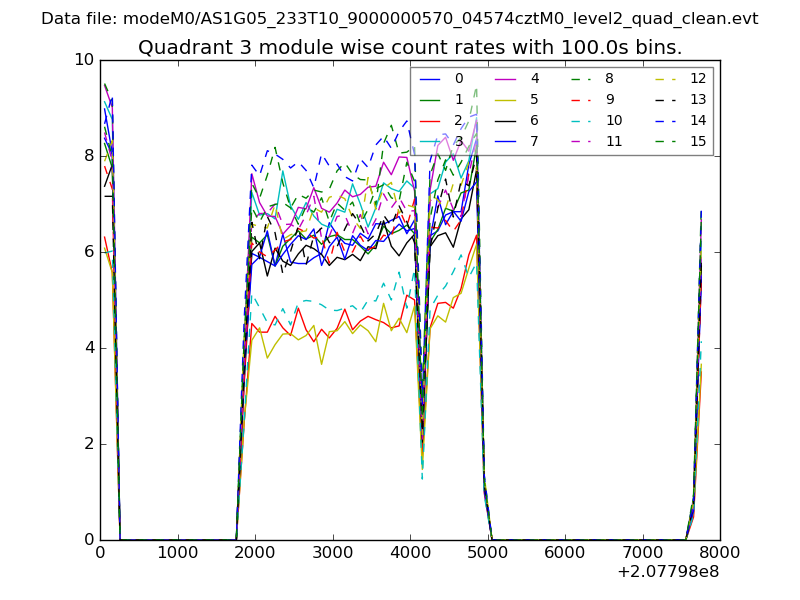 |
 |
| Parameter | Plot |
|---|---|
| CZT HV Monitor | 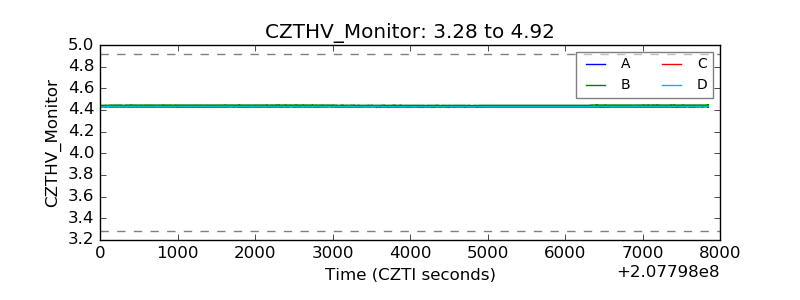 |
| D_VDD | 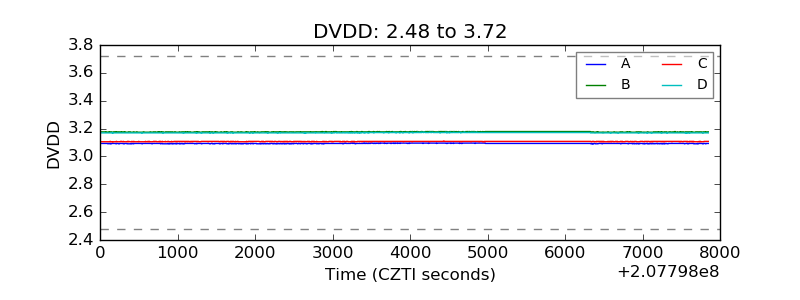 |
| Temperature 1 | 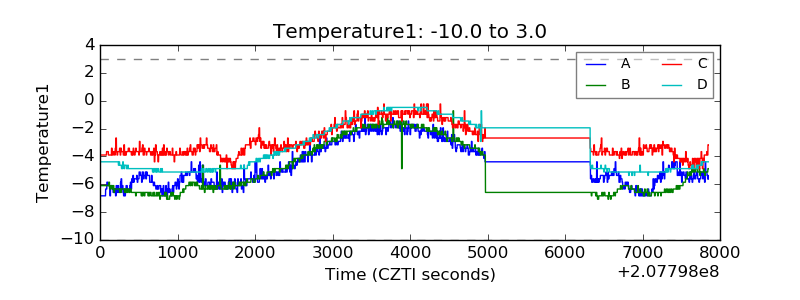 |
| Veto HV Monitor | 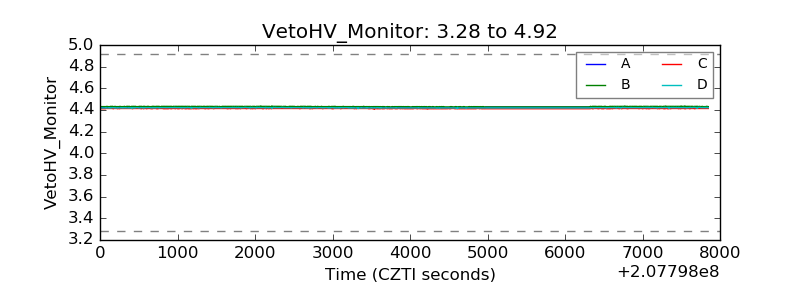 |
| Veto LLD | 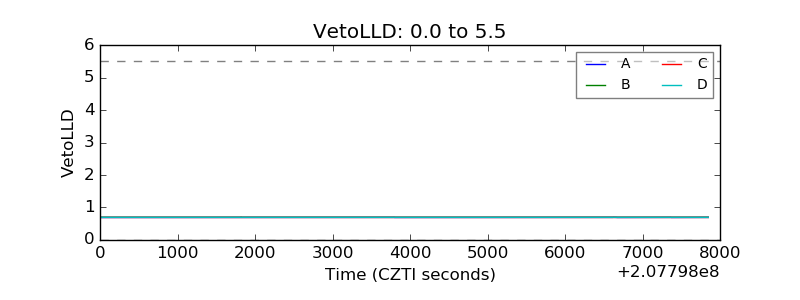 |
| Alpha Counter | 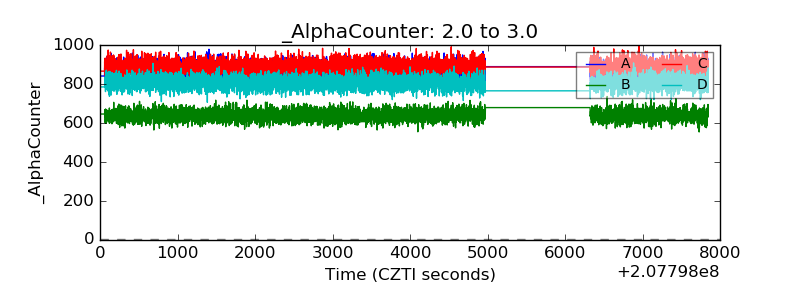 |
| _CPM_Rate | 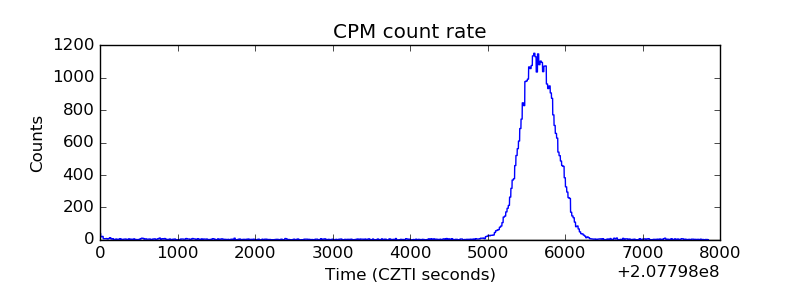 |
| CZT Counter | 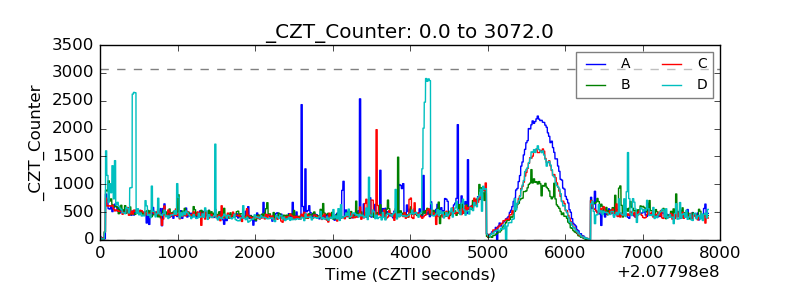 |
| +2.5 Volts monitor |  |
| +5 Volts monitor |  |
| _ROLL_ROT | 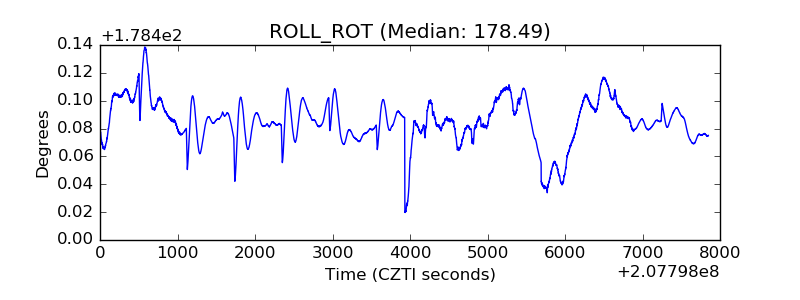 |
| _Roll_DEC | 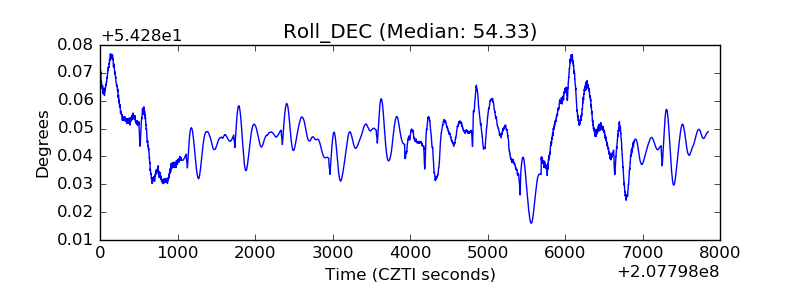 |
| _Roll_RA | 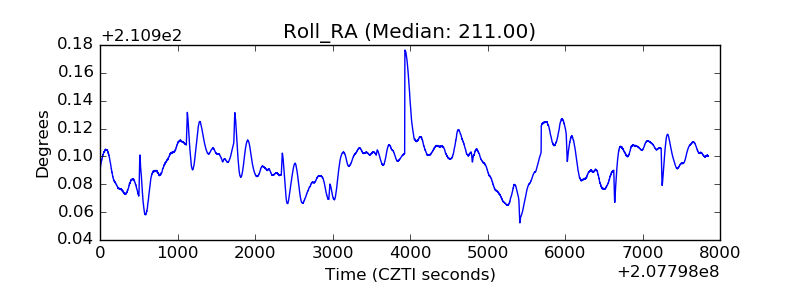 |
| Veto Counter | 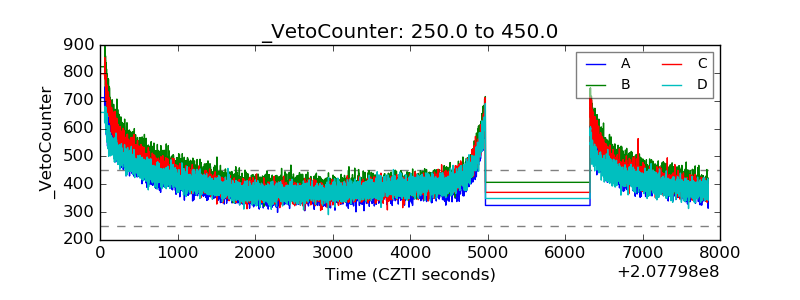 |