| Param | Original file | Final file |
|---|---|---|
| Filename | modeM0/AS1G05_233T10_9000000570_04576cztM0_level2.evt | modeM0/AS1G05_233T10_9000000570_04576cztM0_level2_quad_clean.evt |
| Size (bytes) | 439,755,840 | 90,276,480 |
| Size | 419.4 MB | 86.1 MB |
| Events in quadrant A | 3,466,944 | 578,943 |
| Events in quadrant B | 3,214,708 | 589,530 |
| Events in quadrant C | 2,798,012 | 580,598 |
| Events in quadrant D | 3,418,862 | 554,111 |
| Mode M9 | |||
|---|---|---|---|
| Quadrant | BADHDUFLAG | Total packets | Discarded packets |
| A | 0 | 9 | 0 |
| B | 0 | 9 | 0 |
| C | 0 | 9 | 0 |
| D | 0 | 9 | 0 |
| Mode M0 | |||
|---|---|---|---|
| Quadrant | BADHDUFLAG | Total packets | Discarded packets |
| A | 0 | 14605 | 1 |
| B | 0 | 13617 | 0 |
| C | 0 | 12809 | 0 |
| D | 0 | 14611 | 0 |
| Mode SS | |||
|---|---|---|---|
| Quadrant | BADHDUFLAG | Total packets | Discarded packets |
| A | 0 | 124 | 0 |
| B | 0 | 124 | 0 |
| C | 0 | 124 | 0 |
| D | 0 | 124 | 0 |
| Quadrant | Total seconds | Saturated seconds | Saturation percentage |
|---|---|---|---|
| A | 6173 | 242 | 3.920298% |
| B | 6173 | 149 | 2.413737% |
| C | 6173 | 96 | 1.555160% |
| D | 6173 | 235 | 3.806901% |
Noise dominated data is calculated using 1-second bins in cleaned event files. If a bin has >2000 counts, and if more than 50% of those come from <1% of pixels, then it is considered to be noise-dominated and hence unusable.
| Quadrant | # 1 sec bins | Bins with >0 counts | Bins with >2000 counts | High rate bins dominated by noise | Noise dominated (total time) | Noise dominated (detector-on time) | Marked lightcurve |
|---|---|---|---|---|---|---|---|
| A | 6993 | 6174 | 97 | 97 | 1.39% | 1.57% | 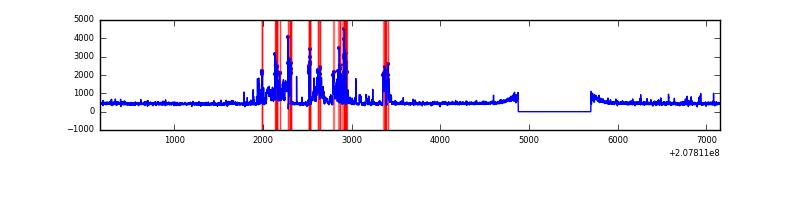 |
| B | 6993 | 6174 | 12 | 12 | 0.17% | 0.19% | 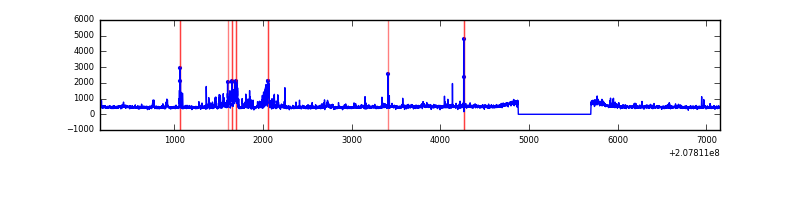 |
| C | 6993 | 6174 | 5 | 5 | 0.07% | 0.08% | 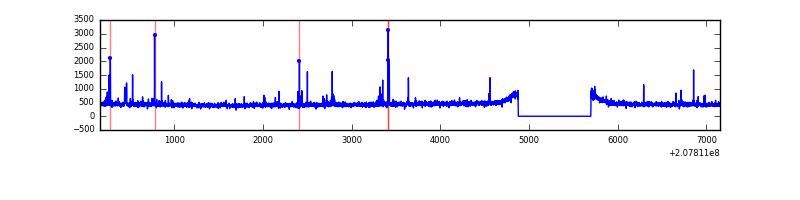 |
| D | 6993 | 6174 | 130 | 130 | 1.86% | 2.11% | 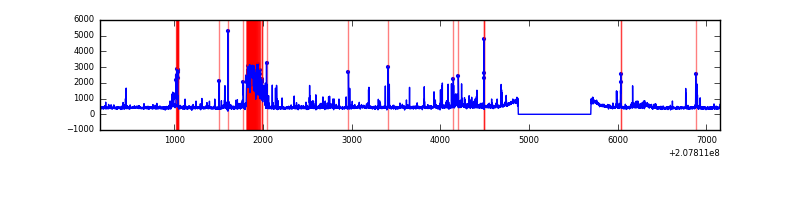 |
Top three noisy pixels from each quadrant. If the there are fewer than three noisy pixels in the level2.evt file, extra rows are filled as -1
| Pixel properties | Quadrant properties | ||||||
|---|---|---|---|---|---|---|---|
| Quadrant | DetID | PixID | Counts | Sigma | Mean | Median | Sigma |
| A | 0 | 50 | 647608 | 4469.32 | 710 | 694 | 144.7 |
| A | 0 | 13 | 71361 | 488.22 | 710 | 694 | 144.7 |
| A | 12 | 194 | 7321 | 45.78 | 710 | 694 | 144.7 |
| B | 14 | 167 | 286584 | 2065.04 | 719 | 699 | 138.4 |
| B | 15 | 204 | 47921 | 341.1 | 719 | 699 | 138.4 |
| B | 4 | 48 | 35440 | 250.95 | 719 | 699 | 138.4 |
| C | 14 | 48 | 60568 | 370.78 | 692 | 693 | 161.5 |
| C | 9 | 247 | 12361 | 72.25 | 692 | 693 | 161.5 |
| C | 9 | 16 | 12143 | 70.9 | 692 | 693 | 161.5 |
| D | 10 | 15 | 384192 | 2325.45 | 688 | 667 | 164.9 |
| D | 13 | 235 | 197511 | 1193.54 | 688 | 667 | 164.9 |
| D | 13 | 53 | 69217 | 415.64 | 688 | 667 | 164.9 |
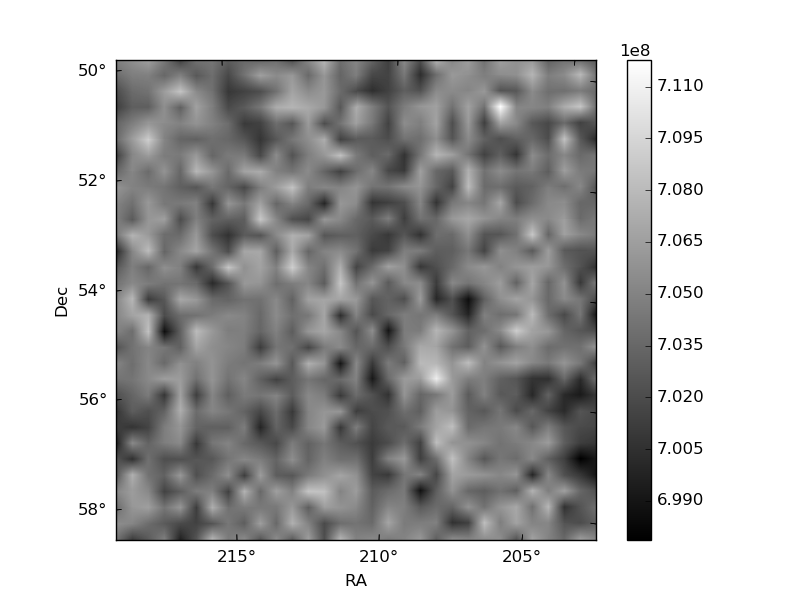
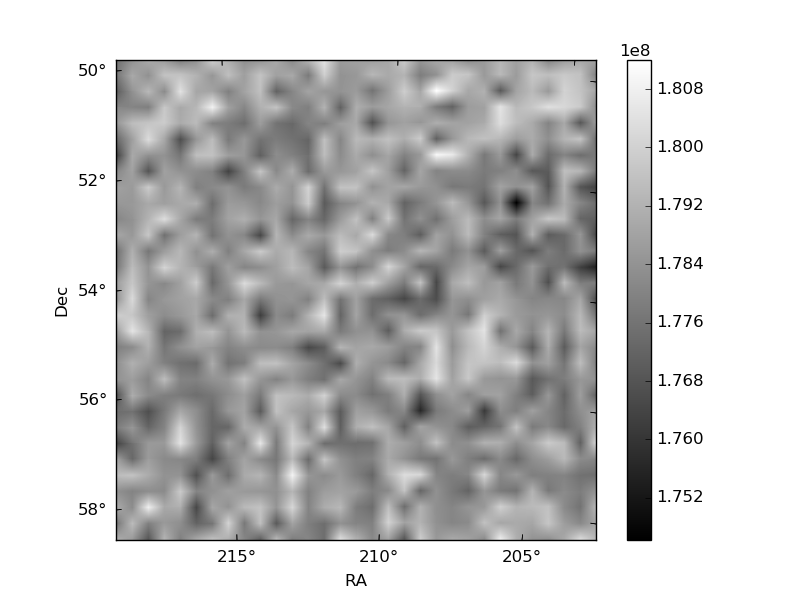
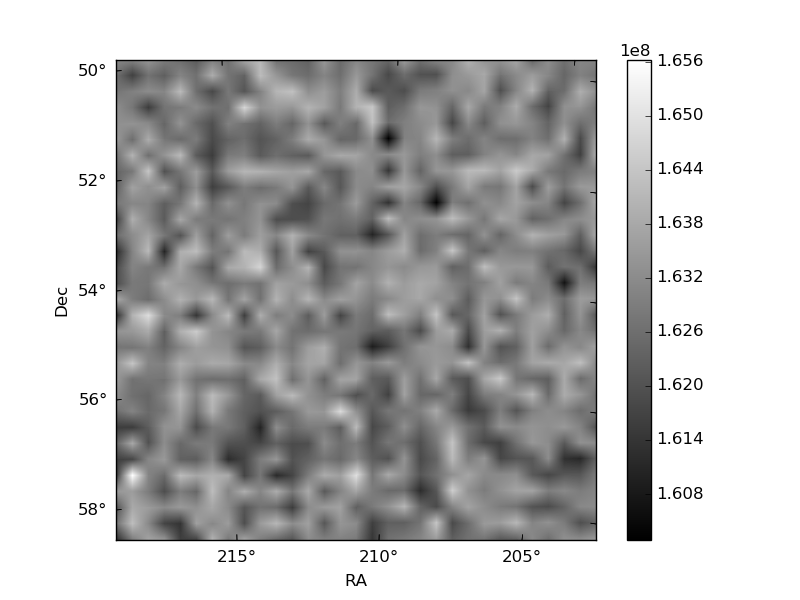
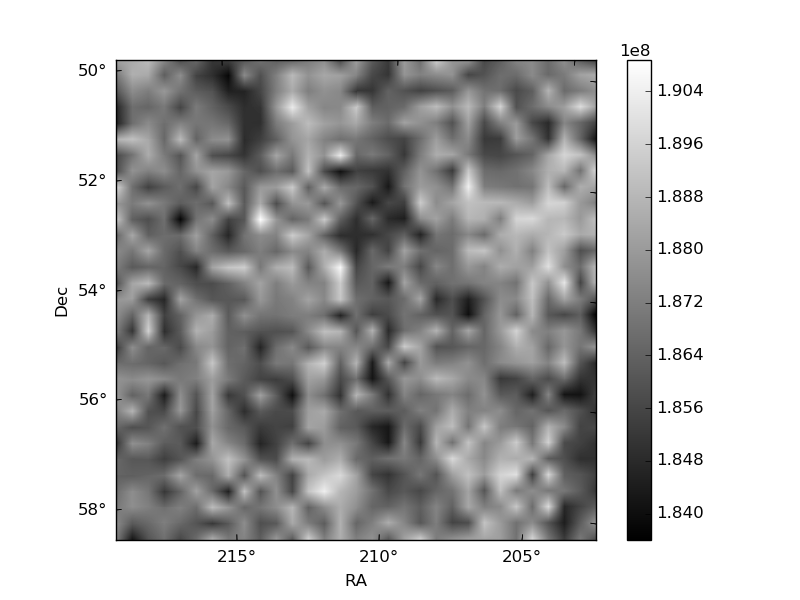
Histogram calculated using DETX and DETY for each event in the final _common_clean file
| Quadrant A | 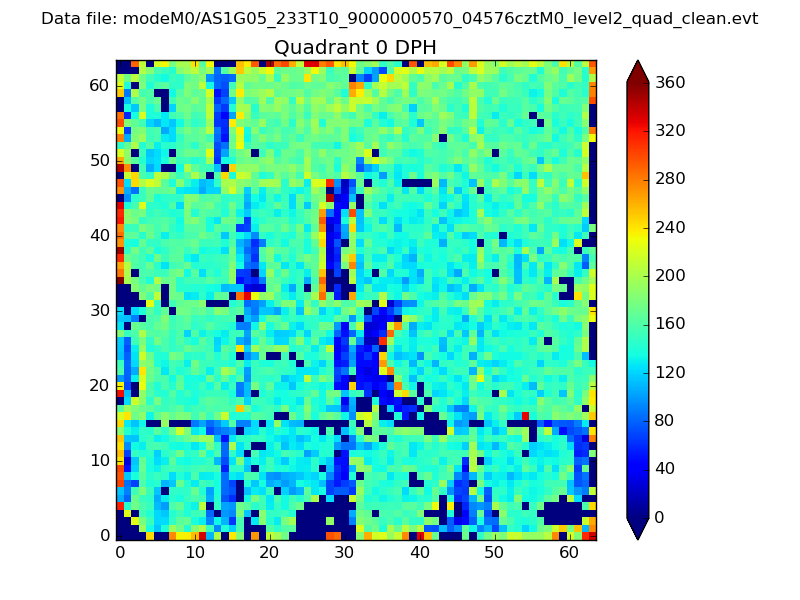 |
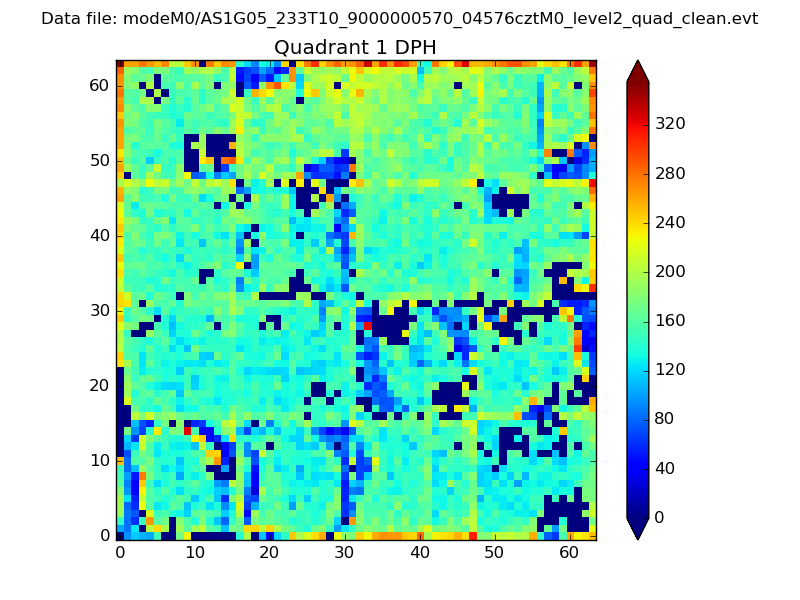 |
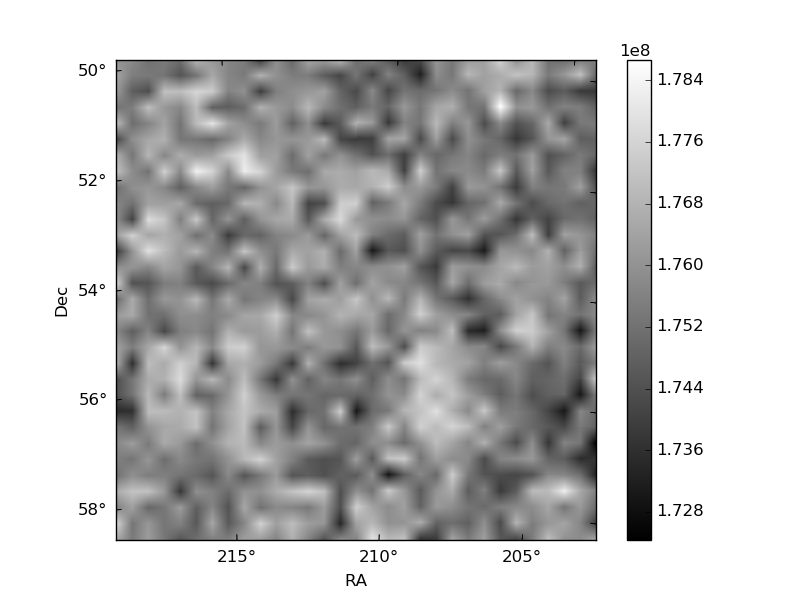
Quadrant B |
|---|---|---|---|
| Quadrant D | 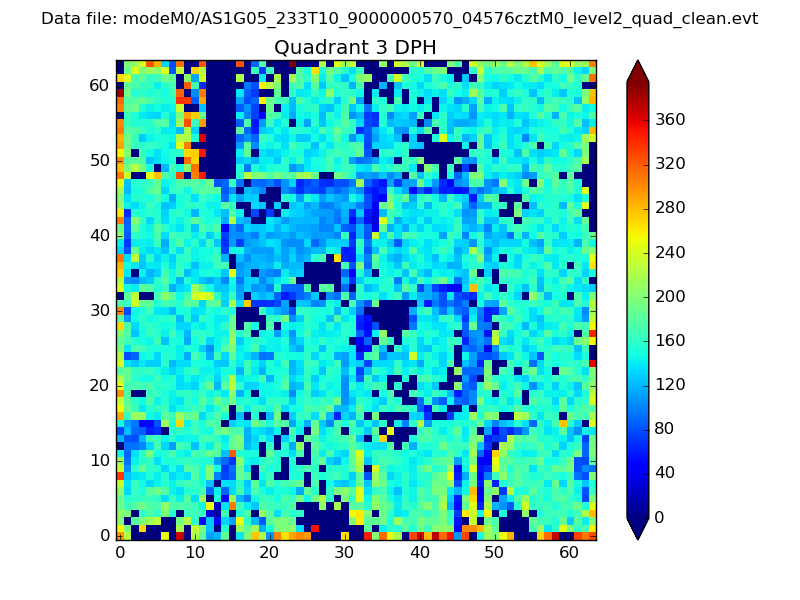 |
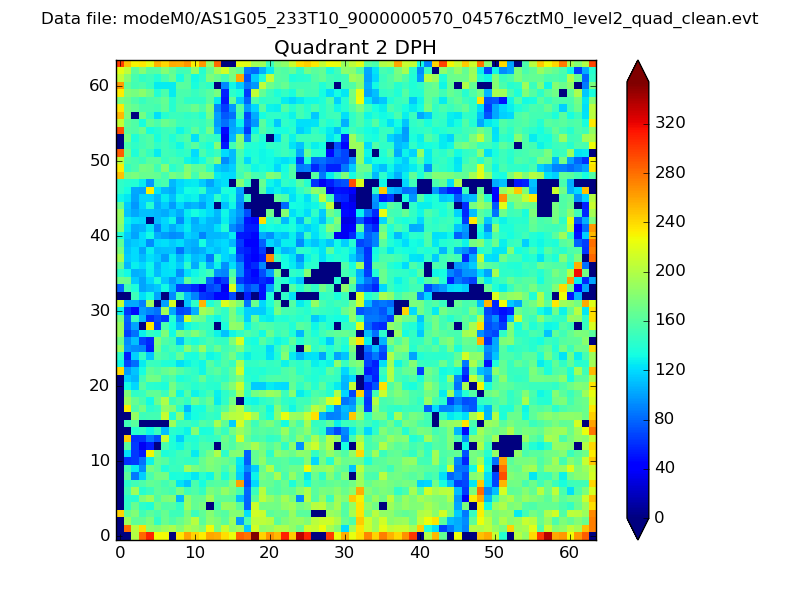 |
Quadrant C |
| Plot type | Count rate plots | Images |
|---|---|---|
| Comparison with Poisson distribution Blue bars denote a histogram of data divided into 1 sec bins. Red curve is a Poisson curve with rate = median count rate of data. |
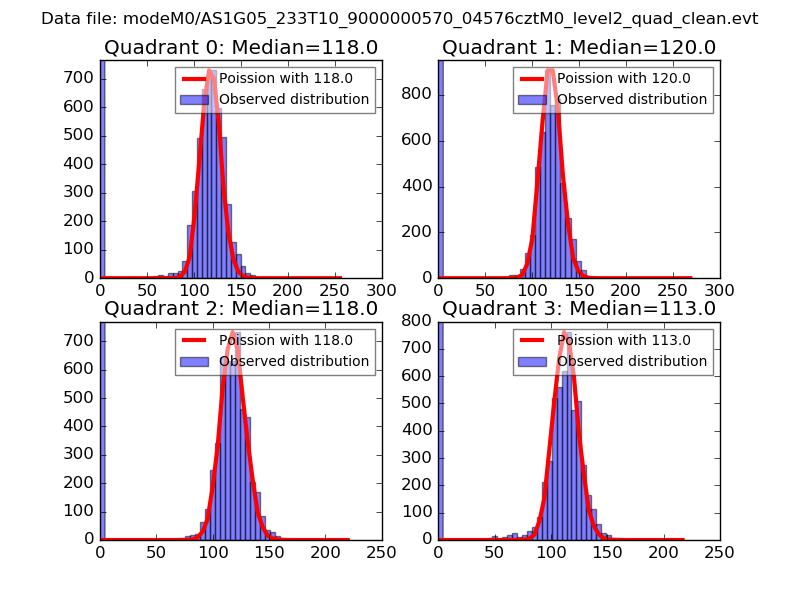 |
 |
| Quadrant-wise count rates Data is divided into 100 sec bins |
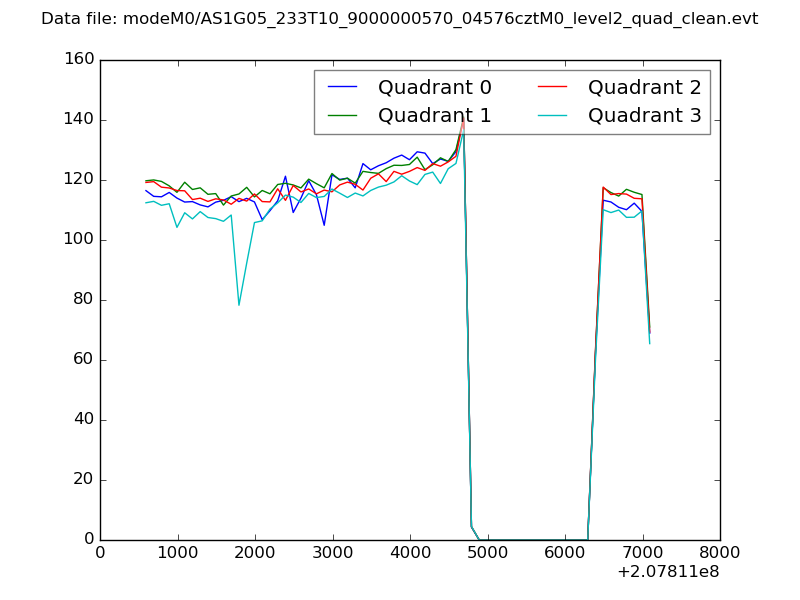 |
|
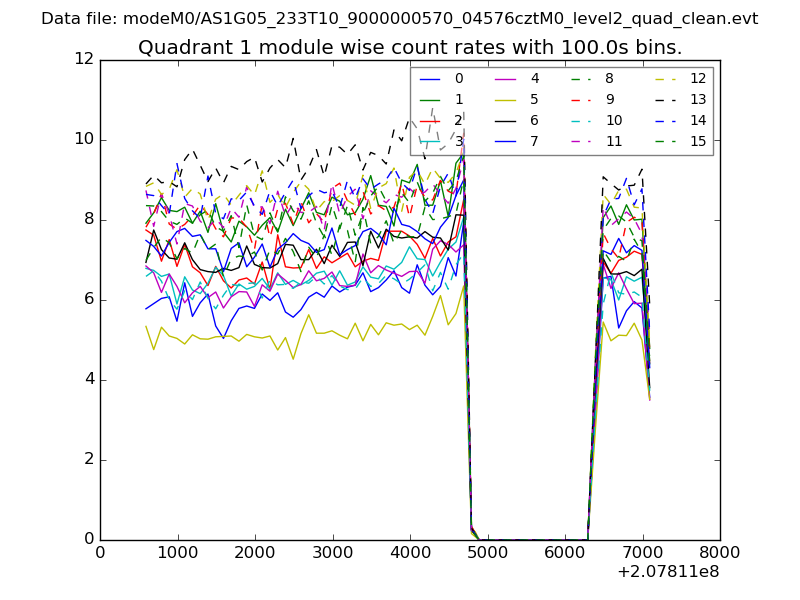
| Module-wise count rates for Quadrant A Data is divided into 100 sec bins |
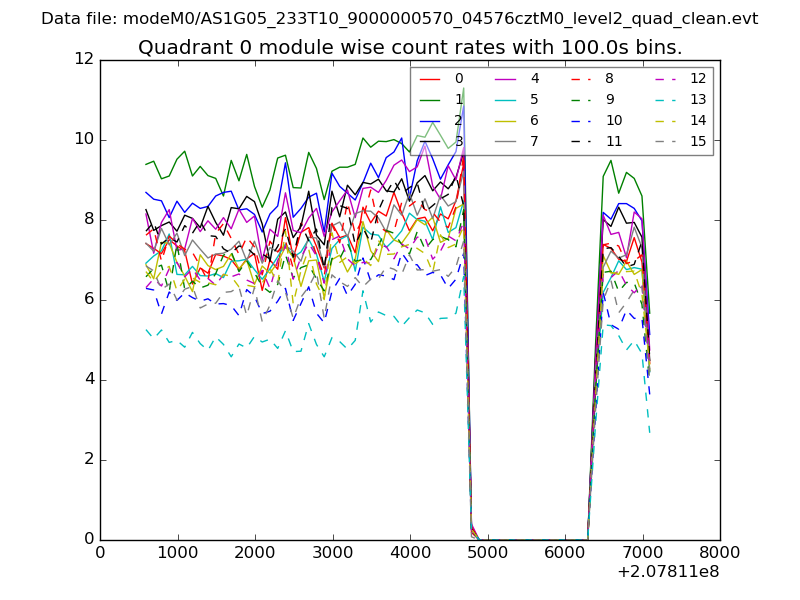 |
 |
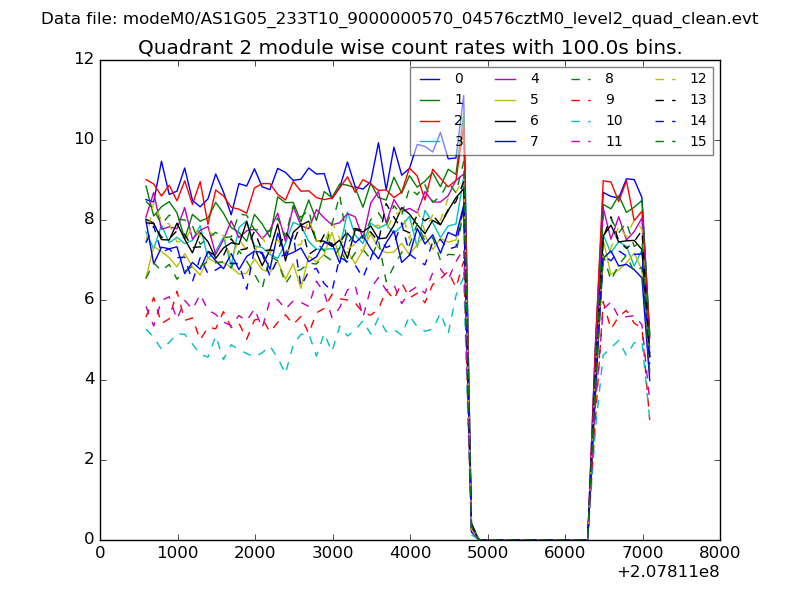
| Module-wise count rates for Quadrant B Data is divided into 100 sec bins |
 |
 |
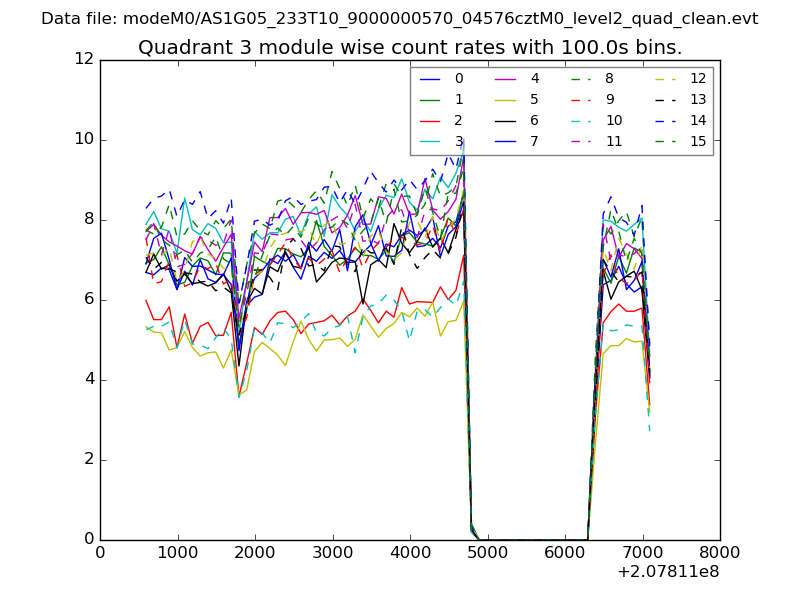
| Module-wise count rates for Quadrant C Data is divided into 100 sec bins |
 |
 |
| Module-wise count rates for Quadrant D Data is divided into 100 sec bins |
 |
 |
| Parameter | Plot |
|---|---|
| CZT HV Monitor | 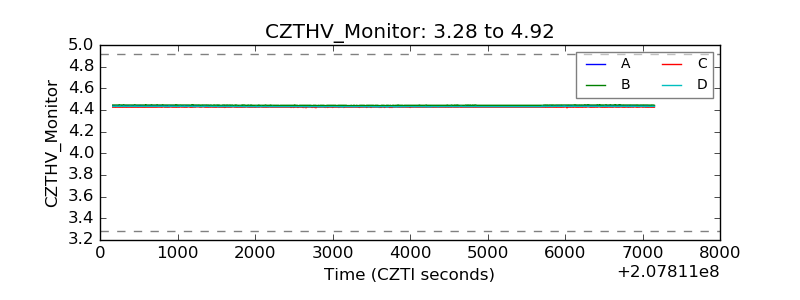 |
| D_VDD | 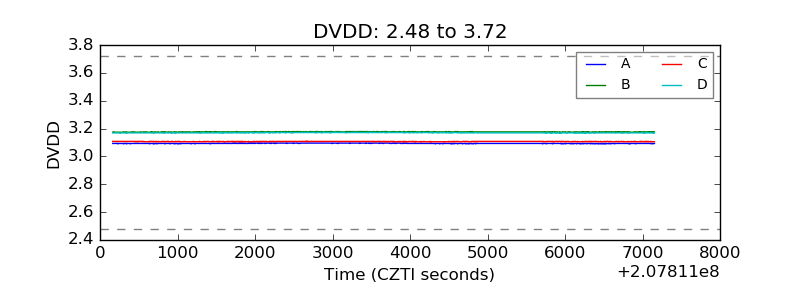 |
| Temperature 1 | 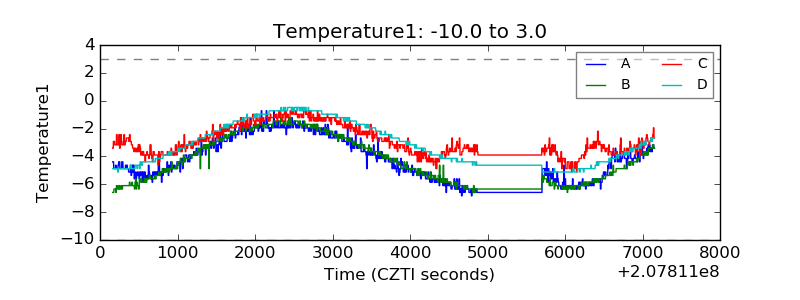 |
| Veto HV Monitor | 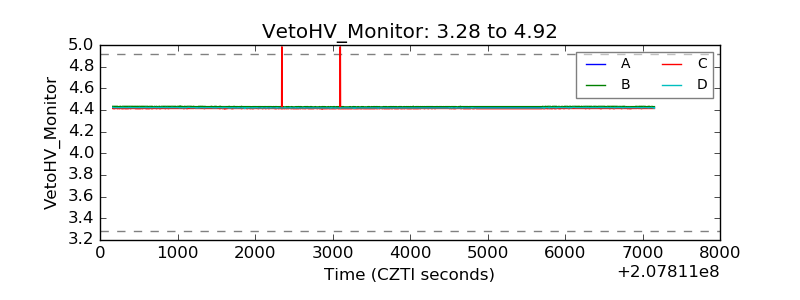 |
| Veto LLD | 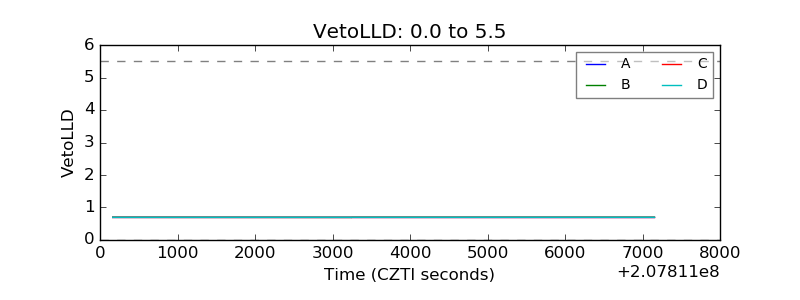 |
| Alpha Counter | 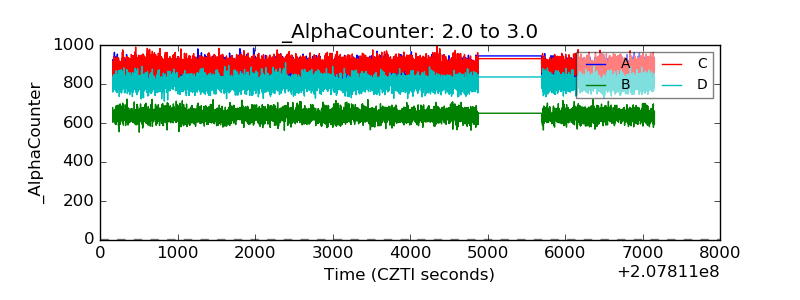 |
| _CPM_Rate | 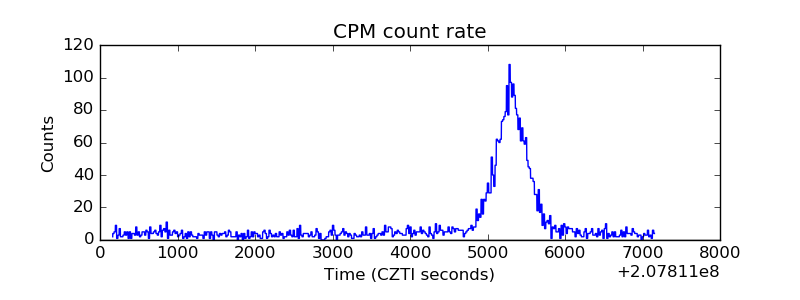 |
| CZT Counter | 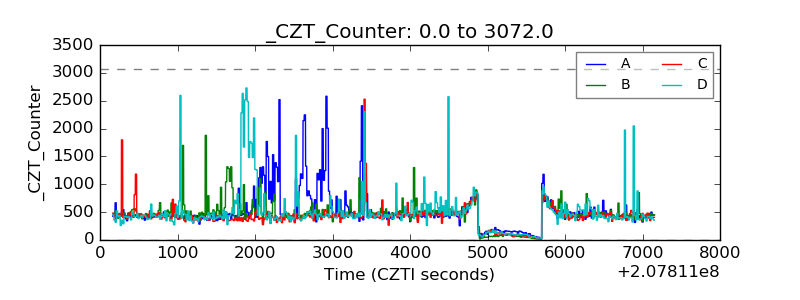 |
| +2.5 Volts monitor |  |
| +5 Volts monitor |  |
| _ROLL_ROT | 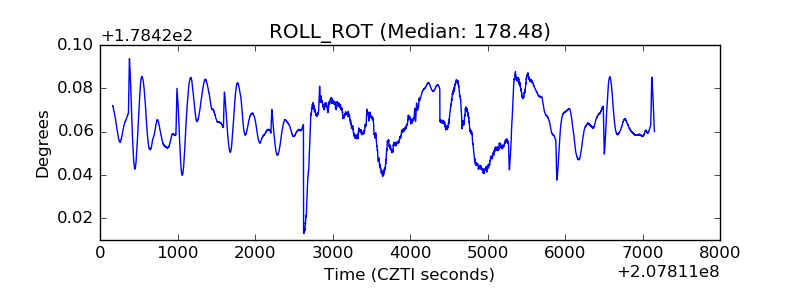 |
| _Roll_DEC | 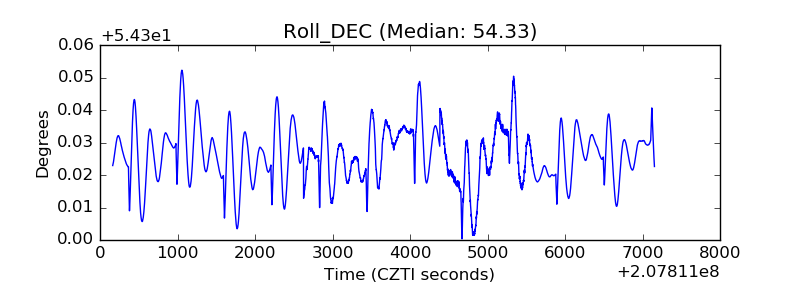 |
| _Roll_RA | 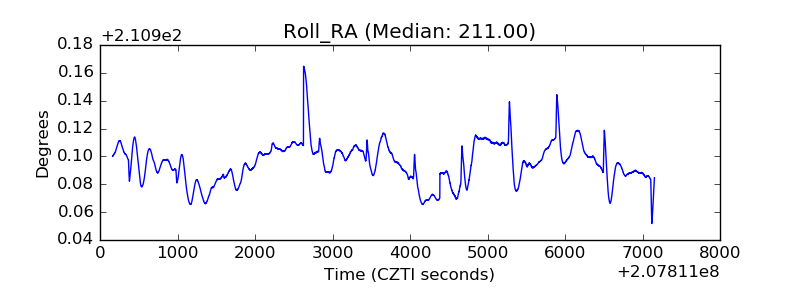 |
| Veto Counter | 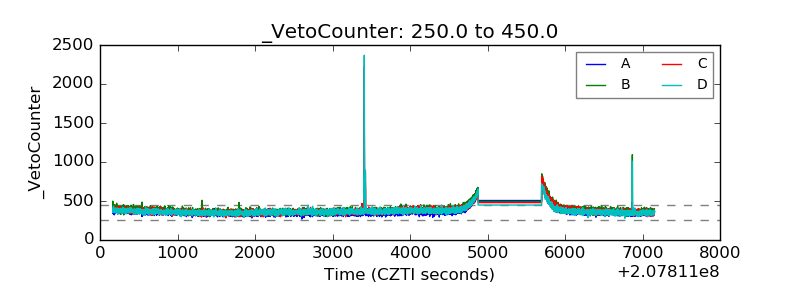 |