| Param | Original file | Final file |
|---|---|---|
| Filename | modeM0/AS1G05_233T10_9000000570_04577cztM0_level2.evt | modeM0/AS1G05_233T10_9000000570_04577cztM0_level2_quad_clean.evt |
| Size (bytes) | 484,680,960 | 87,157,440 |
| Size | 462.2 MB | 83.1 MB |
| Events in quadrant A | 3,605,421 | 544,162 |
| Events in quadrant B | 3,567,115 | 543,811 |
| Events in quadrant C | 3,124,384 | 540,112 |
| Events in quadrant D | 3,900,287 | 518,156 |
| Mode M9 | |||
|---|---|---|---|
| Quadrant | BADHDUFLAG | Total packets | Discarded packets |
| A | 0 | 4 | 0 |
| B | 0 | 4 | 0 |
| C | 0 | 4 | 0 |
| D | 0 | 4 | 0 |
| Mode M0 | |||
|---|---|---|---|
| Quadrant | BADHDUFLAG | Total packets | Discarded packets |
| A | 0 | 15760 | 2 |
| B | 0 | 15206 | 1 |
| C | 0 | 14554 | 1 |
| D | 0 | 16864 | 1 |
| Mode SS | |||
|---|---|---|---|
| Quadrant | BADHDUFLAG | Total packets | Discarded packets |
| A | 0 | 142 | 0 |
| B | 0 | 142 | 0 |
| C | 0 | 142 | 0 |
| D | 0 | 142 | 0 |
| Quadrant | Total seconds | Saturated seconds | Saturation percentage |
|---|---|---|---|
| A | 7085 | 280 | 3.952011% |
| B | 7085 | 144 | 2.032463% |
| C | 7085 | 70 | 0.988003% |
| D | 7085 | 308 | 4.347212% |
Noise dominated data is calculated using 1-second bins in cleaned event files. If a bin has >2000 counts, and if more than 50% of those come from <1% of pixels, then it is considered to be noise-dominated and hence unusable.
| Quadrant | # 1 sec bins | Bins with >0 counts | Bins with >2000 counts | High rate bins dominated by noise | Noise dominated (total time) | Noise dominated (detector-on time) | Marked lightcurve |
|---|---|---|---|---|---|---|---|
| A | 7420 | 7086 | 83 | 83 | 1.12% | 1.17% | 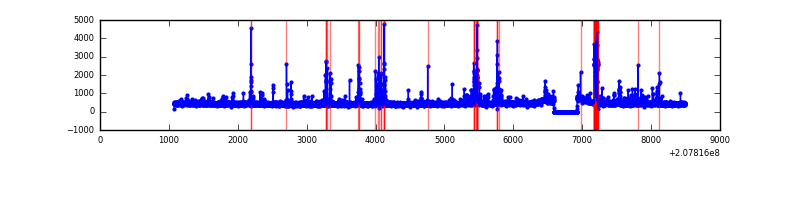 |
| B | 7420 | 7086 | 1 | 1 | 0.01% | 0.01% | 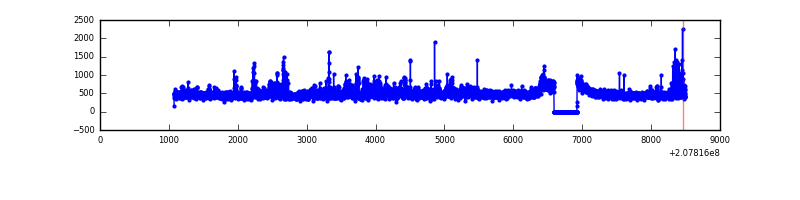 |
| C | 7420 | 7086 | 3 | 3 | 0.04% | 0.04% | 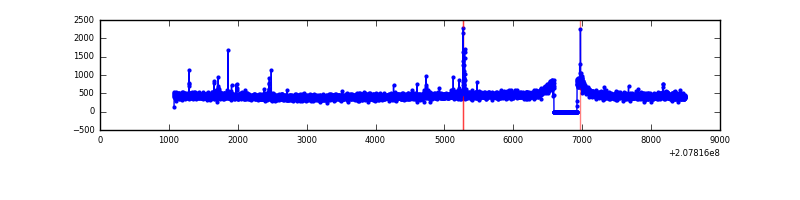 |
| D | 7420 | 7086 | 140 | 140 | 1.89% | 1.98% | 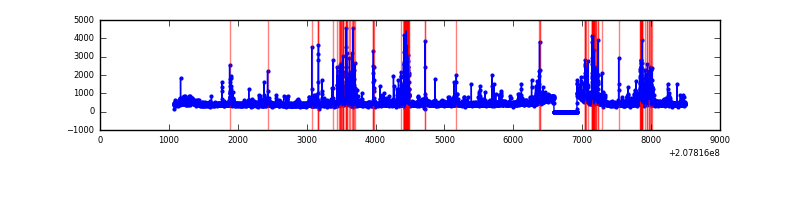 |
Top three noisy pixels from each quadrant. If the there are fewer than three noisy pixels in the level2.evt file, extra rows are filled as -1
| Pixel properties | Quadrant properties | ||||||
|---|---|---|---|---|---|---|---|
| Quadrant | DetID | PixID | Counts | Sigma | Mean | Median | Sigma |
| A | 0 | 13 | 433932 | 2622.62 | 804 | 785 | 165.2 |
| A | 0 | 50 | 70218 | 420.4 | 804 | 785 | 165.2 |
| A | 0 | 226 | 8378 | 45.97 | 804 | 785 | 165.2 |
| B | 15 | 204 | 206927 | 1316.81 | 817 | 798 | 156.5 |
| B | 4 | 48 | 66280 | 418.32 | 817 | 798 | 156.5 |
| B | 14 | 167 | 63087 | 397.92 | 817 | 798 | 156.5 |
| C | 5 | 250 | 32935 | 175.05 | 786 | 789 | 183.6 |
| C | 9 | 16 | 8078 | 39.69 | 786 | 789 | 183.6 |
| C | 9 | 247 | 7107 | 34.4 | 786 | 789 | 183.6 |
| D | 10 | 15 | 315677 | 1699.6 | 775 | 751 | 185.3 |
| D | 13 | 239 | 165932 | 891.45 | 775 | 751 | 185.3 |
| D | 2 | 136 | 150826 | 809.93 | 775 | 751 | 185.3 |
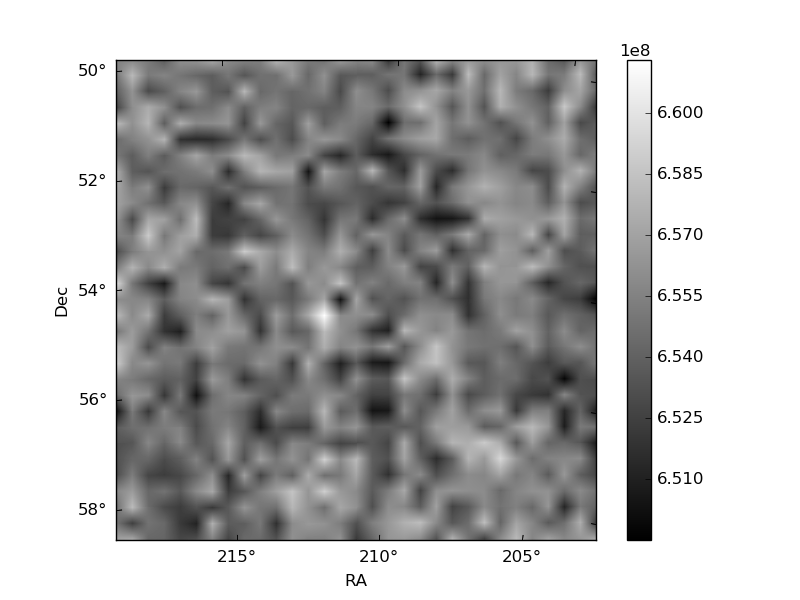
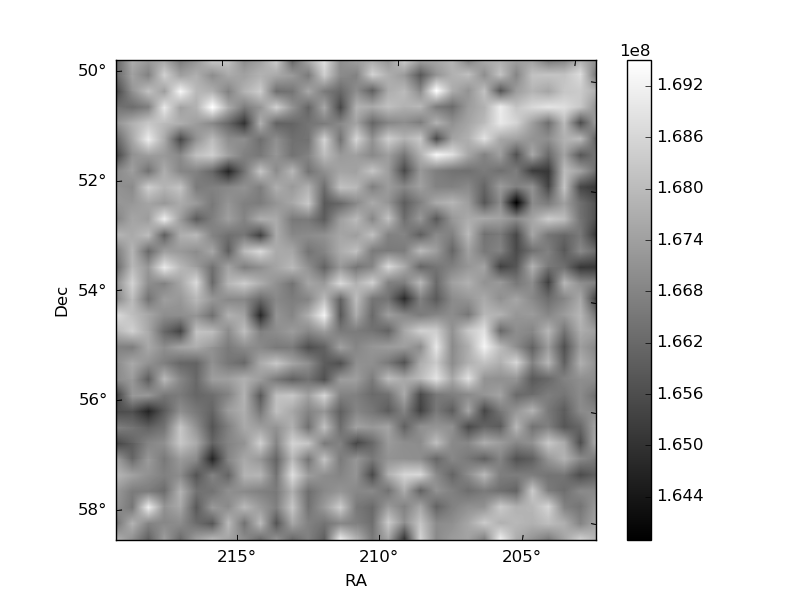
Histogram calculated using DETX and DETY for each event in the final _common_clean file
| Quadrant A | 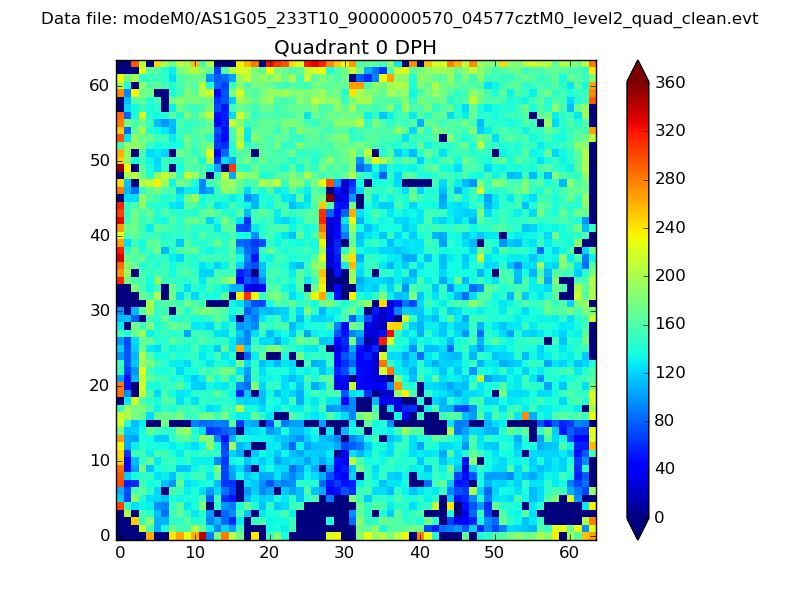 |
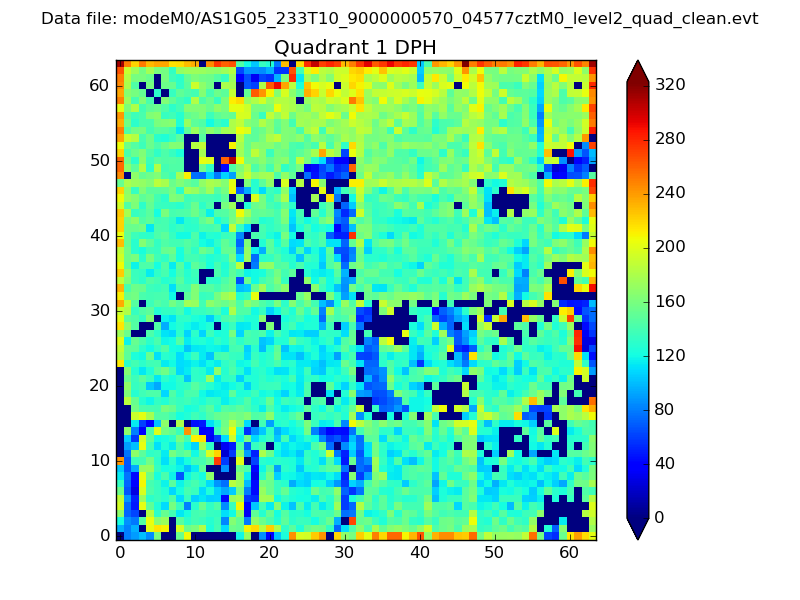 |
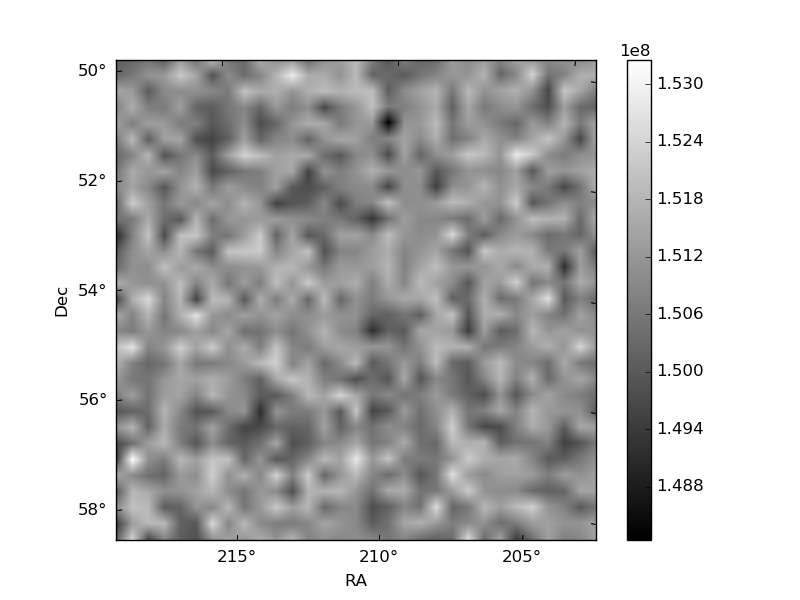
Quadrant B |
|---|---|---|---|
| Quadrant D | 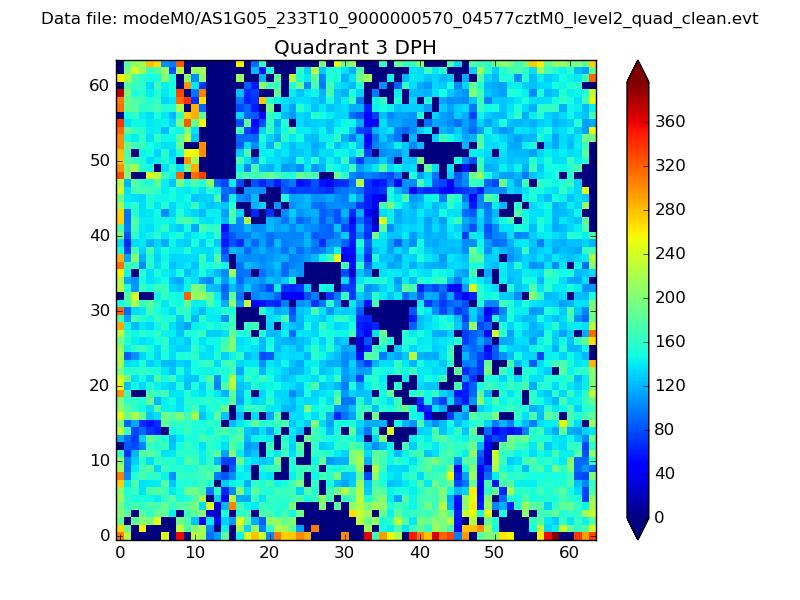 |
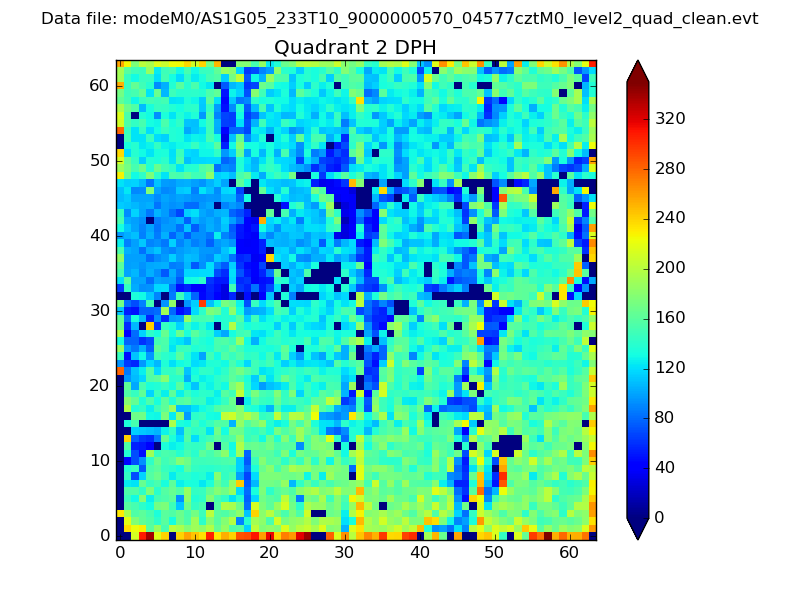 |
Quadrant C |
| Plot type | Count rate plots | Images |
|---|---|---|
| Comparison with Poisson distribution Blue bars denote a histogram of data divided into 1 sec bins. Red curve is a Poisson curve with rate = median count rate of data. |
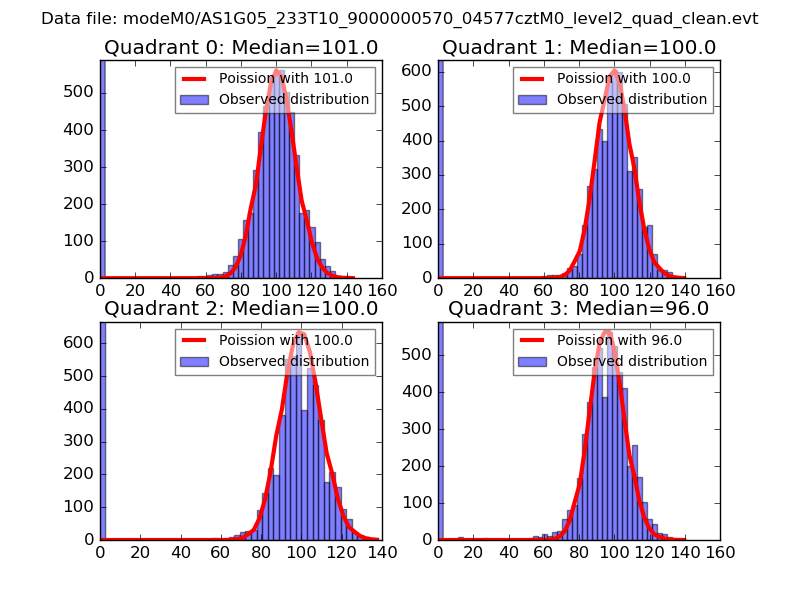 |
 |
| Quadrant-wise count rates Data is divided into 100 sec bins |
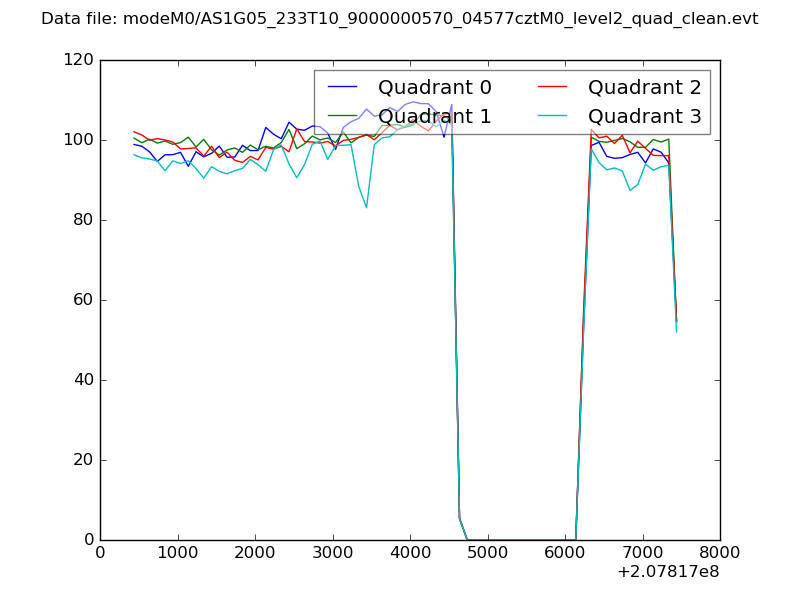 |
|
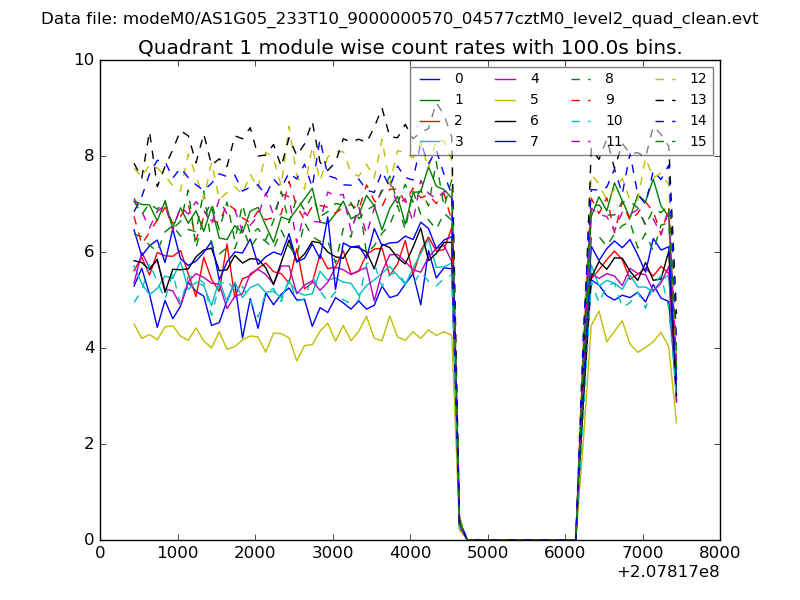
| Module-wise count rates for Quadrant A Data is divided into 100 sec bins |
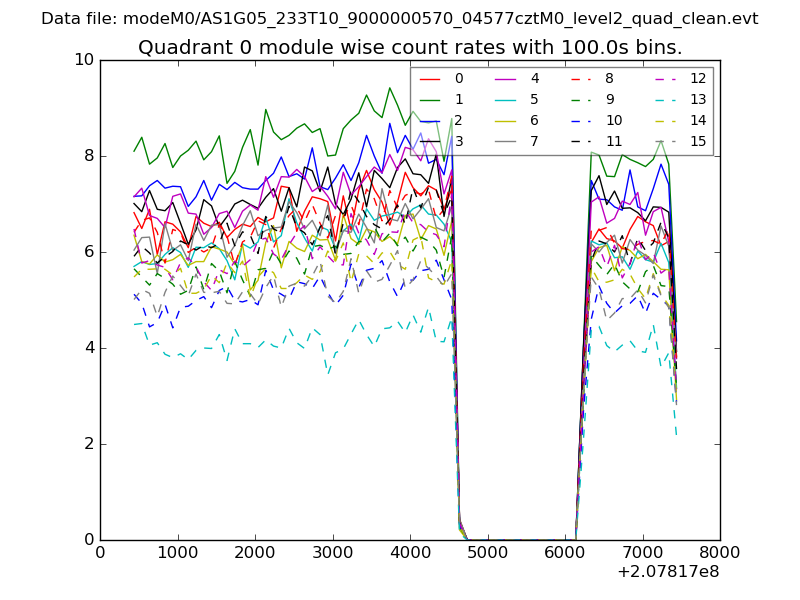 |
 |
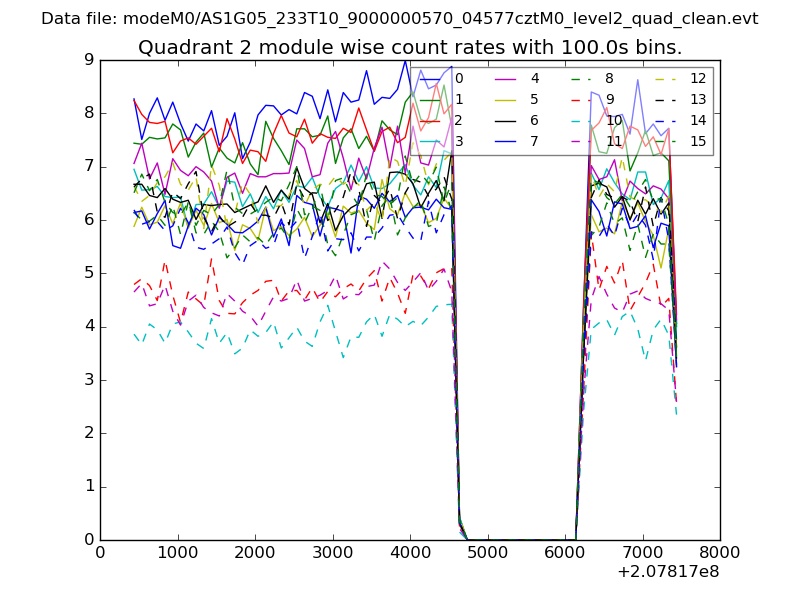
| Module-wise count rates for Quadrant B Data is divided into 100 sec bins |
 |
 |
| Module-wise count rates for Quadrant C Data is divided into 100 sec bins |
 |
 |
| Module-wise count rates for Quadrant D Data is divided into 100 sec bins |
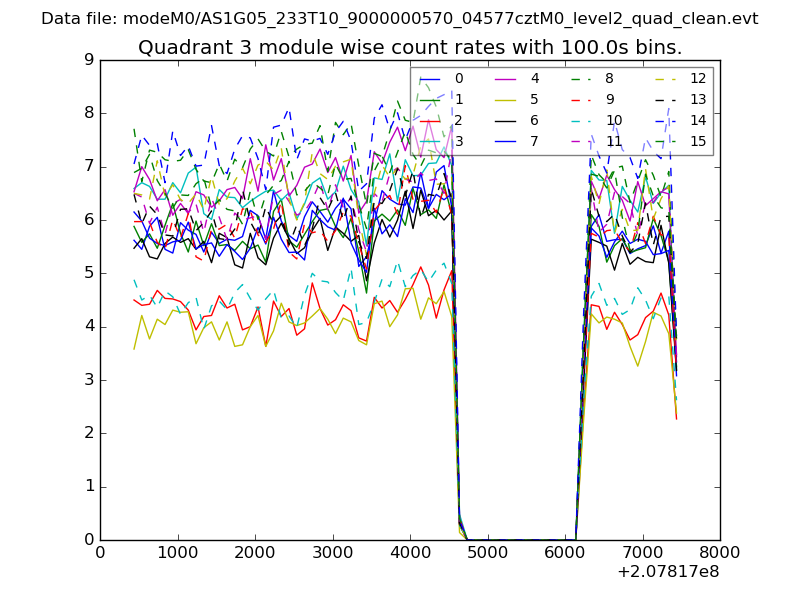 |
 |
| Parameter | Plot |
|---|---|
| CZT HV Monitor | 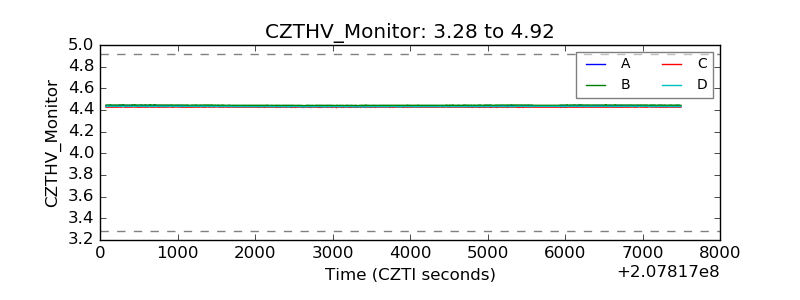 |
| D_VDD | 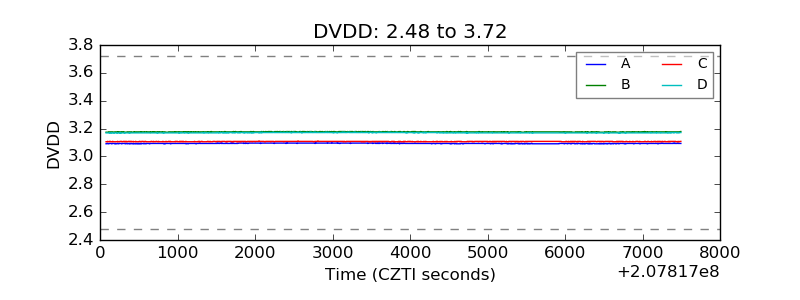 |
| Temperature 1 | 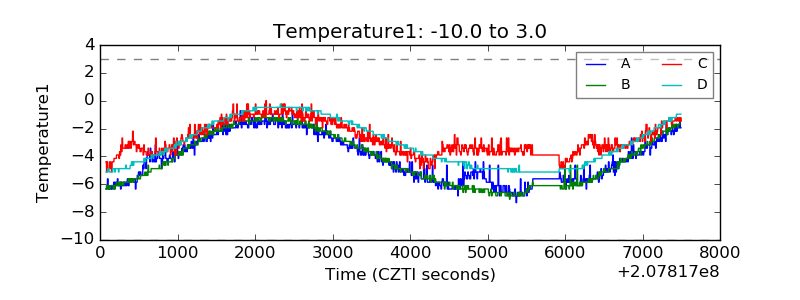 |
| Veto HV Monitor | 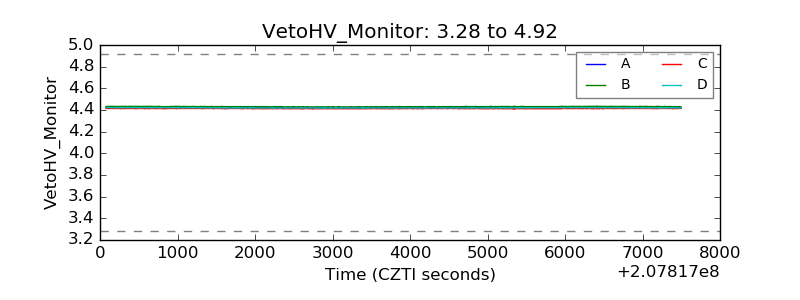 |
| Veto LLD | 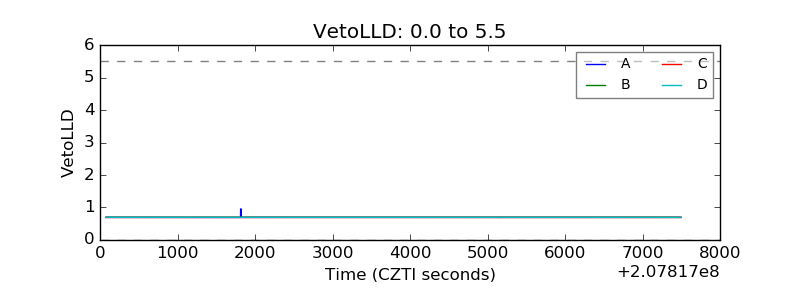 |
| Alpha Counter | 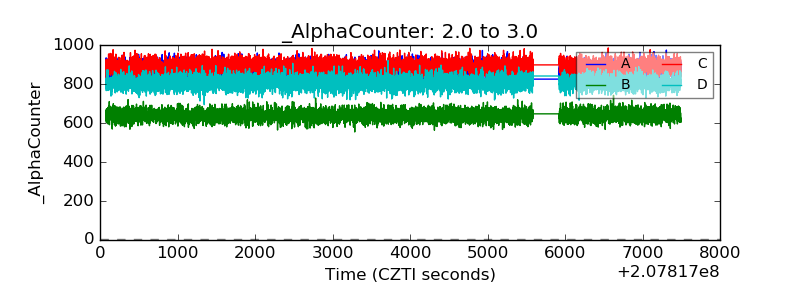 |
| _CPM_Rate | 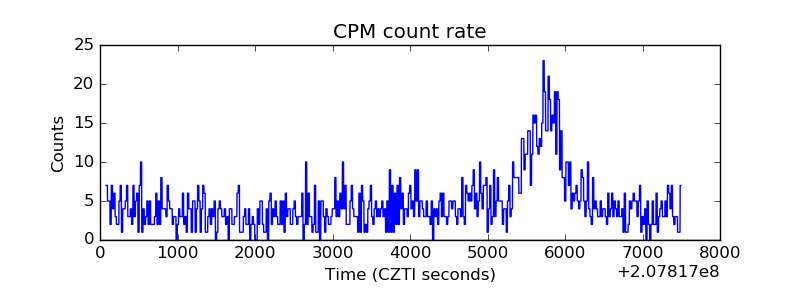 |
| CZT Counter | 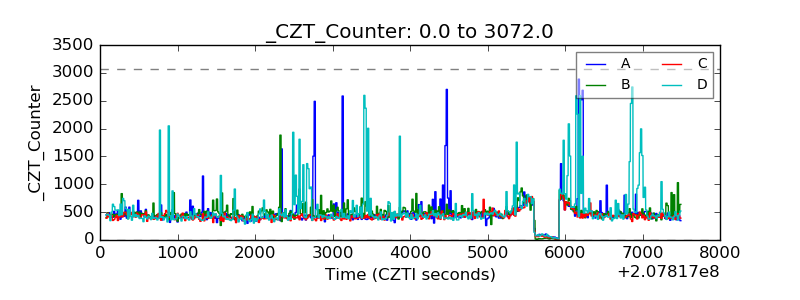 |
| +2.5 Volts monitor |  |
| +5 Volts monitor |  |
| _ROLL_ROT | 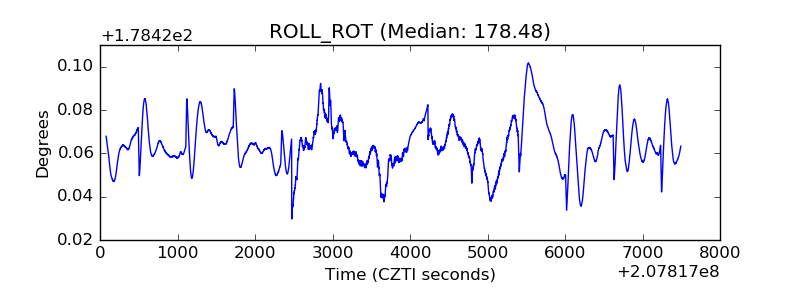 |
| _Roll_DEC | 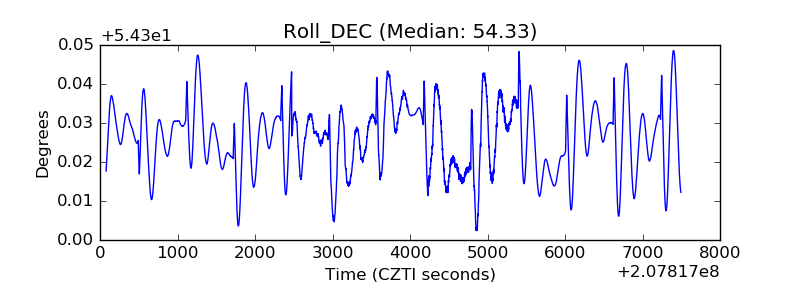 |
| _Roll_RA | 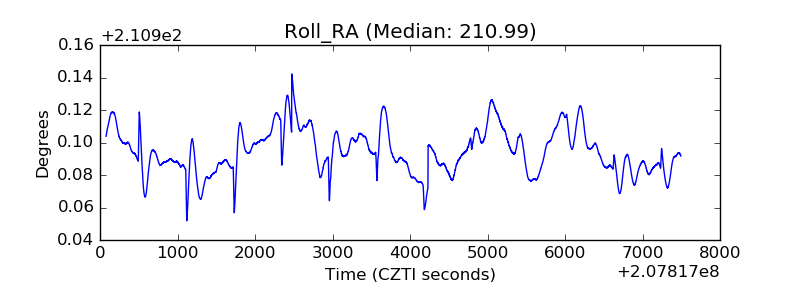 |
| Veto Counter | 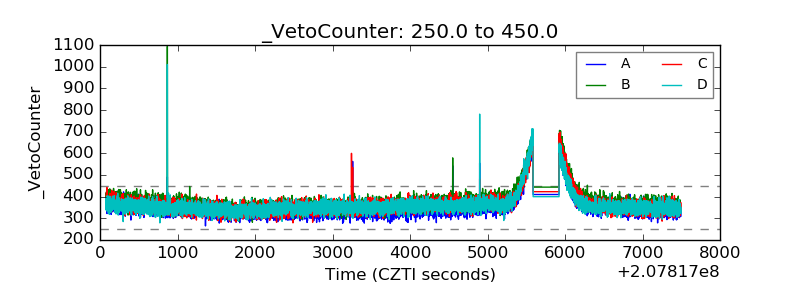 |