| Param | Original file | Final file |
|---|---|---|
| Filename | modeM0/AS1G05_233T10_9000000570_04578cztM0_level2.evt | modeM0/AS1G05_233T10_9000000570_04578cztM0_level2_quad_clean.evt |
| Size (bytes) | 479,352,960 | 86,022,720 |
| Size | 457.1 MB | 82.0 MB |
| Events in quadrant A | 3,491,369 | 540,481 |
| Events in quadrant B | 3,769,517 | 533,900 |
| Events in quadrant C | 3,109,259 | 530,873 |
| Events in quadrant D | 3,672,484 | 513,103 |
| Mode M0 | |||
|---|---|---|---|
| Quadrant | BADHDUFLAG | Total packets | Discarded packets |
| A | 0 | 15683 | 404 |
| B | 0 | 16177 | 524 |
| C | 0 | 14879 | 418 |
| D | 0 | 16297 | 445 |
| Mode SS | |||
|---|---|---|---|
| Quadrant | BADHDUFLAG | Total packets | Discarded packets |
| A | 0 | 142 | 4 |
| B | 0 | 142 | 6 |
| C | 0 | 142 | 0 |
| D | 0 | 142 | 0 |
| Quadrant | Total seconds | Saturated seconds | Saturation percentage |
|---|---|---|---|
| A | 6998 | 199 | 2.843670% |
| B | 6970 | 158 | 2.266858% |
| C | 6987 | 61 | 0.873050% |
| D | 6979 | 148 | 2.120648% |
Noise dominated data is calculated using 1-second bins in cleaned event files. If a bin has >2000 counts, and if more than 50% of those come from <1% of pixels, then it is considered to be noise-dominated and hence unusable.
| Quadrant | # 1 sec bins | Bins with >0 counts | Bins with >2000 counts | High rate bins dominated by noise | Noise dominated (total time) | Noise dominated (detector-on time) | Marked lightcurve |
|---|---|---|---|---|---|---|---|
| A | 7160 | 7093 | 43 | 43 | 0.60% | 0.61% | 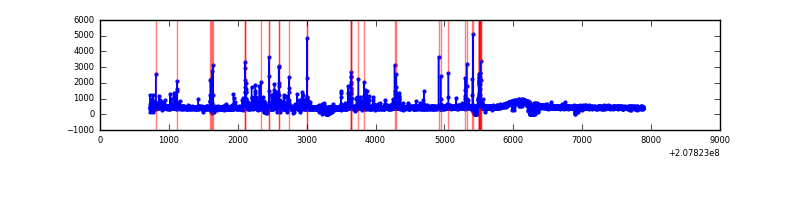 |
| B | 7160 | 7068 | 24 | 24 | 0.34% | 0.34% | 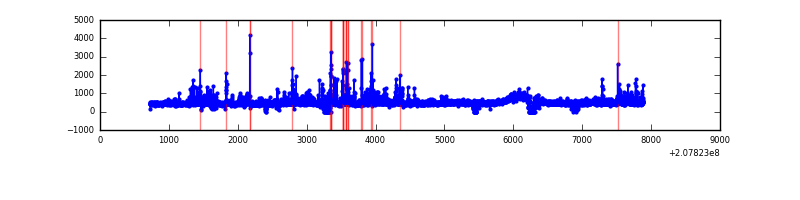 |
| C | 7160 | 7074 | 0 | 0 | 0.00% | 0.00% | 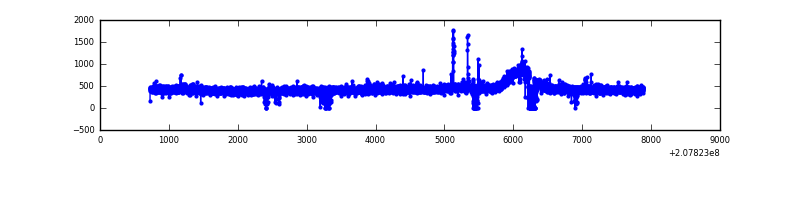 |
| D | 7160 | 7068 | 49 | 49 | 0.68% | 0.69% | 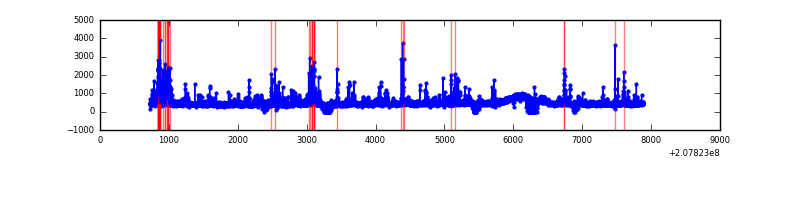 |
Top three noisy pixels from each quadrant. If the there are fewer than three noisy pixels in the level2.evt file, extra rows are filled as -1
| Pixel properties | Quadrant properties | ||||||
|---|---|---|---|---|---|---|---|
| Quadrant | DetID | PixID | Counts | Sigma | Mean | Median | Sigma |
| A | 0 | 13 | 352789 | 2105.14 | 811 | 789 | 167.2 |
| A | 0 | 50 | 12378 | 69.31 | 811 | 789 | 167.2 |
| A | 12 | 194 | 8509 | 46.17 | 811 | 789 | 167.2 |
| B | 14 | 167 | 305920 | 1953.42 | 810 | 789 | 156.2 |
| B | 15 | 204 | 83157 | 527.31 | 810 | 789 | 156.2 |
| B | 10 | 16 | 64256 | 406.31 | 810 | 789 | 156.2 |
| C | 5 | 250 | 28151 | 148.85 | 784 | 787 | 183.8 |
| C | 9 | 54 | 9212 | 45.83 | 784 | 787 | 183.8 |
| C | 13 | 61 | 6488 | 31.01 | 784 | 787 | 183.8 |
| D | 13 | 239 | 215449 | 1118.2 | 787 | 761 | 192.0 |
| D | 2 | 136 | 192815 | 1000.31 | 787 | 761 | 192.0 |
| D | 13 | 235 | 97176 | 502.17 | 787 | 761 | 192.0 |
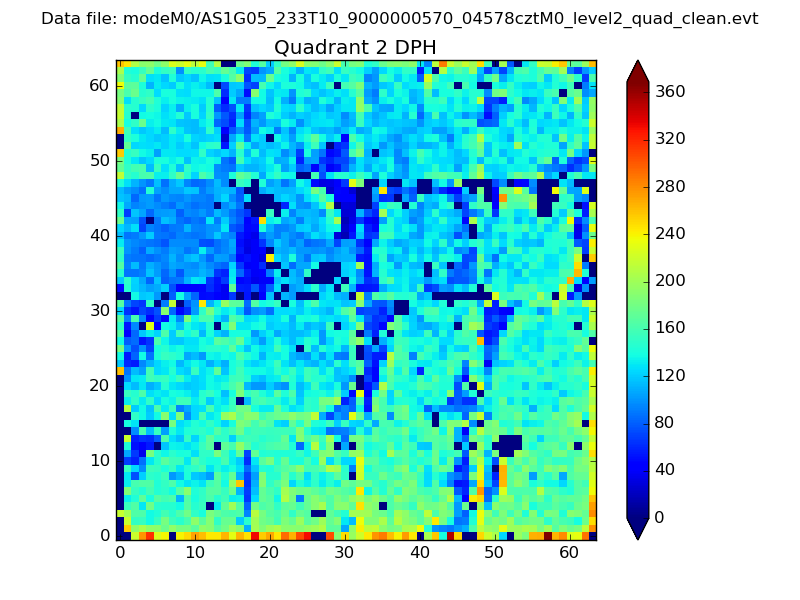
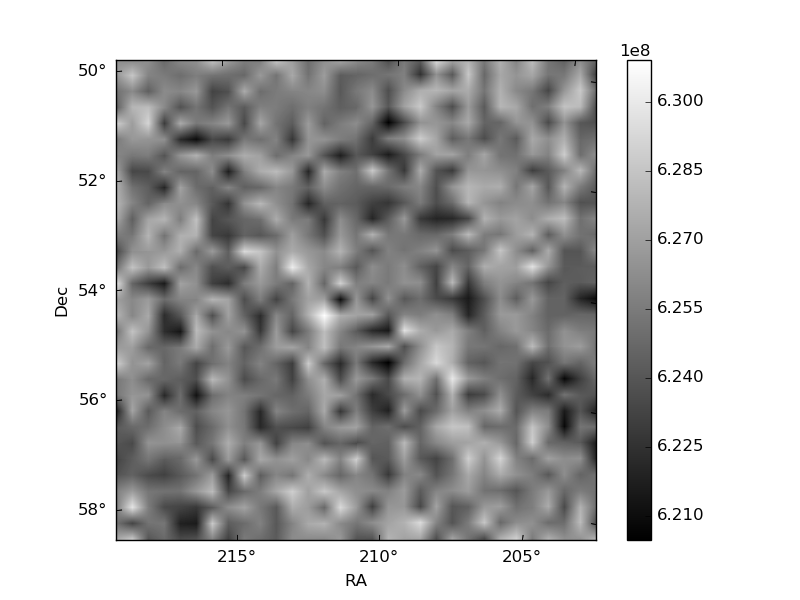
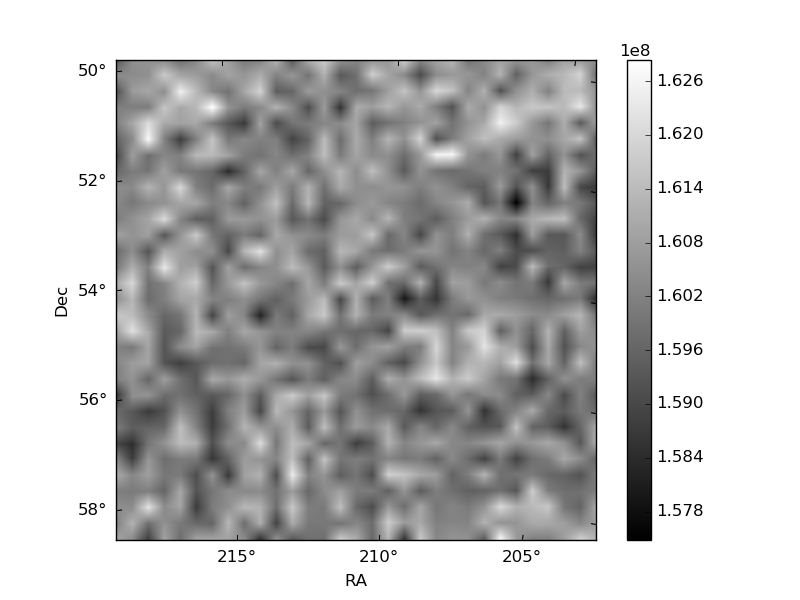
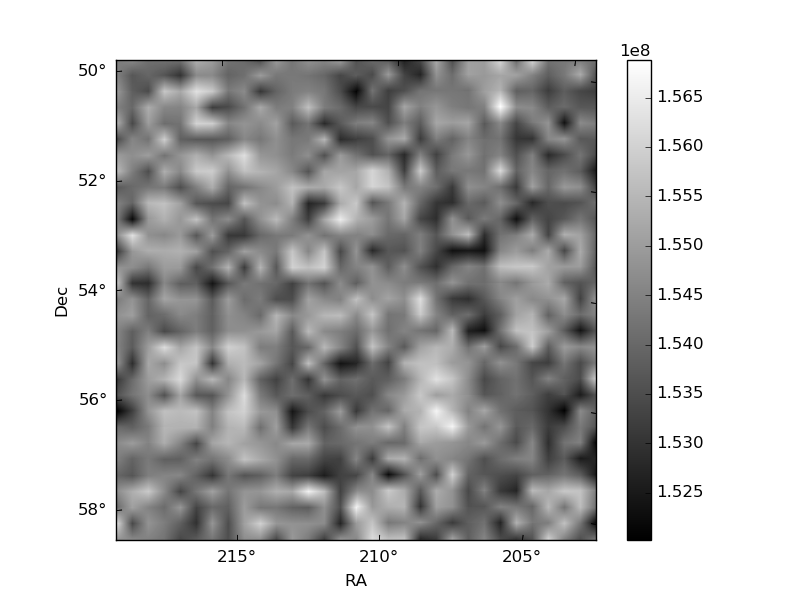
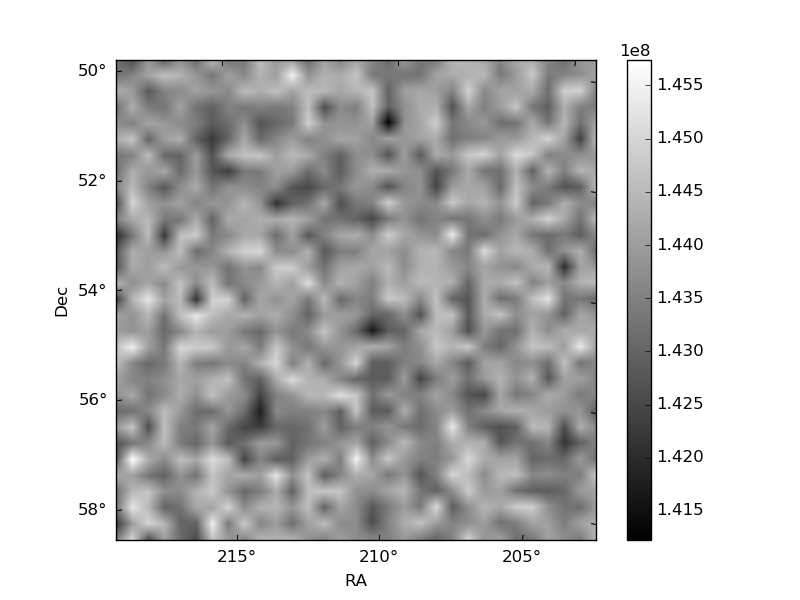
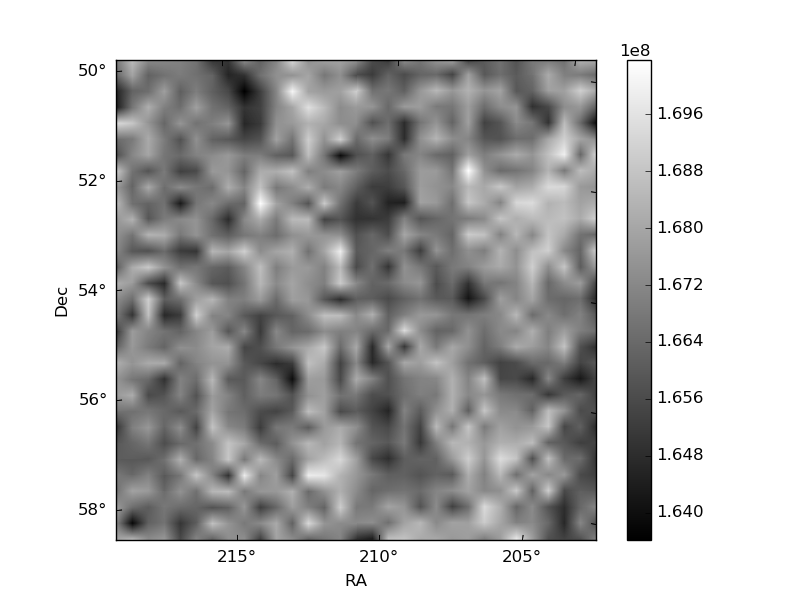
Histogram calculated using DETX and DETY for each event in the final _common_clean file
| Quadrant A | 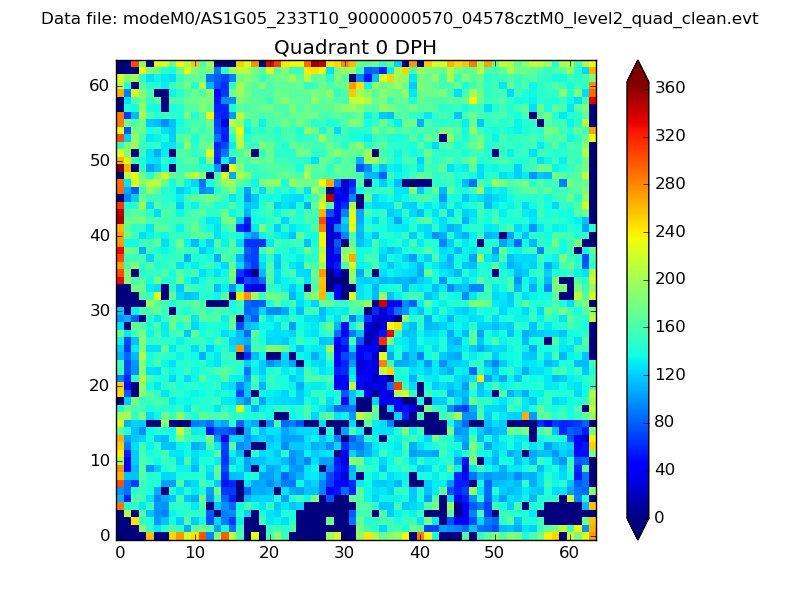 |
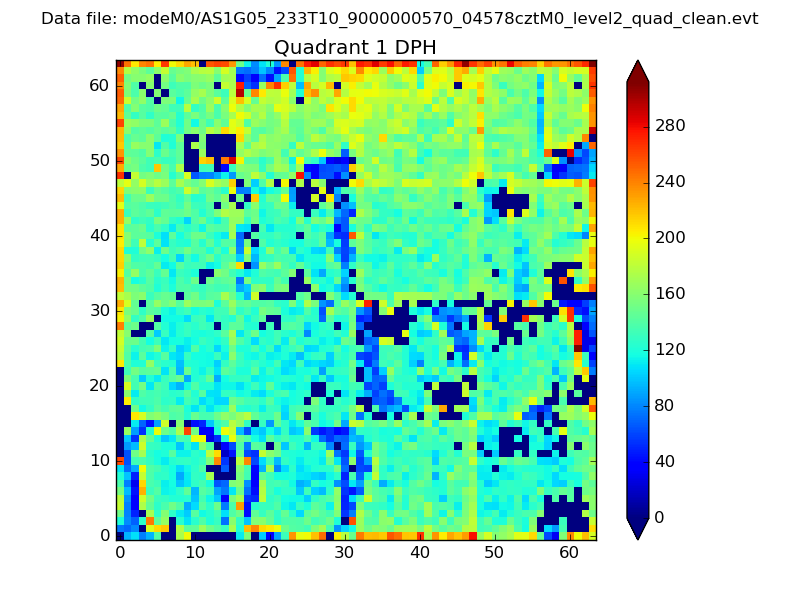 |
Quadrant B |
|---|---|---|---|
| Quadrant D | 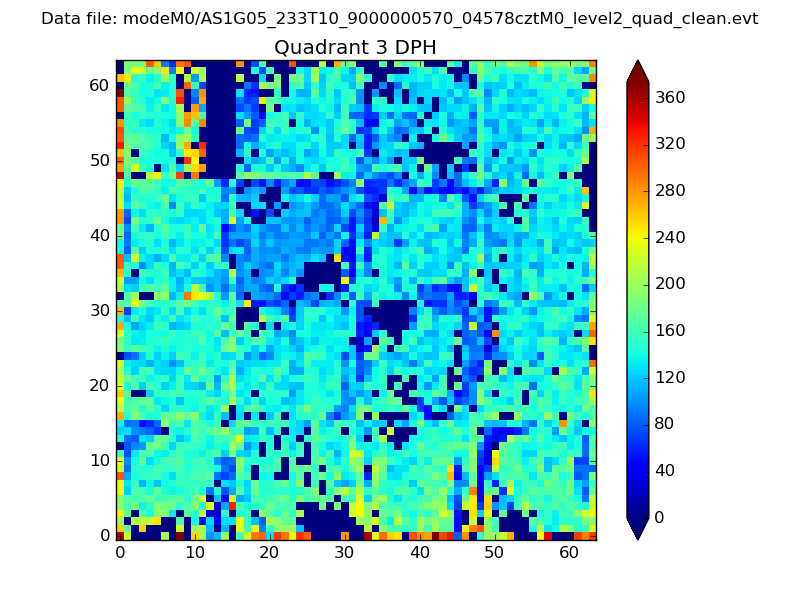 |
 |
Quadrant C |
| Plot type | Count rate plots | Images |
|---|---|---|
| Comparison with Poisson distribution Blue bars denote a histogram of data divided into 1 sec bins. Red curve is a Poisson curve with rate = median count rate of data. |
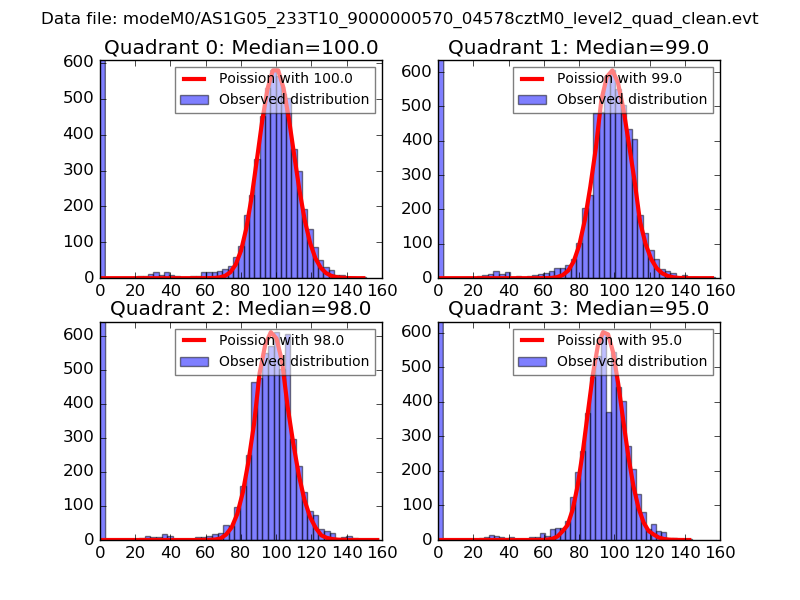 |
 |
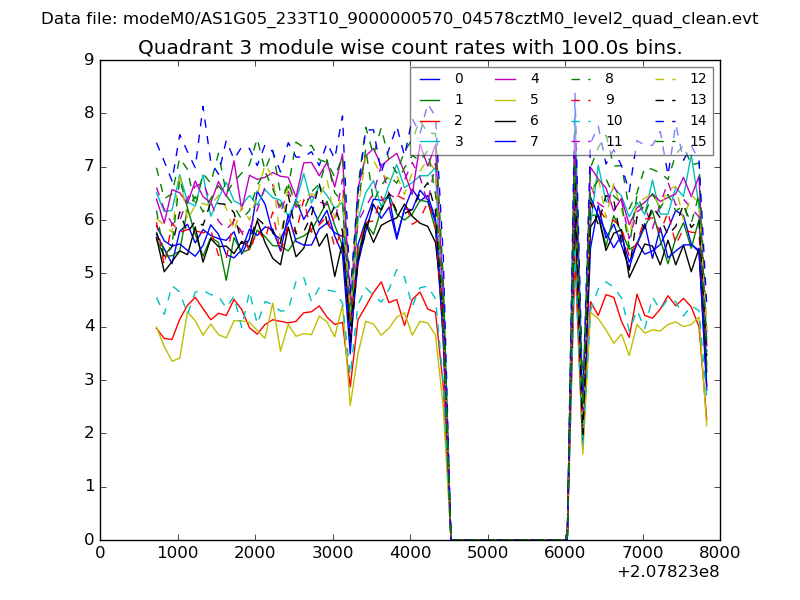
| Quadrant-wise count rates Data is divided into 100 sec bins |
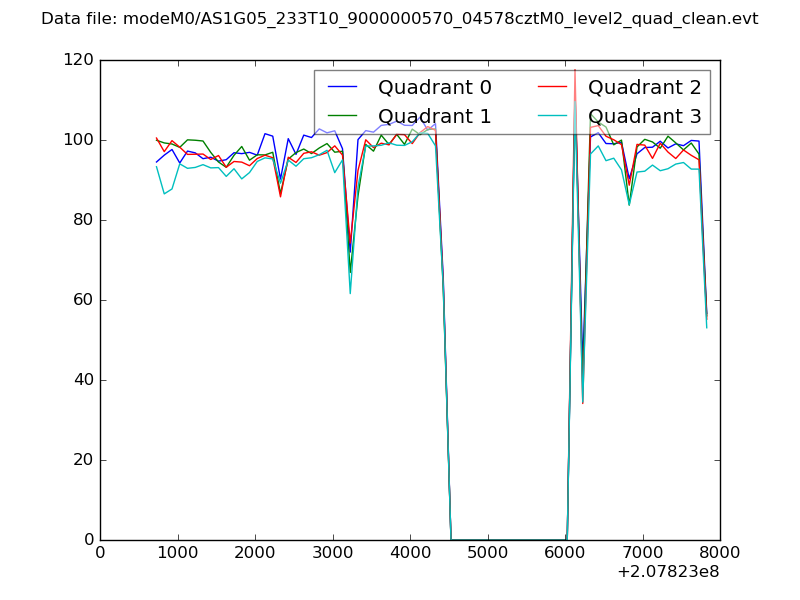 |
|
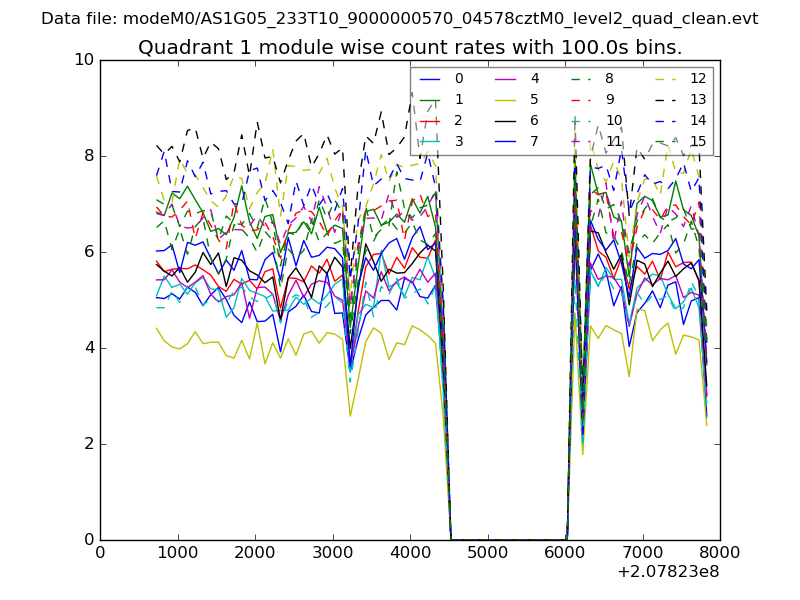
| Module-wise count rates for Quadrant A Data is divided into 100 sec bins |
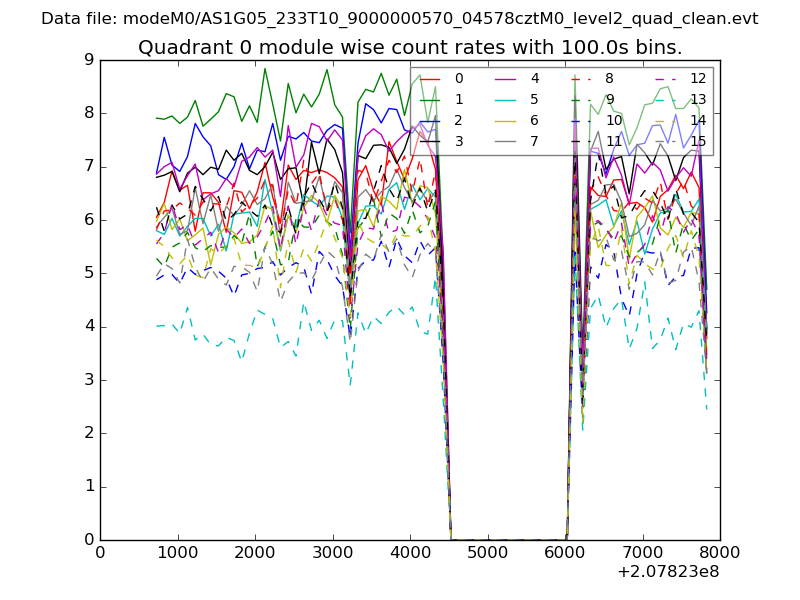 |
 |
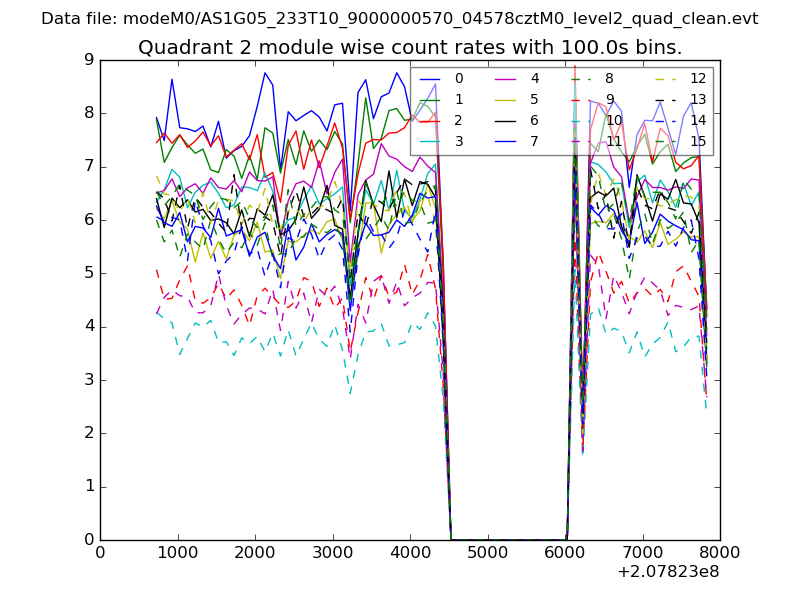
| Module-wise count rates for Quadrant B Data is divided into 100 sec bins |
 |
 |
| Module-wise count rates for Quadrant C Data is divided into 100 sec bins |
 |
 |
| Module-wise count rates for Quadrant D Data is divided into 100 sec bins |
 |
 |
| Parameter | Plot |
|---|---|
| CZT HV Monitor | 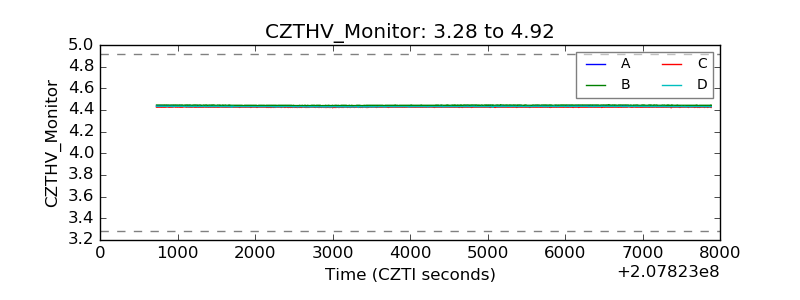 |
| D_VDD | 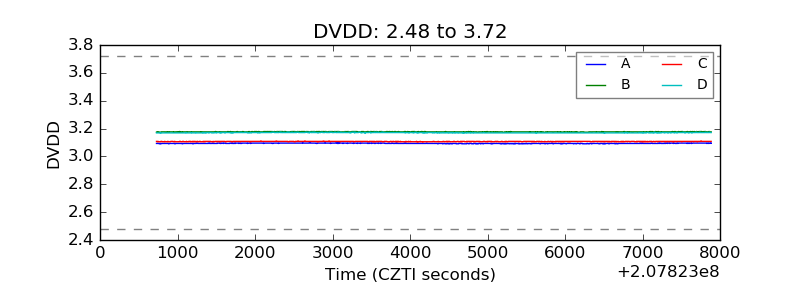 |
| Temperature 1 | 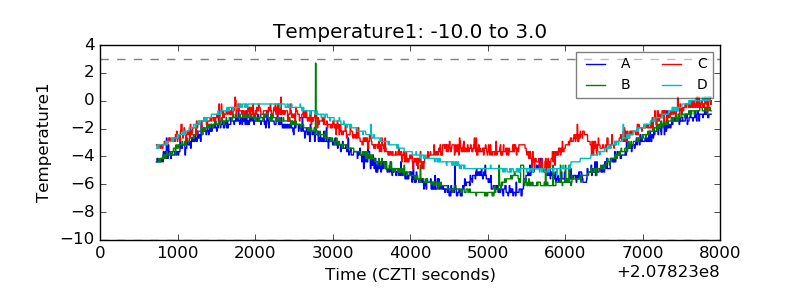 |
| Veto HV Monitor | 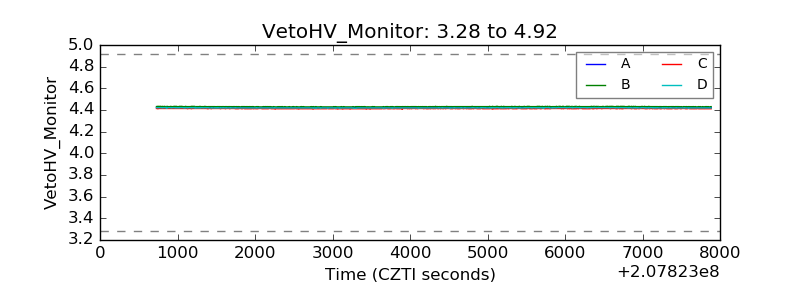 |
| Veto LLD | 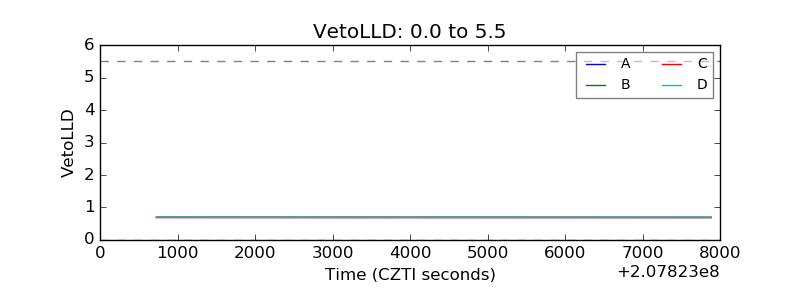 |
| Alpha Counter | 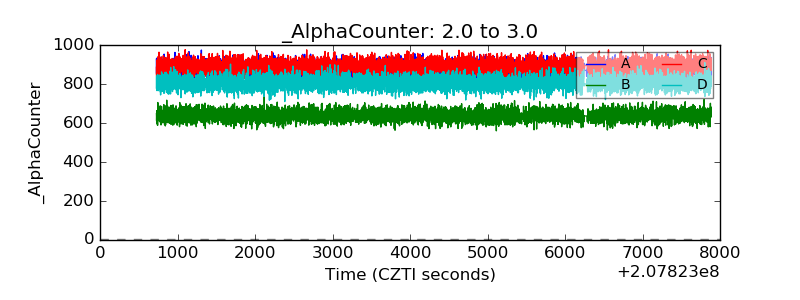 |
| _CPM_Rate | 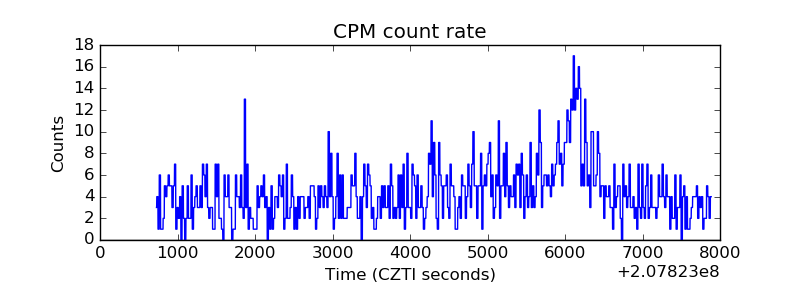 |
| CZT Counter | 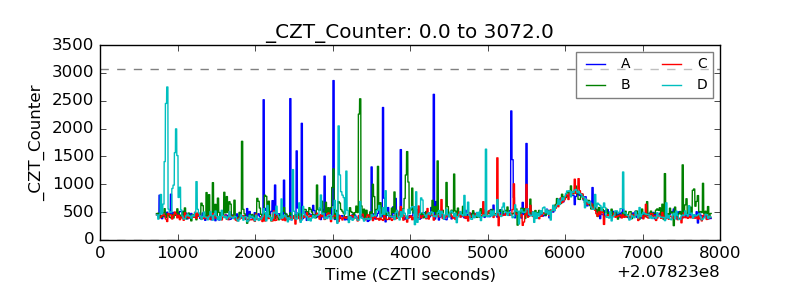 |
| +2.5 Volts monitor | 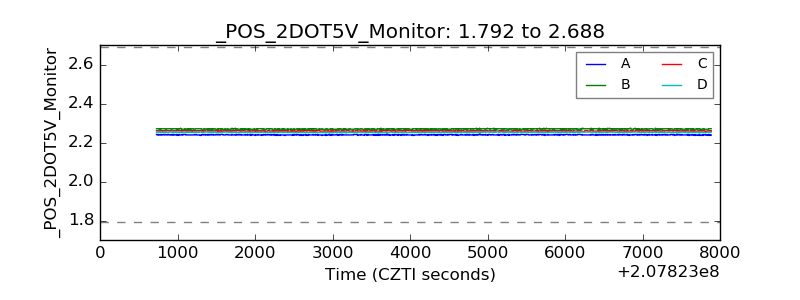 |
| +5 Volts monitor | 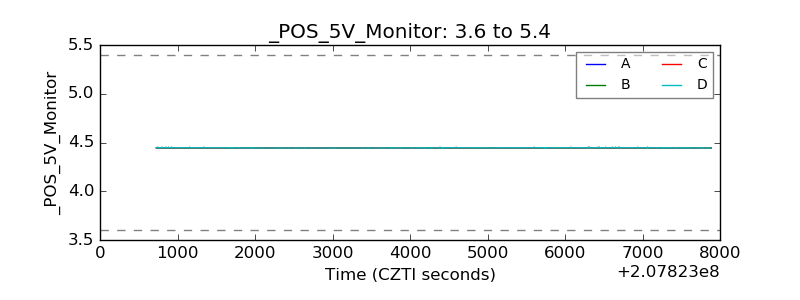 |
| _ROLL_ROT | 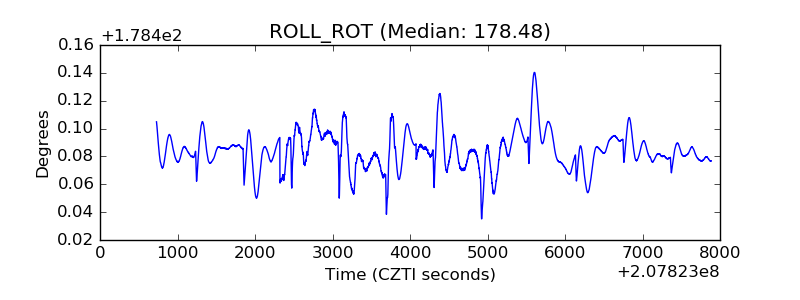 |
| _Roll_DEC | 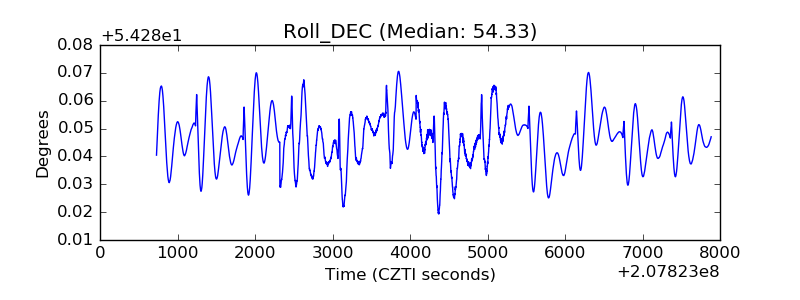 |
| _Roll_RA | 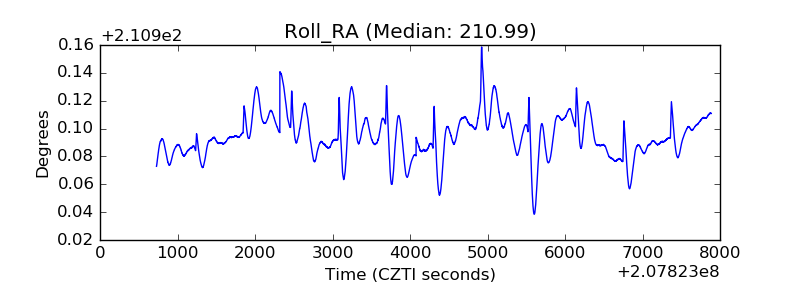 |
| Veto Counter | 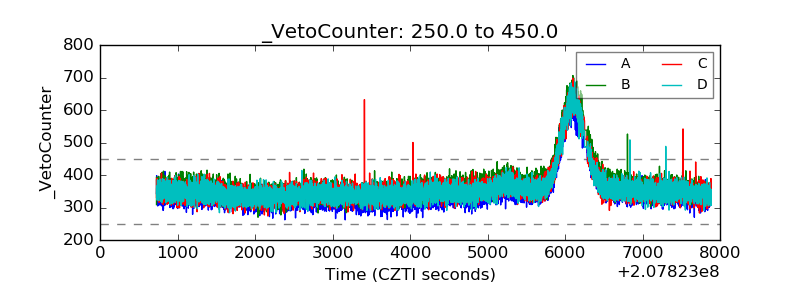 |