| Param | Original file | Final file |
|---|---|---|
| Filename | modeM0/AS1G05_233T10_9000000570_04579cztM0_level2.evt | modeM0/AS1G05_233T10_9000000570_04579cztM0_level2_quad_clean.evt |
| Size (bytes) | 486,921,600 | 92,940,480 |
| Size | 464.4 MB | 88.6 MB |
| Events in quadrant A | 3,369,602 | 586,652 |
| Events in quadrant B | 3,900,233 | 579,190 |
| Events in quadrant C | 3,295,925 | 574,664 |
| Events in quadrant D | 3,675,675 | 556,938 |
| Mode M9 | |||
|---|---|---|---|
| Quadrant | BADHDUFLAG | Total packets | Discarded packets |
| A | 0 | 2 | 0 |
| B | 0 | 2 | 0 |
| C | 0 | 2 | 0 |
| D | 0 | 2 | 0 |
| Mode M0 | |||
|---|---|---|---|
| Quadrant | BADHDUFLAG | Total packets | Discarded packets |
| A | 0 | 15389 | 70 |
| B | 0 | 16526 | 82 |
| C | 0 | 15353 | 63 |
| D | 0 | 16346 | 76 |
| Mode SS | |||
|---|---|---|---|
| Quadrant | BADHDUFLAG | Total packets | Discarded packets |
| A | 0 | 150 | 2 |
| B | 0 | 150 | 0 |
| C | 0 | 150 | 0 |
| D | 0 | 150 | 4 |
| Quadrant | Total seconds | Saturated seconds | Saturation percentage |
|---|---|---|---|
| A | 7433 | 123 | 1.654783% |
| B | 7428 | 124 | 1.669359% |
| C | 7437 | 71 | 0.954686% |
| D | 7435 | 122 | 1.640888% |
Noise dominated data is calculated using 1-second bins in cleaned event files. If a bin has >2000 counts, and if more than 50% of those come from <1% of pixels, then it is considered to be noise-dominated and hence unusable.
| Quadrant | # 1 sec bins | Bins with >0 counts | Bins with >2000 counts | High rate bins dominated by noise | Noise dominated (total time) | Noise dominated (detector-on time) | Marked lightcurve |
|---|---|---|---|---|---|---|---|
| A | 7671 | 7467 | 5 | 5 | 0.07% | 0.07% | 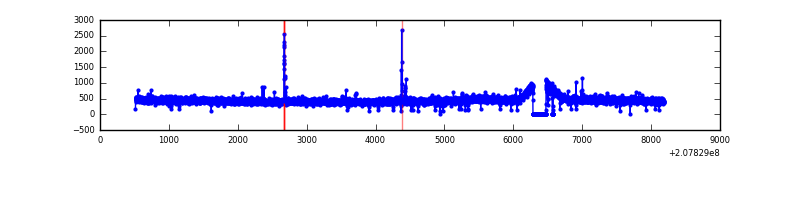 |
| B | 7671 | 7465 | 5 | 5 | 0.07% | 0.07% | 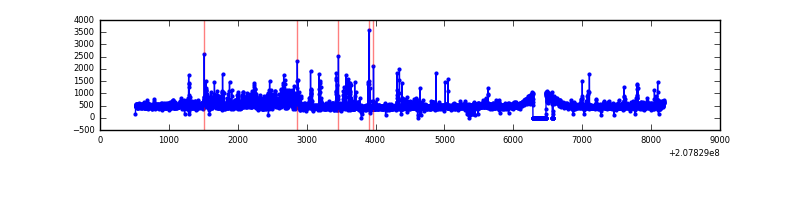 |
| C | 7671 | 7468 | 0 | 0 | 0.00% | 0.00% | 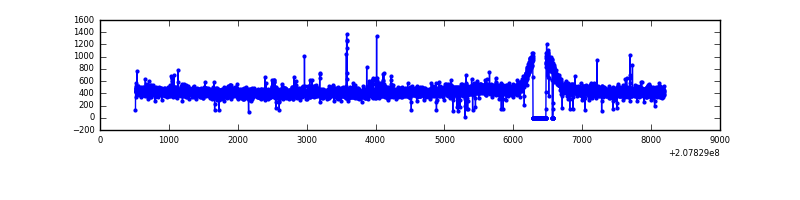 |
| D | 7671 | 7466 | 28 | 28 | 0.37% | 0.38% | 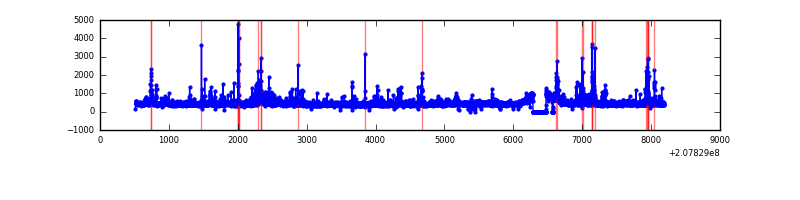 |
Top three noisy pixels from each quadrant. If the there are fewer than three noisy pixels in the level2.evt file, extra rows are filled as -1
| Pixel properties | Quadrant properties | ||||||
|---|---|---|---|---|---|---|---|
| Quadrant | DetID | PixID | Counts | Sigma | Mean | Median | Sigma |
| A | 15 | 174 | 18240 | 98.45 | 859 | 838 | 176.8 |
| A | 13 | 210 | 14686 | 78.34 | 859 | 838 | 176.8 |
| A | 8 | 15 | 13861 | 73.67 | 859 | 838 | 176.8 |
| B | 14 | 167 | 319239 | 1906.52 | 859 | 836 | 167.0 |
| B | 15 | 204 | 132749 | 789.86 | 859 | 836 | 167.0 |
| B | 15 | 54 | 32540 | 189.84 | 859 | 836 | 167.0 |
| C | 5 | 250 | 22514 | 112.11 | 829 | 829 | 193.4 |
| C | 8 | 208 | 15772 | 77.26 | 829 | 829 | 193.4 |
| C | 7 | 247 | 7386 | 33.9 | 829 | 829 | 193.4 |
| D | 13 | 235 | 142919 | 706.4 | 830 | 804 | 201.2 |
| D | 2 | 136 | 115361 | 569.42 | 830 | 804 | 201.2 |
| D | 13 | 239 | 53531 | 262.09 | 830 | 804 | 201.2 |
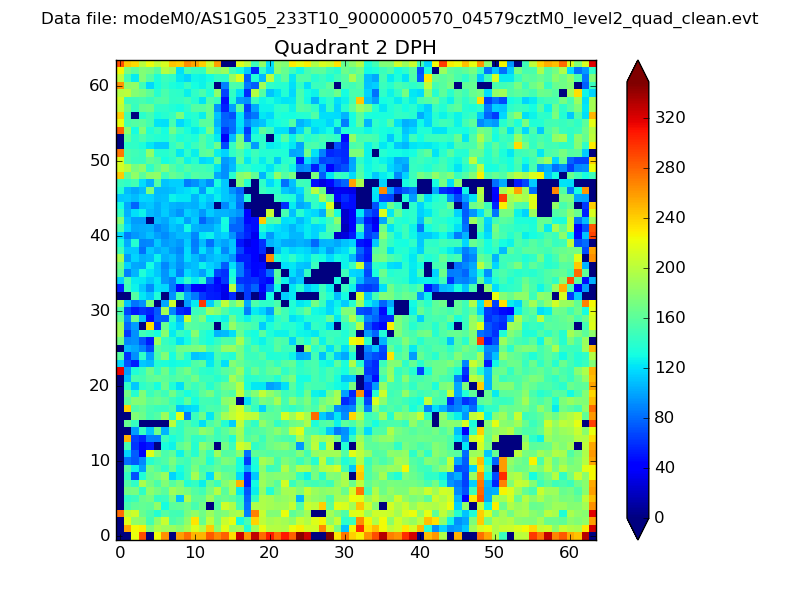
Histogram calculated using DETX and DETY for each event in the final _common_clean file
| Quadrant A | 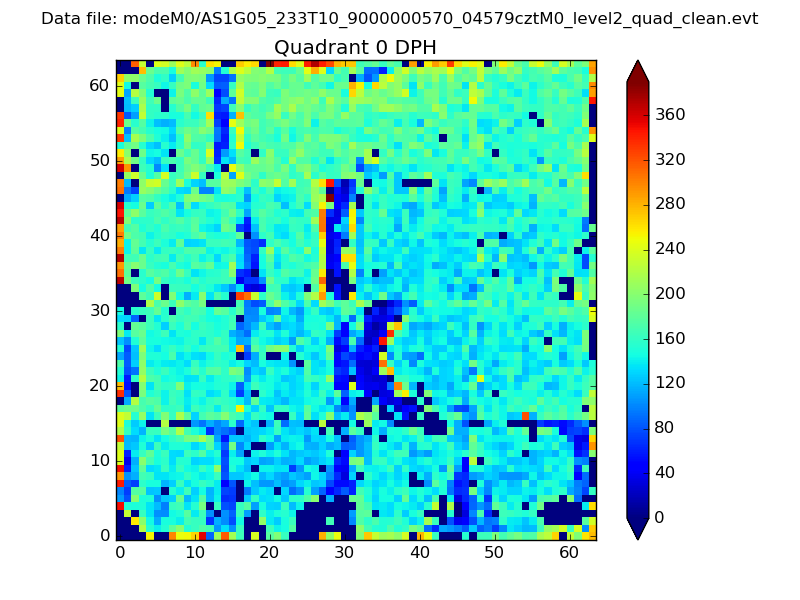 |
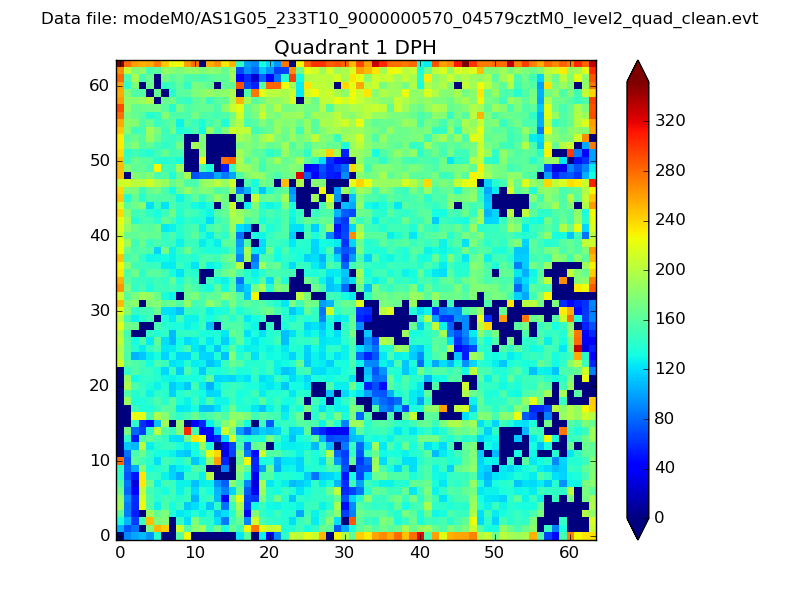 |
Quadrant B |
|---|---|---|---|
| Quadrant D | 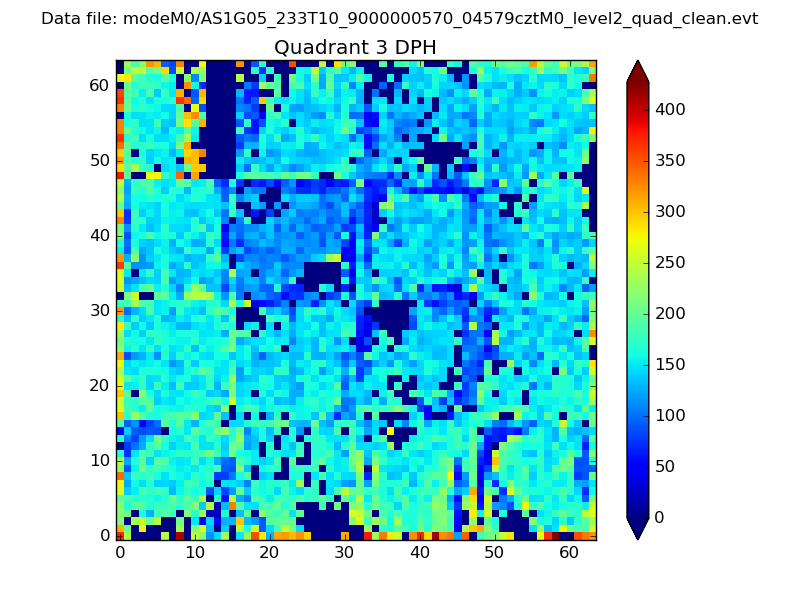 |
 |
Quadrant C |
| Plot type | Count rate plots | Images |
|---|---|---|
| Comparison with Poisson distribution Blue bars denote a histogram of data divided into 1 sec bins. Red curve is a Poisson curve with rate = median count rate of data. |
 |
 |
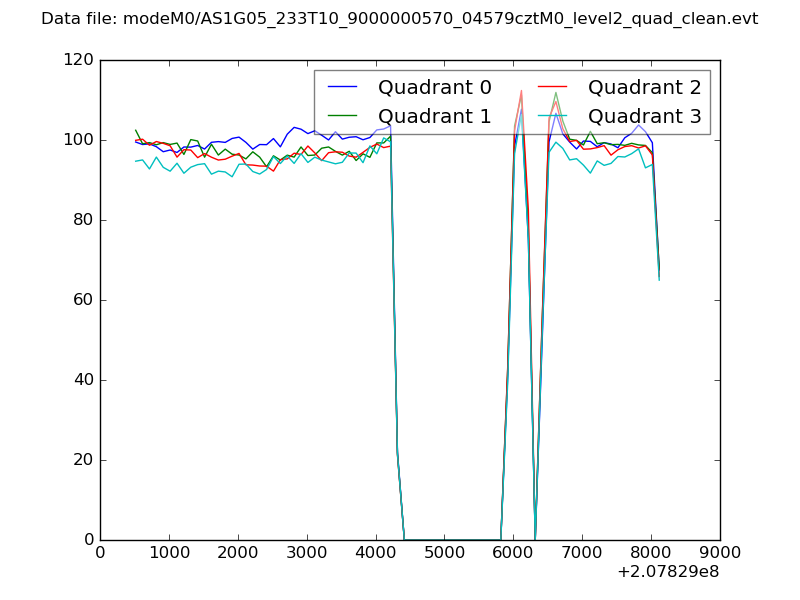
| Quadrant-wise count rates Data is divided into 100 sec bins |
 |
|
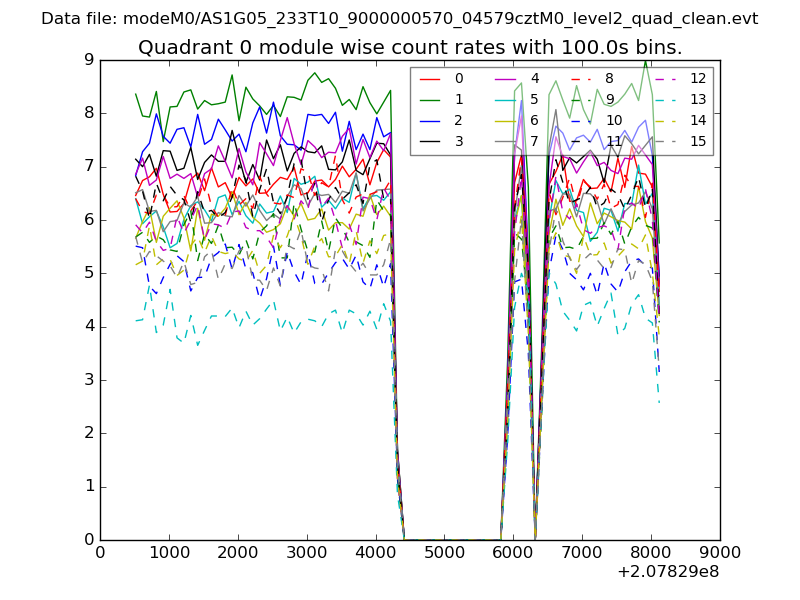
| Module-wise count rates for Quadrant A Data is divided into 100 sec bins |
 |
 |
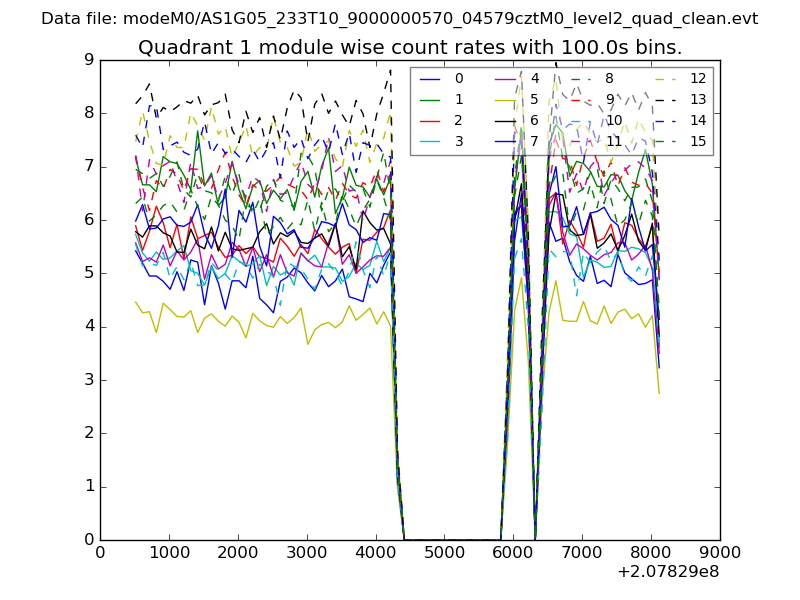
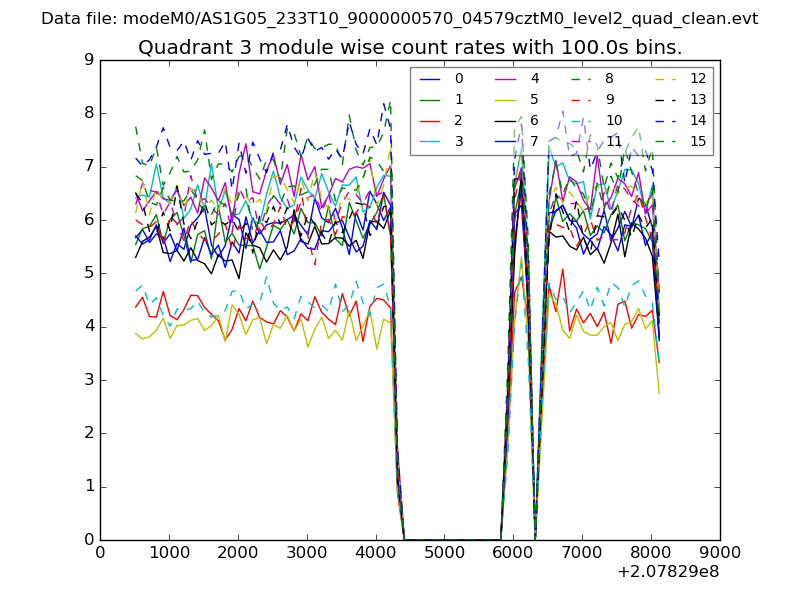
| Module-wise count rates for Quadrant B Data is divided into 100 sec bins |
 |
 |
| Module-wise count rates for Quadrant C Data is divided into 100 sec bins |
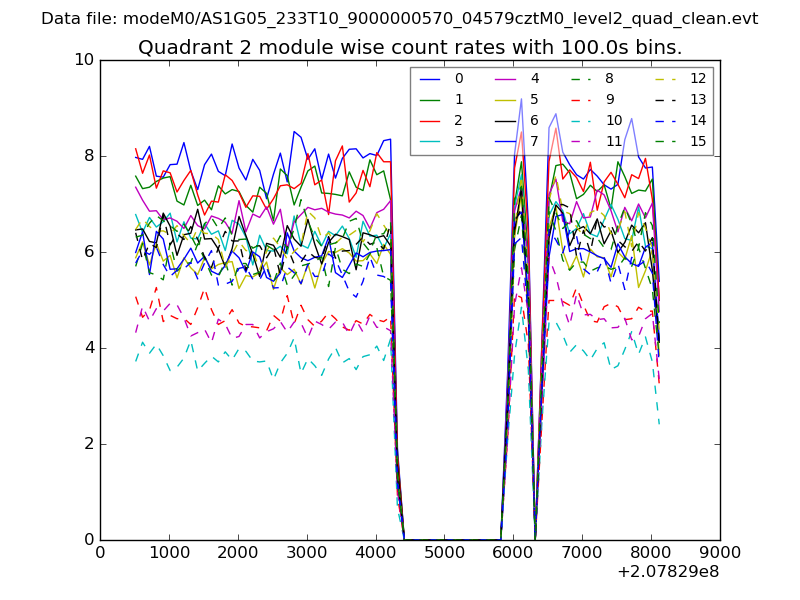 |
 |
| Module-wise count rates for Quadrant D Data is divided into 100 sec bins |
 |
 |
| Parameter | Plot |
|---|---|
| CZT HV Monitor |  |
| D_VDD | 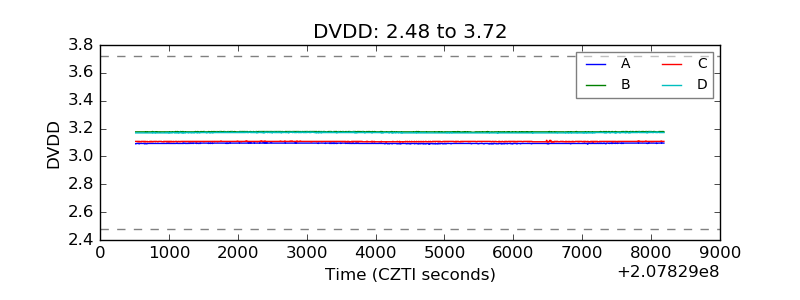 |
| Temperature 1 | 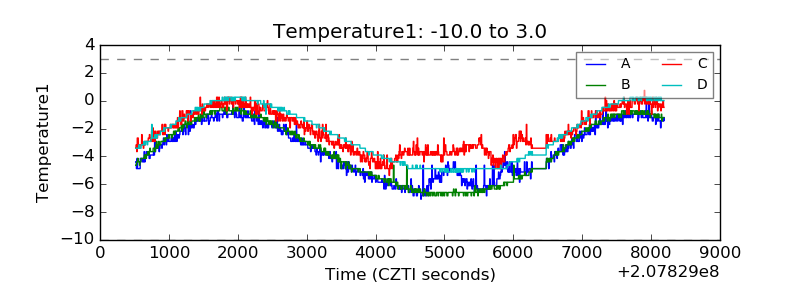 |
| Veto HV Monitor | 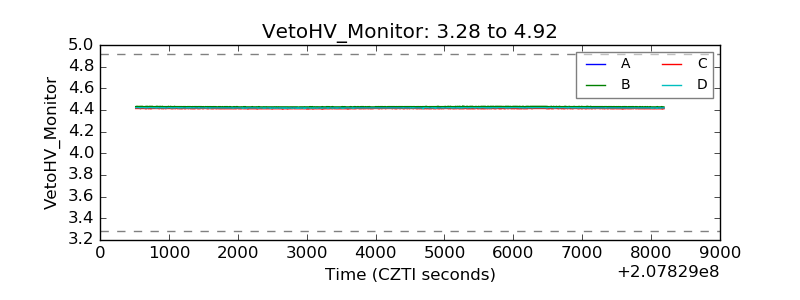 |
| Veto LLD | 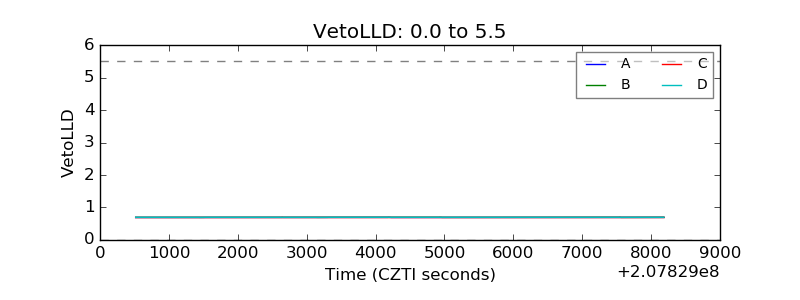 |
| Alpha Counter | 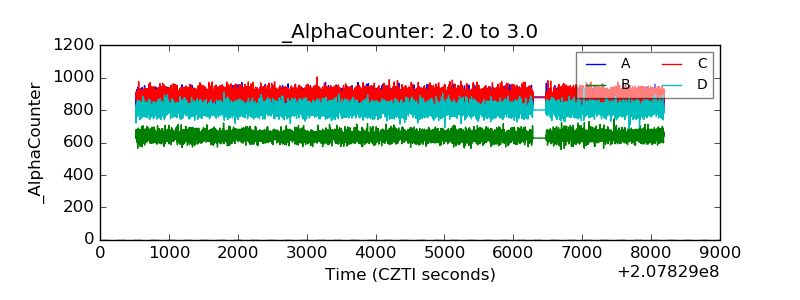 |
| _CPM_Rate | 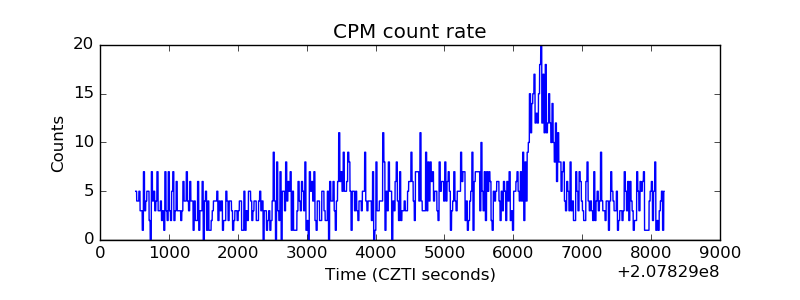 |
| CZT Counter | 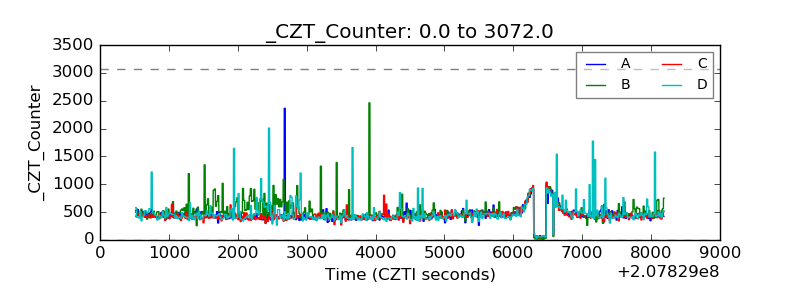 |
| +2.5 Volts monitor |  |
| +5 Volts monitor | 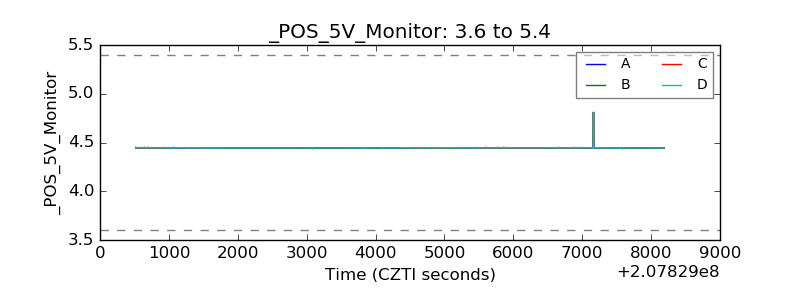 |
| _ROLL_ROT | 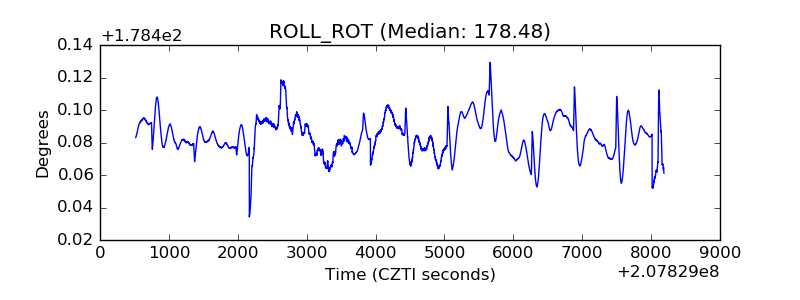 |
| _Roll_DEC | 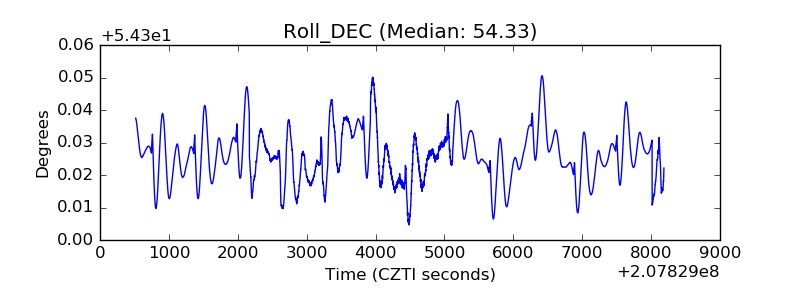 |
| _Roll_RA | 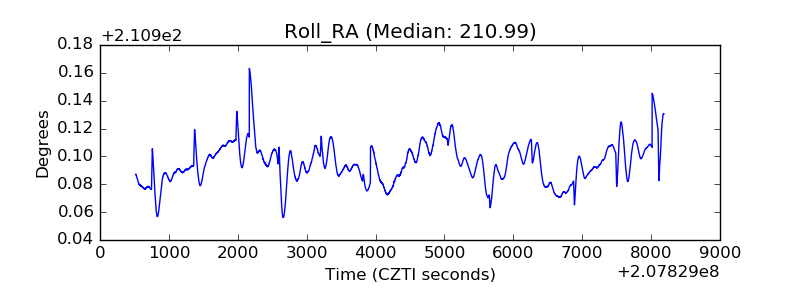 |
| Veto Counter | 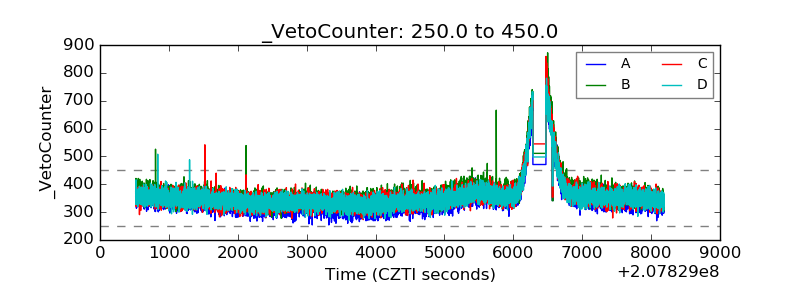 |