| Param | Original file | Final file |
|---|---|---|
| Filename | modeM0/AS1G05_233T10_9000000570_04582cztM0_level2.evt | modeM0/AS1G05_233T10_9000000570_04582cztM0_level2_quad_clean.evt |
| Size (bytes) | 1,150,577,280 | 209,027,520 |
| Size | 1.1 GB | 199.3 MB |
| Events in quadrant A | 7,946,477 | 1,306,844 |
| Events in quadrant B | 9,726,095 | 1,282,305 |
| Events in quadrant C | 7,666,450 | 1,277,013 |
| Events in quadrant D | 8,308,194 | 1,244,091 |
| Mode M9 | |||
|---|---|---|---|
| Quadrant | BADHDUFLAG | Total packets | Discarded packets |
| A | 0 | 20 | 0 |
| B | 0 | 20 | 0 |
| C | 0 | 20 | 0 |
| D | 0 | 20 | 0 |
| Mode M0 | |||
|---|---|---|---|
| Quadrant | BADHDUFLAG | Total packets | Discarded packets |
| A | 0 | 36580 | 57 |
| B | 0 | 40819 | 45 |
| C | 0 | 36014 | 54 |
| D | 0 | 38026 | 76 |
| Mode SS | |||
|---|---|---|---|
| Quadrant | BADHDUFLAG | Total packets | Discarded packets |
| A | 0 | 360 | 0 |
| B | 0 | 360 | 4 |
| C | 0 | 360 | 2 |
| D | 0 | 360 | 2 |
| Quadrant | Total seconds | Saturated seconds | Saturation percentage |
|---|---|---|---|
| A | 17711 | 109 | 0.615437% |
| B | 17715 | 168 | 0.948349% |
| C | 17709 | 42 | 0.237168% |
| D | 17709 | 129 | 0.728443% |
Noise dominated data is calculated using 1-second bins in cleaned event files. If a bin has >2000 counts, and if more than 50% of those come from <1% of pixels, then it is considered to be noise-dominated and hence unusable.
| Quadrant | # 1 sec bins | Bins with >0 counts | Bins with >2000 counts | High rate bins dominated by noise | Noise dominated (total time) | Noise dominated (detector-on time) | Marked lightcurve |
|---|---|---|---|---|---|---|---|
| A | 19754 | 17738 | 33 | 33 | 0.17% | 0.19% | 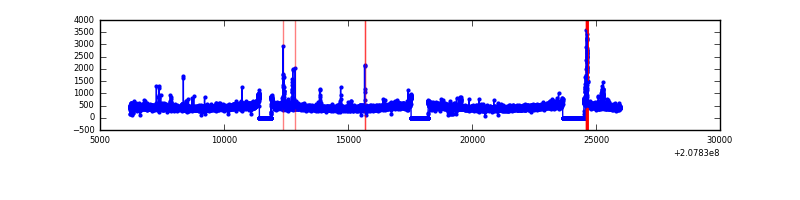 |
| B | 19754 | 17738 | 57 | 57 | 0.29% | 0.32% | 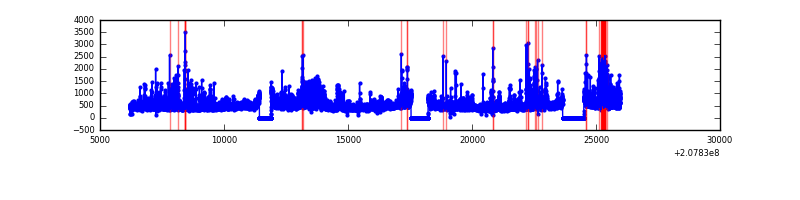 |
| C | 19754 | 17738 | 4 | 4 | 0.02% | 0.02% | 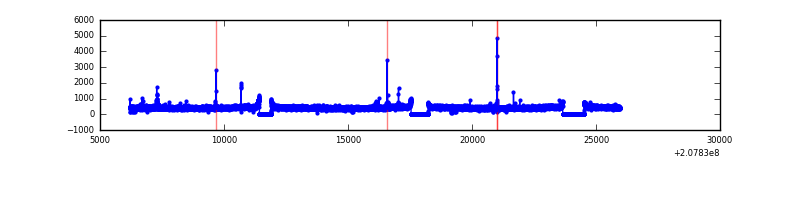 |
| D | 19754 | 17738 | 62 | 62 | 0.31% | 0.35% | 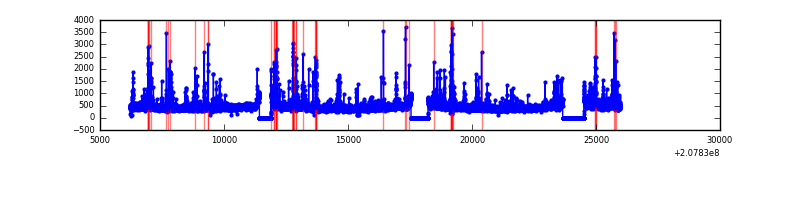 |
Top three noisy pixels from each quadrant. If the there are fewer than three noisy pixels in the level2.evt file, extra rows are filled as -1
| Pixel properties | Quadrant properties | ||||||
|---|---|---|---|---|---|---|---|
| Quadrant | DetID | PixID | Counts | Sigma | Mean | Median | Sigma |
| A | 15 | 174 | 107567 | 259.56 | 1989 | 1940 | 406.9 |
| A | 0 | 13 | 80834 | 193.87 | 1989 | 1940 | 406.9 |
| A | 0 | 50 | 42575 | 99.86 | 1989 | 1940 | 406.9 |
| B | 14 | 167 | 1137786 | 2967.65 | 2004 | 1952 | 382.7 |
| B | 15 | 204 | 412885 | 1073.67 | 2004 | 1952 | 382.7 |
| B | 10 | 16 | 212694 | 550.62 | 2004 | 1952 | 382.7 |
| C | 9 | 54 | 41452 | 88.11 | 1934 | 1941 | 448.5 |
| C | 9 | 247 | 18550 | 37.04 | 1934 | 1941 | 448.5 |
| C | 13 | 61 | 16025 | 31.41 | 1934 | 1941 | 448.5 |
| D | 13 | 235 | 212989 | 450.29 | 1935 | 1871 | 468.8 |
| D | 13 | 25 | 193775 | 409.31 | 1935 | 1871 | 468.8 |
| D | 2 | 136 | 184214 | 388.92 | 1935 | 1871 | 468.8 |
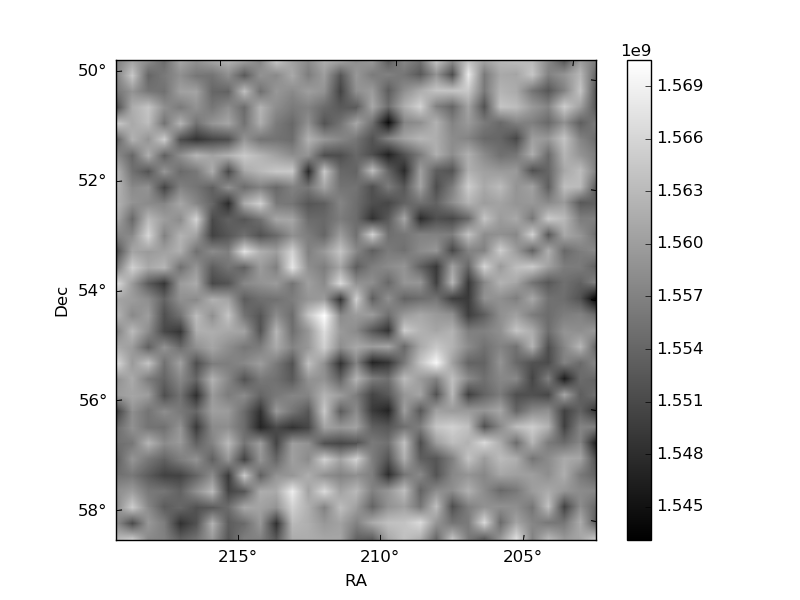
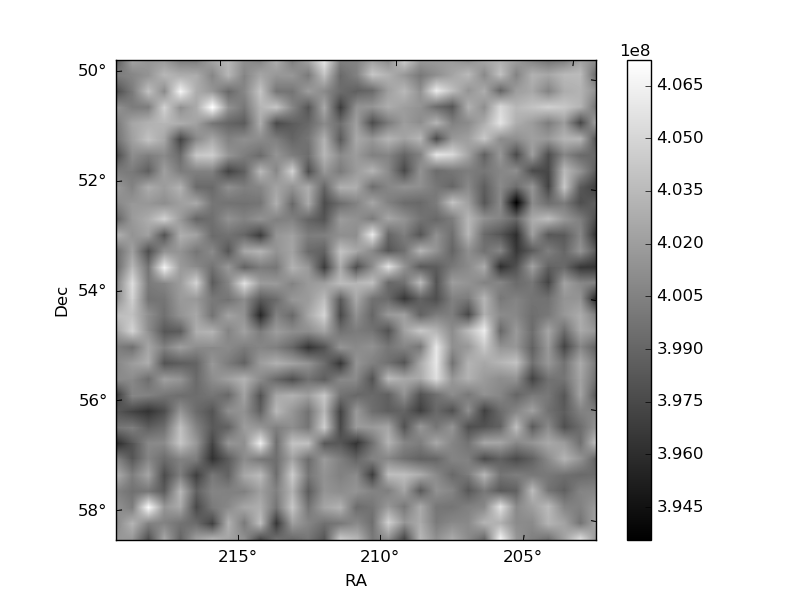
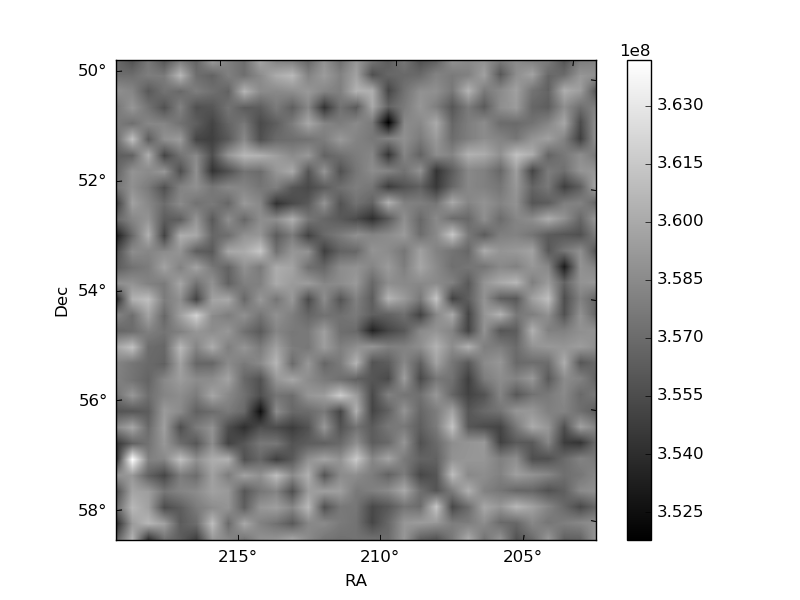
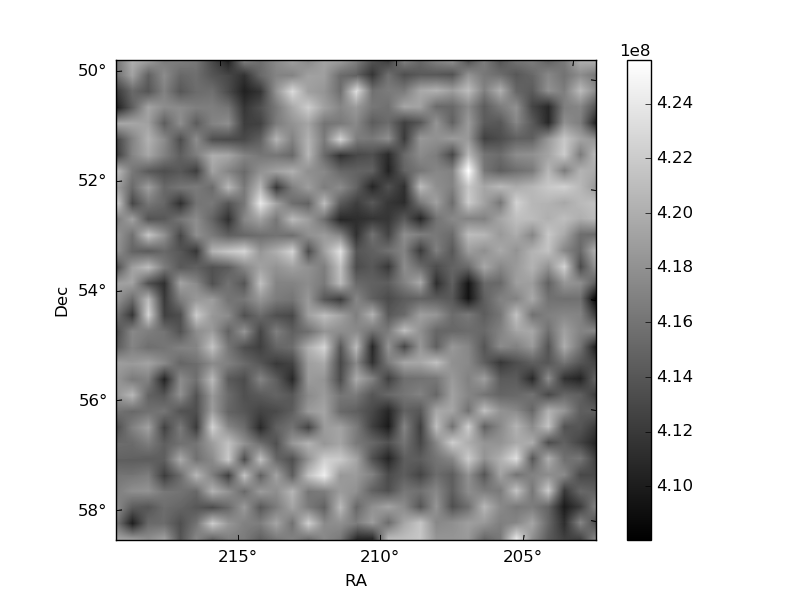
Histogram calculated using DETX and DETY for each event in the final _common_clean file
| Quadrant A | 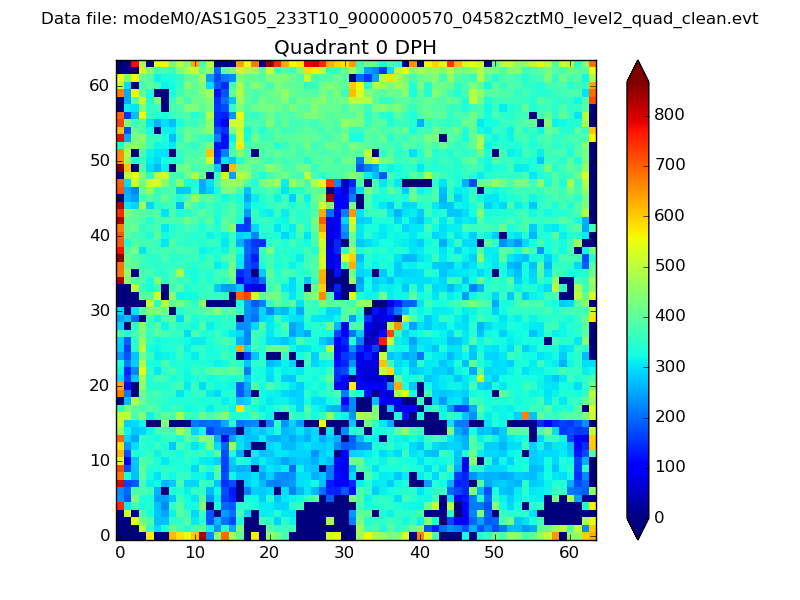 |
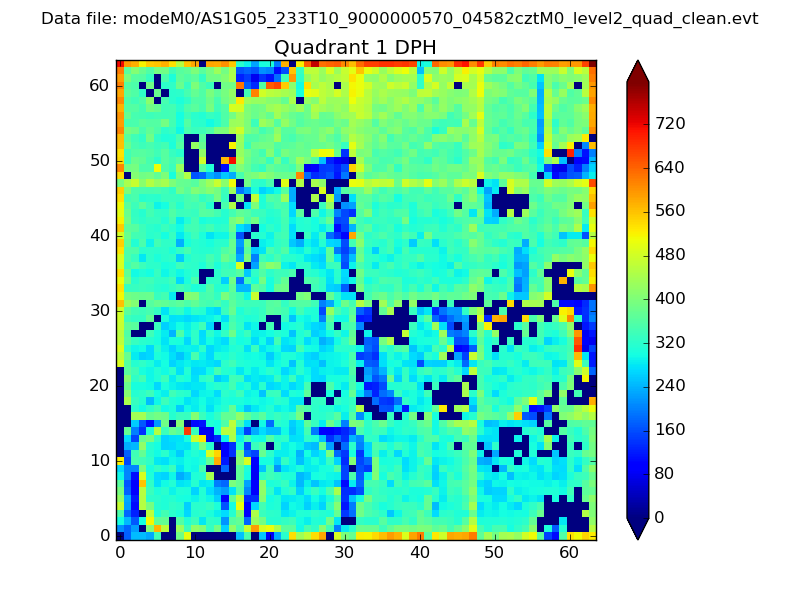 |
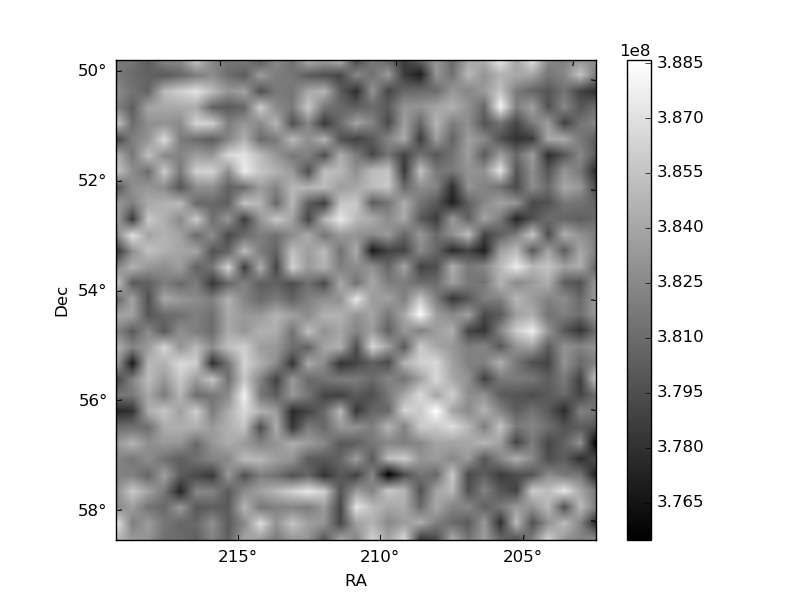
Quadrant B |
|---|---|---|---|
| Quadrant D | 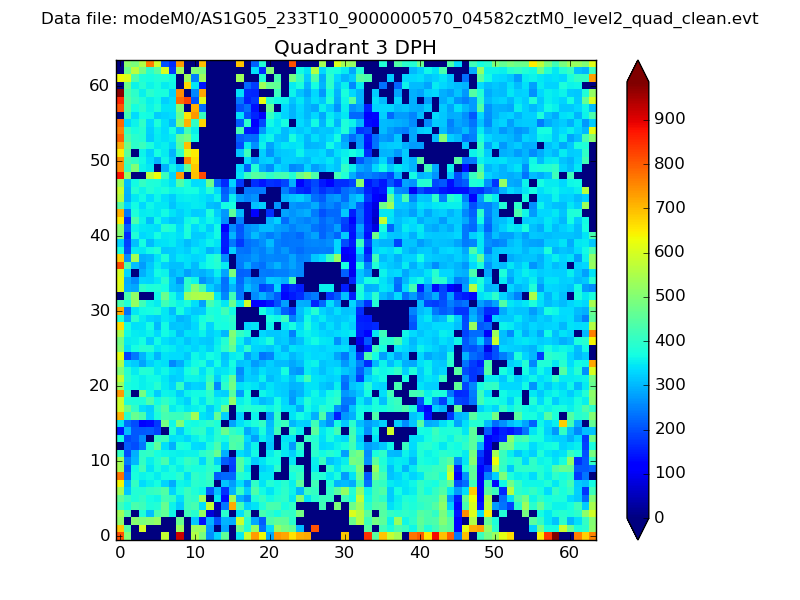 |
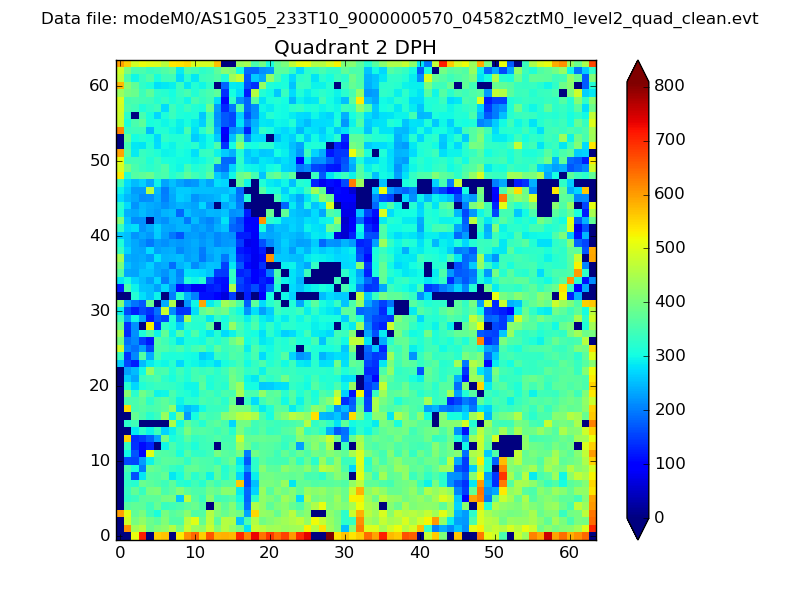 |
Quadrant C |
| Plot type | Count rate plots | Images |
|---|---|---|
| Comparison with Poisson distribution Blue bars denote a histogram of data divided into 1 sec bins. Red curve is a Poisson curve with rate = median count rate of data. |
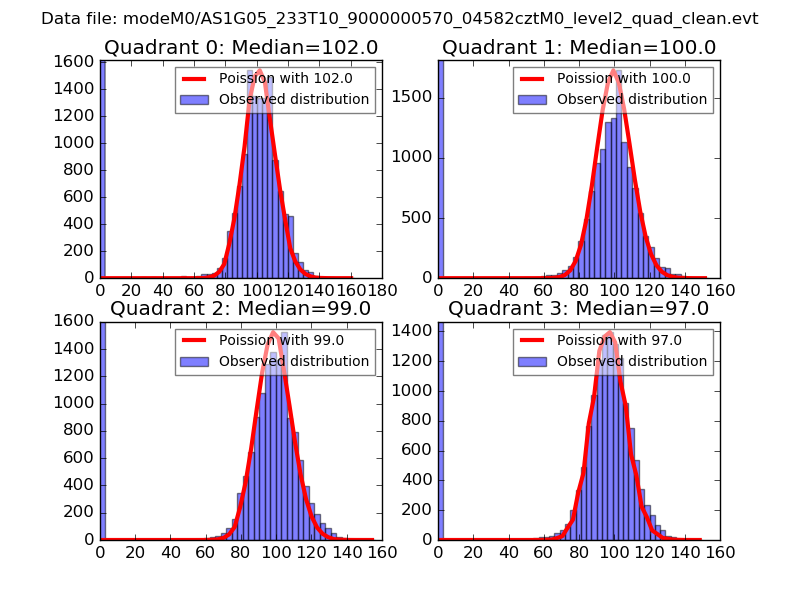 |
 |
| Quadrant-wise count rates Data is divided into 100 sec bins |
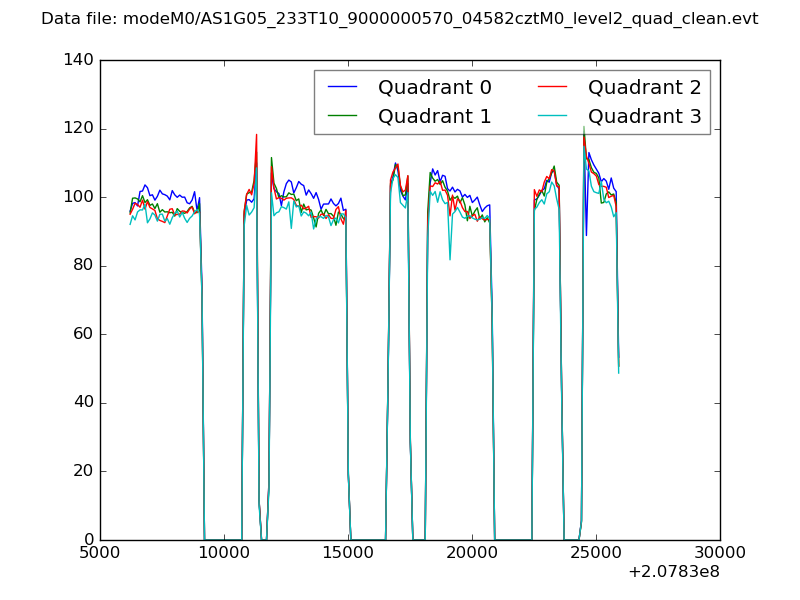 |
|
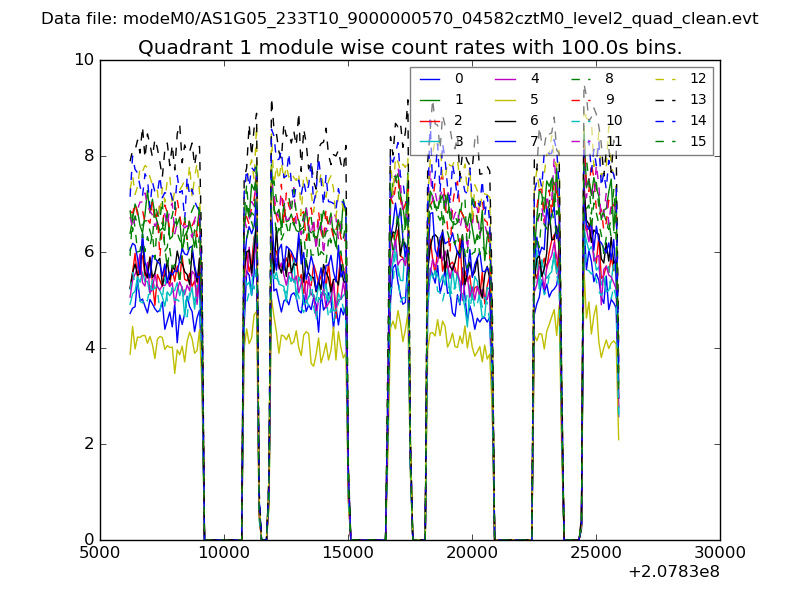
| Module-wise count rates for Quadrant A Data is divided into 100 sec bins |
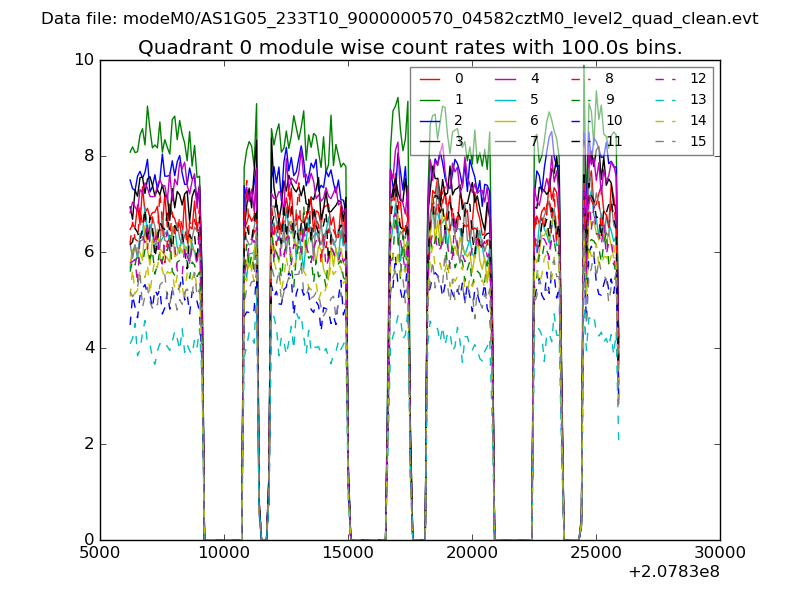 |
 |
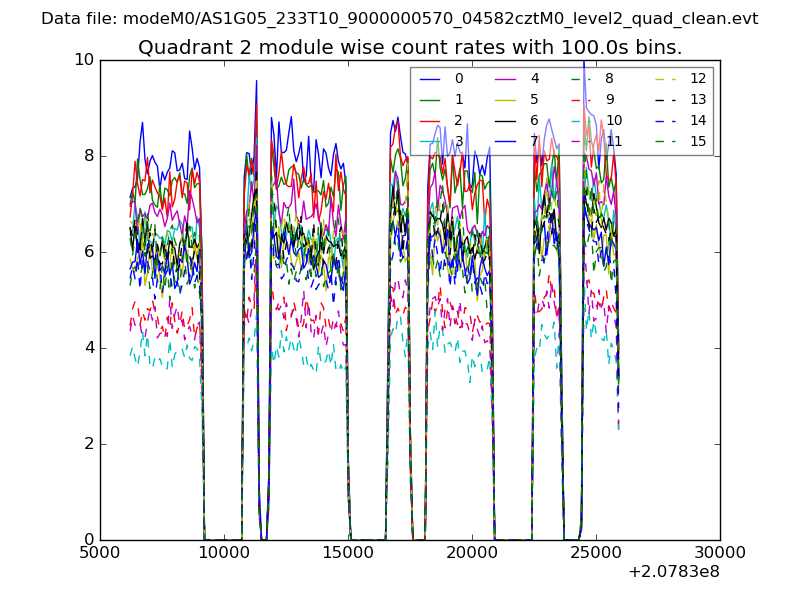
| Module-wise count rates for Quadrant B Data is divided into 100 sec bins |
 |
 |
| Module-wise count rates for Quadrant C Data is divided into 100 sec bins |
 |
 |
| Module-wise count rates for Quadrant D Data is divided into 100 sec bins |
 |
 |
| Parameter | Plot |
|---|---|
| CZT HV Monitor | 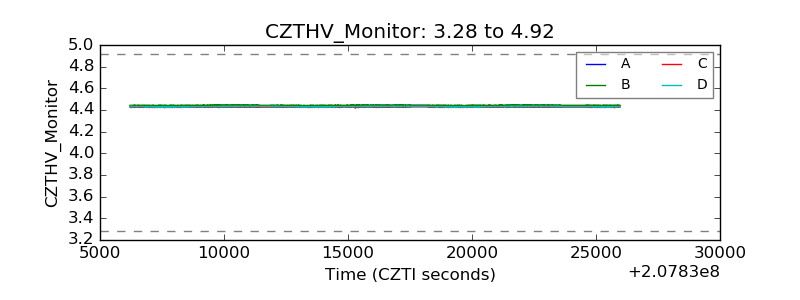 |
| D_VDD | 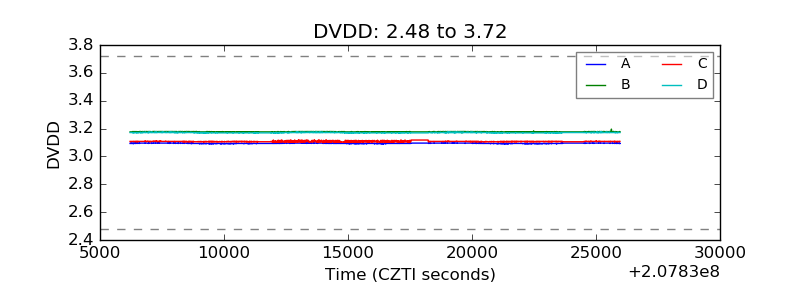 |
| Temperature 1 | 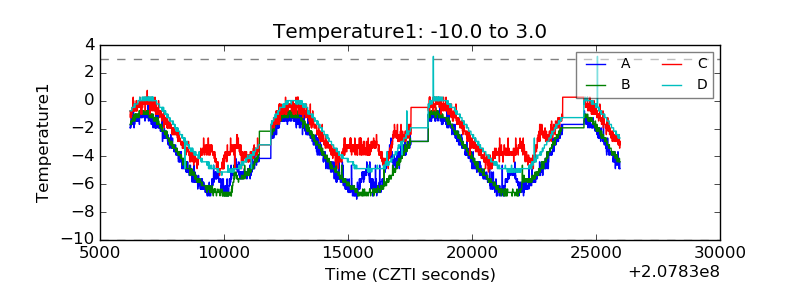 |
| Veto HV Monitor | 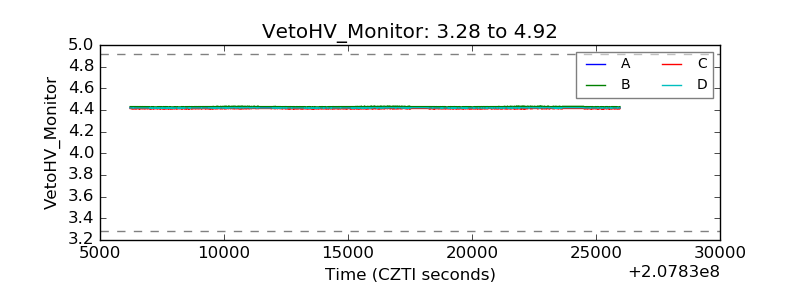 |
| Veto LLD | 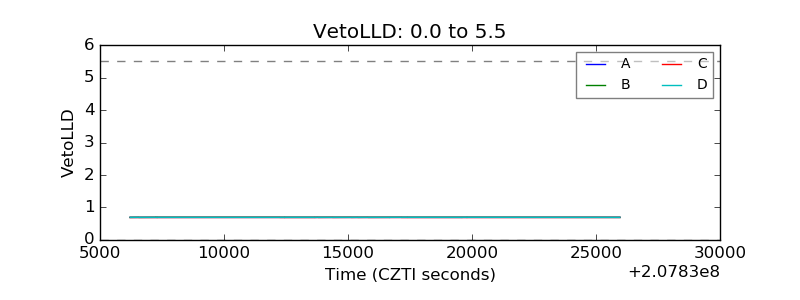 |
| Alpha Counter | 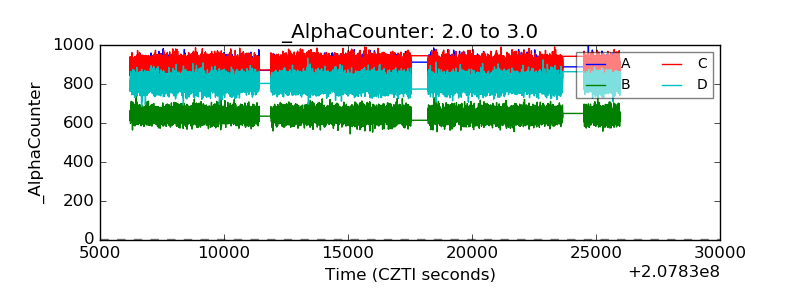 |
| _CPM_Rate | 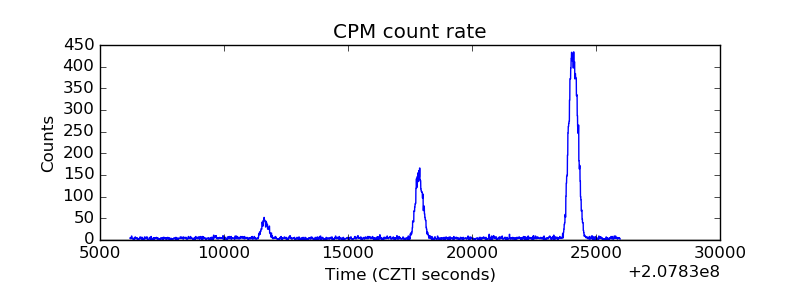 |
| CZT Counter | 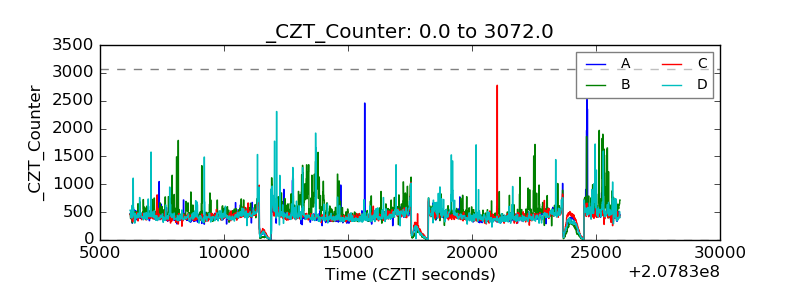 |
| +2.5 Volts monitor | 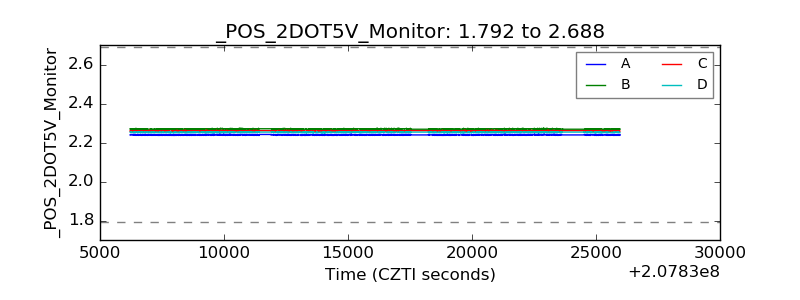 |
| +5 Volts monitor | 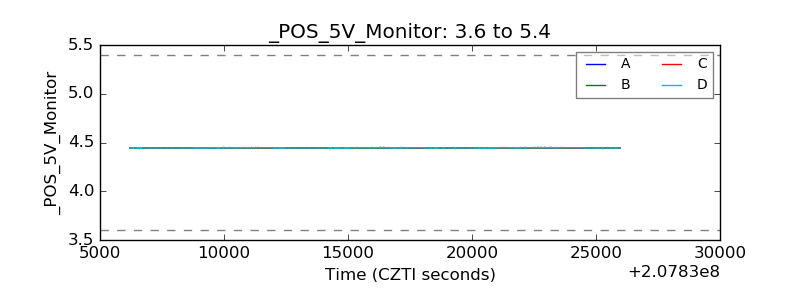 |
| _ROLL_ROT | 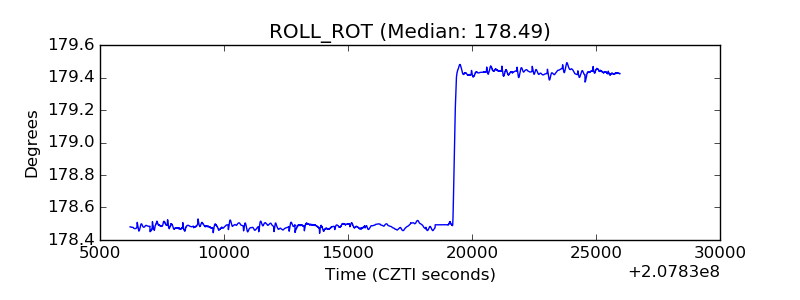 |
| _Roll_DEC | 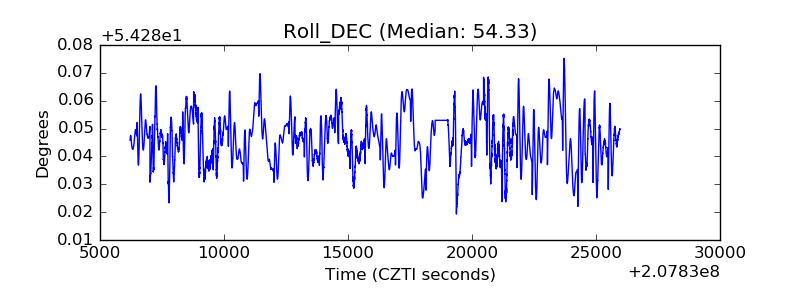 |
| _Roll_RA | 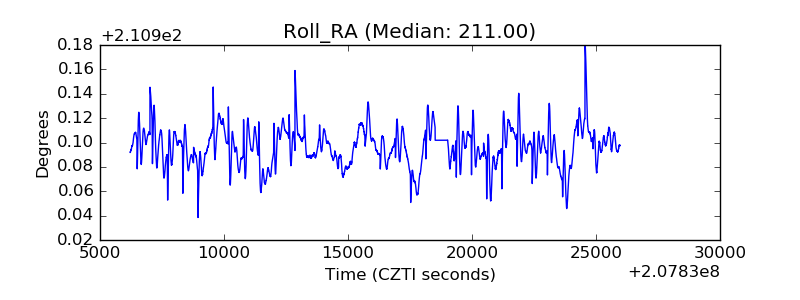 |
| Veto Counter | 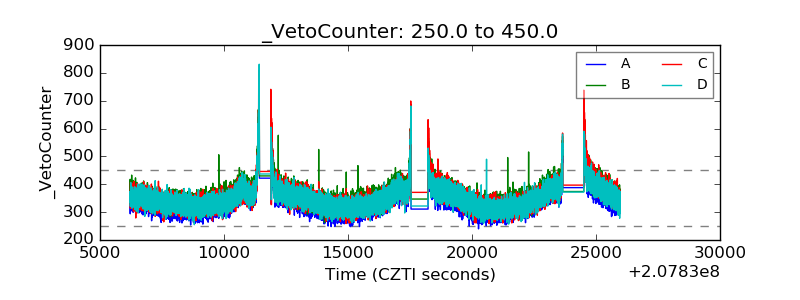 |