| Param | Original file | Final file |
|---|---|---|
| Filename | modeM0/AS1G05_233T10_9000000570_04585cztM0_level2.evt | modeM0/AS1G05_233T10_9000000570_04585cztM0_level2_quad_clean.evt |
| Size (bytes) | 436,178,880 | 83,050,560 |
| Size | 416.0 MB | 79.2 MB |
| Events in quadrant A | 3,144,342 | 520,645 |
| Events in quadrant B | 3,540,656 | 521,312 |
| Events in quadrant C | 2,938,209 | 519,840 |
| Events in quadrant D | 3,147,513 | 502,752 |
| Mode M9 | |||
|---|---|---|---|
| Quadrant | BADHDUFLAG | Total packets | Discarded packets |
| A | 0 | 18 | 0 |
| B | 0 | 18 | 0 |
| C | 0 | 18 | 0 |
| D | 0 | 19 | 0 |
| Mode M0 | |||
|---|---|---|---|
| Quadrant | BADHDUFLAG | Total packets | Discarded packets |
| A | 0 | 14055 | 3 |
| B | 0 | 15125 | 2 |
| C | 0 | 13278 | 2 |
| D | 0 | 14019 | 2 |
| Mode SS | |||
|---|---|---|---|
| Quadrant | BADHDUFLAG | Total packets | Discarded packets |
| A | 0 | 130 | 0 |
| B | 0 | 130 | 0 |
| C | 0 | 130 | 0 |
| D | 0 | 130 | 0 |
| Quadrant | Total seconds | Saturated seconds | Saturation percentage |
|---|---|---|---|
| A | 6460 | 92 | 1.424149% |
| B | 6460 | 61 | 0.944272% |
| C | 6460 | 16 | 0.247678% |
| D | 6460 | 42 | 0.650155% |
Noise dominated data is calculated using 1-second bins in cleaned event files. If a bin has >2000 counts, and if more than 50% of those come from <1% of pixels, then it is considered to be noise-dominated and hence unusable.
| Quadrant | # 1 sec bins | Bins with >0 counts | Bins with >2000 counts | High rate bins dominated by noise | Noise dominated (total time) | Noise dominated (detector-on time) | Marked lightcurve |
|---|---|---|---|---|---|---|---|
| A | 7620 | 6461 | 42 | 42 | 0.55% | 0.65% | 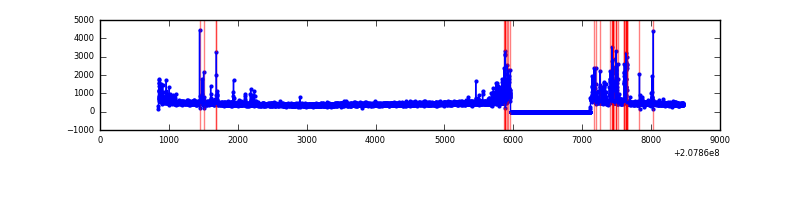 |
| B | 7620 | 6461 | 17 | 17 | 0.22% | 0.26% | 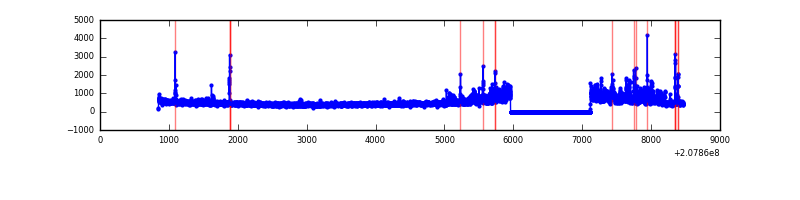 |
| C | 7620 | 6461 | 3 | 3 | 0.04% | 0.05% | 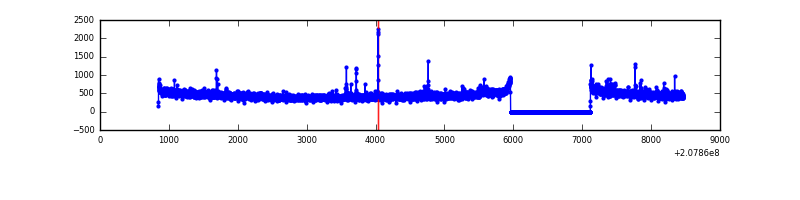 |
| D | 7620 | 6461 | 18 | 18 | 0.24% | 0.28% | 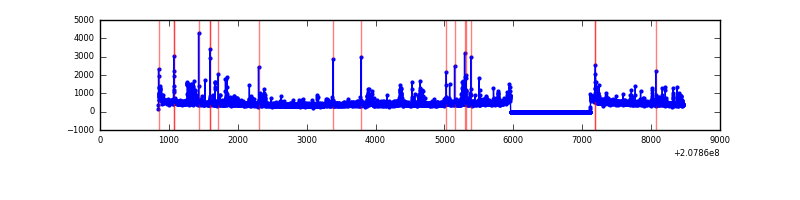 |
Top three noisy pixels from each quadrant. If the there are fewer than three noisy pixels in the level2.evt file, extra rows are filled as -1
| Pixel properties | Quadrant properties | ||||||
|---|---|---|---|---|---|---|---|
| Quadrant | DetID | PixID | Counts | Sigma | Mean | Median | Sigma |
| A | 0 | 118 | 279996 | 1849.7 | 731 | 715 | 151.0 |
| A | 0 | 226 | 33282 | 215.69 | 731 | 715 | 151.0 |
| A | 8 | 15 | 9002 | 54.89 | 731 | 715 | 151.0 |
| B | 15 | 204 | 337600 | 2394.19 | 744 | 728 | 140.7 |
| B | 14 | 167 | 153307 | 1084.4 | 744 | 728 | 140.7 |
| B | 10 | 16 | 60961 | 428.08 | 744 | 728 | 140.7 |
| C | 9 | 247 | 47198 | 275.46 | 722 | 726 | 168.7 |
| C | 8 | 208 | 27168 | 156.73 | 722 | 726 | 168.7 |
| C | 8 | 128 | 12414 | 69.28 | 722 | 726 | 168.7 |
| D | 13 | 235 | 134362 | 772.71 | 716 | 697 | 173.0 |
| D | 2 | 136 | 117844 | 677.22 | 716 | 697 | 173.0 |
| D | 1 | 7 | 42268 | 240.32 | 716 | 697 | 173.0 |
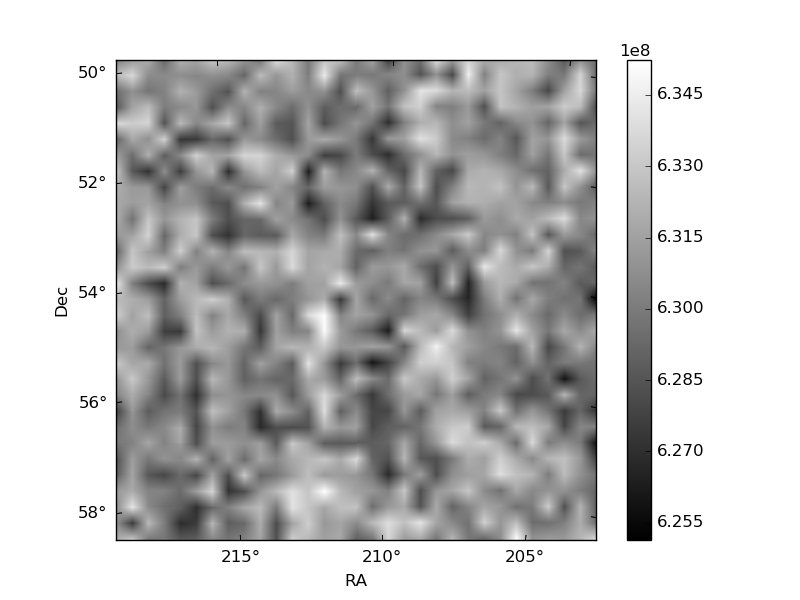
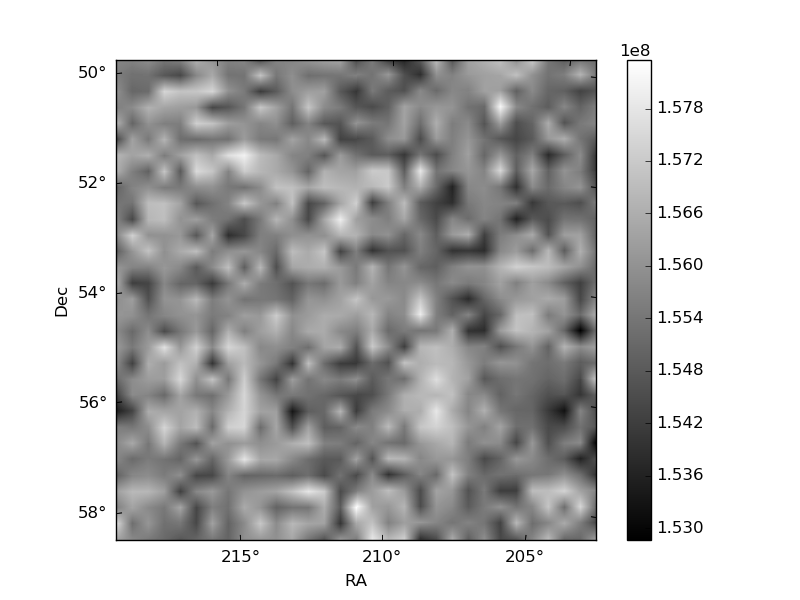
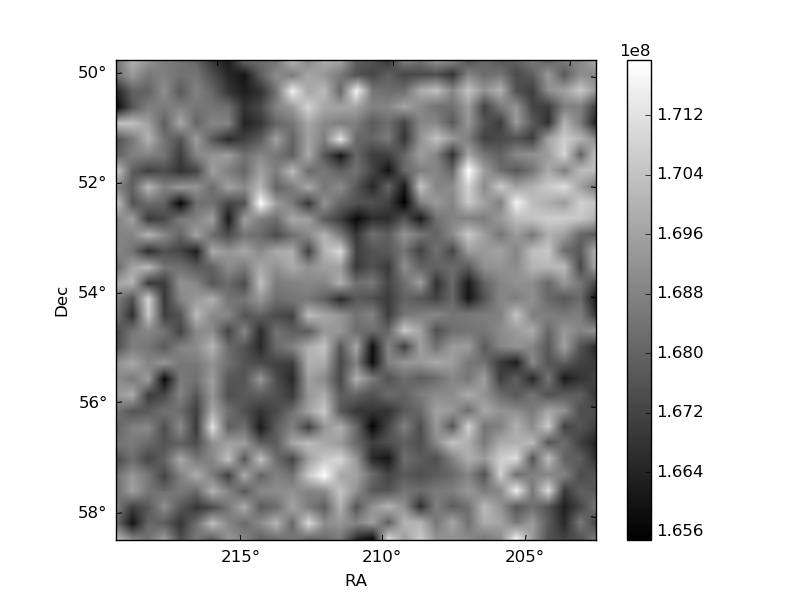
Histogram calculated using DETX and DETY for each event in the final _common_clean file
| Quadrant A | 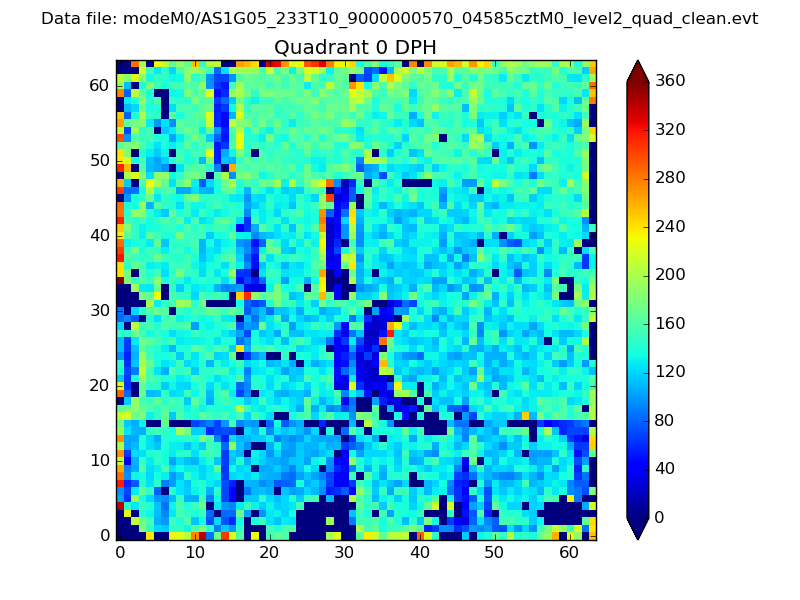 |
 |
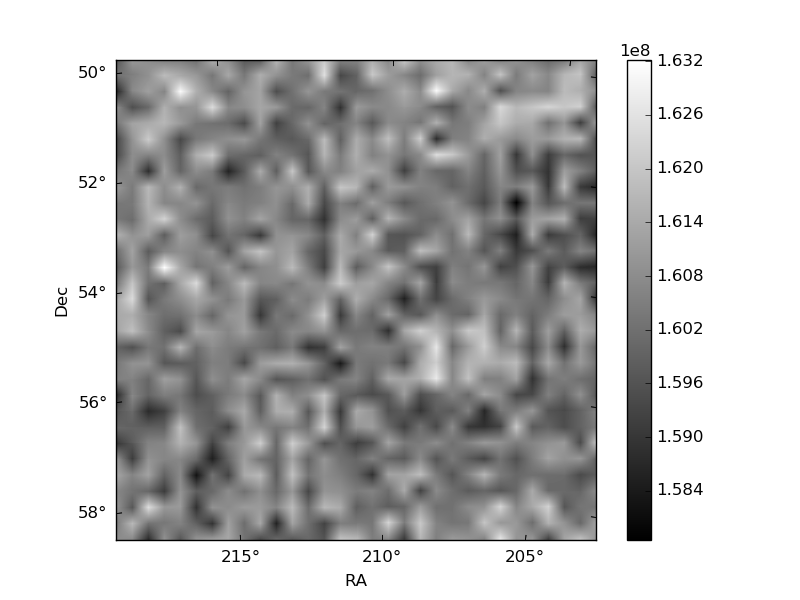
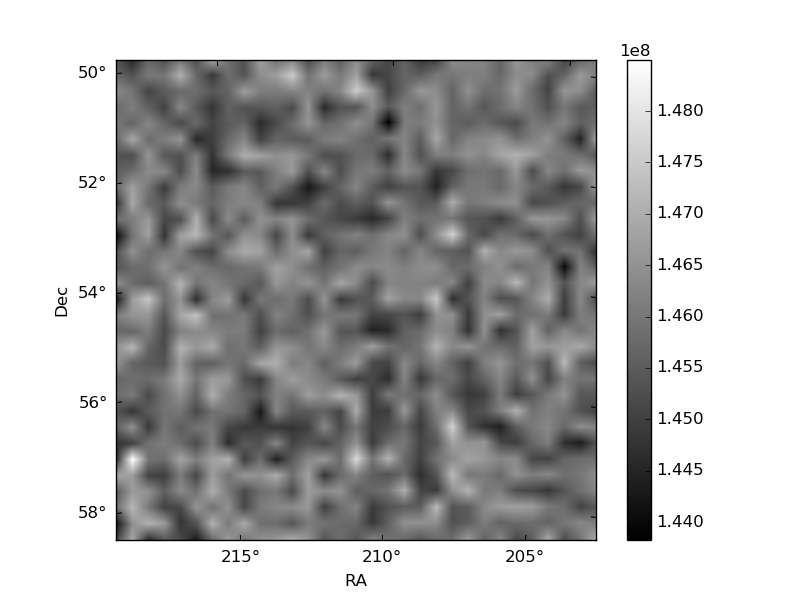
Quadrant B |
|---|---|---|---|
| Quadrant D | 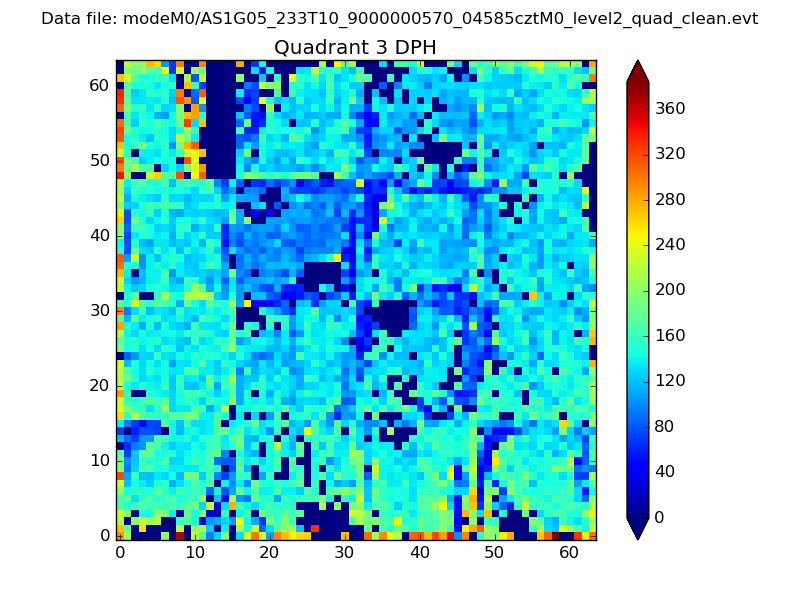 |
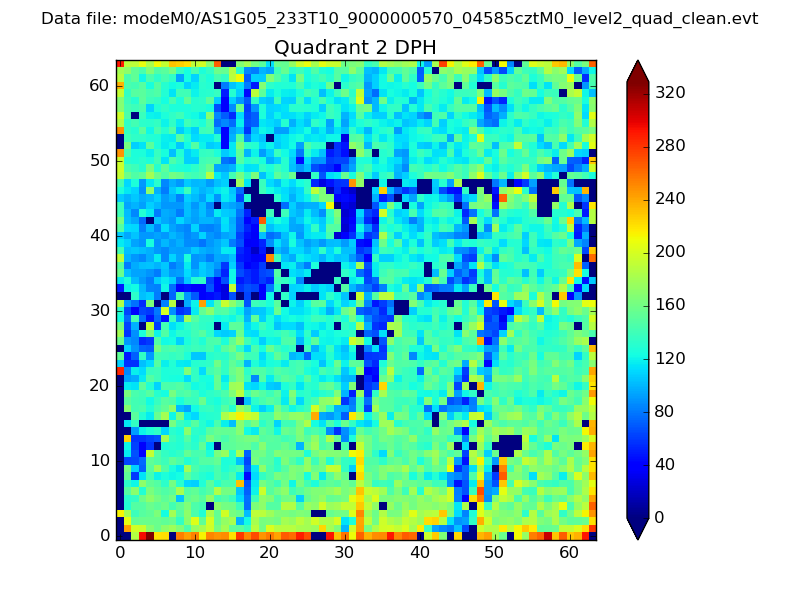 |
Quadrant C |
| Plot type | Count rate plots | Images |
|---|---|---|
| Comparison with Poisson distribution Blue bars denote a histogram of data divided into 1 sec bins. Red curve is a Poisson curve with rate = median count rate of data. |
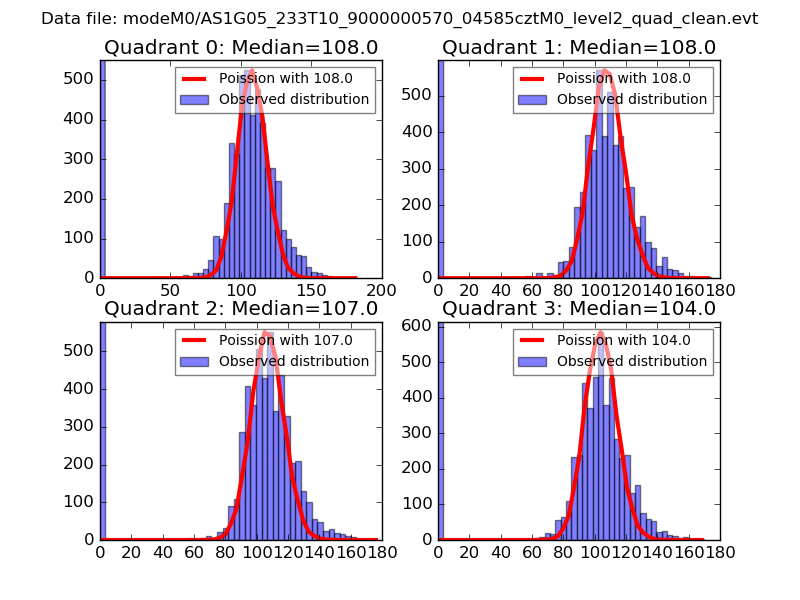 |
 |
| Quadrant-wise count rates Data is divided into 100 sec bins |
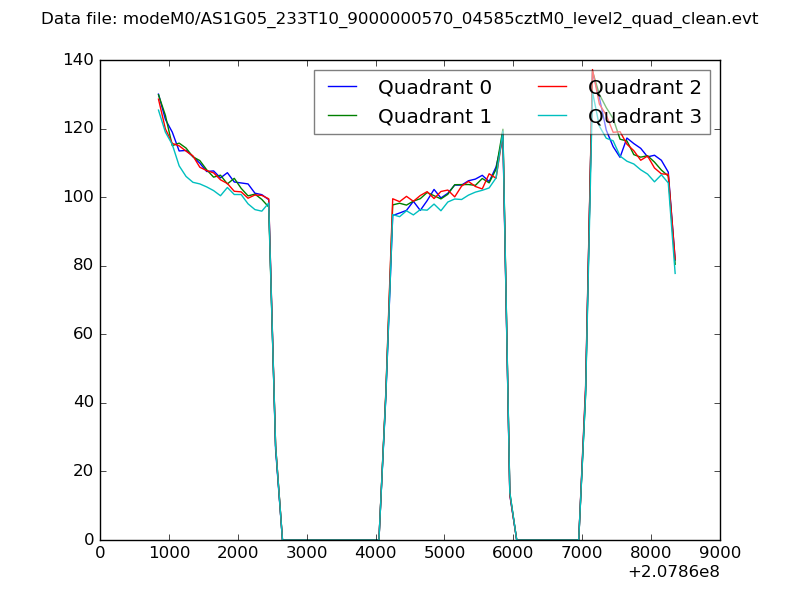 |
|
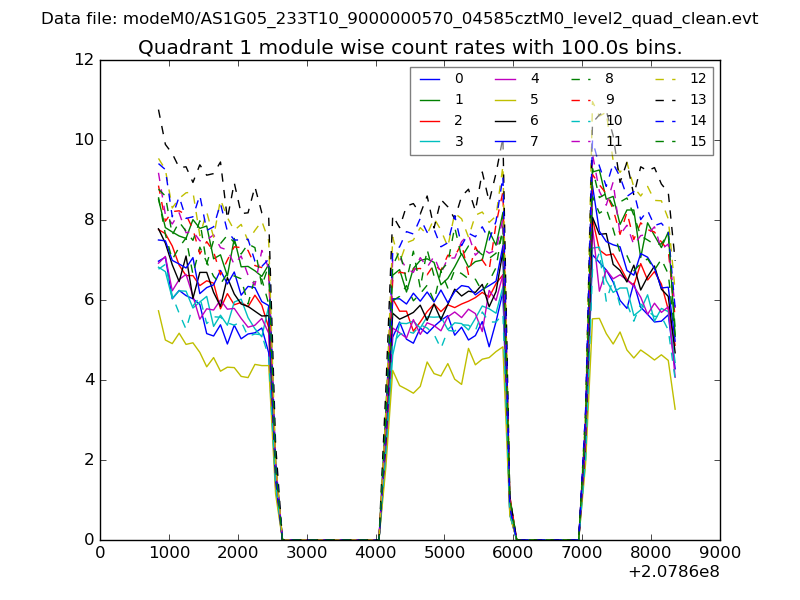
| Module-wise count rates for Quadrant A Data is divided into 100 sec bins |
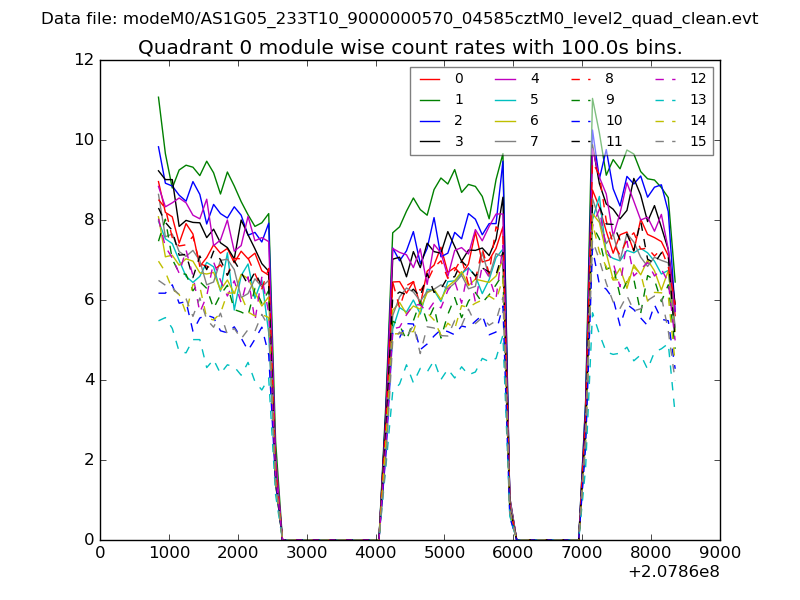 |
 |
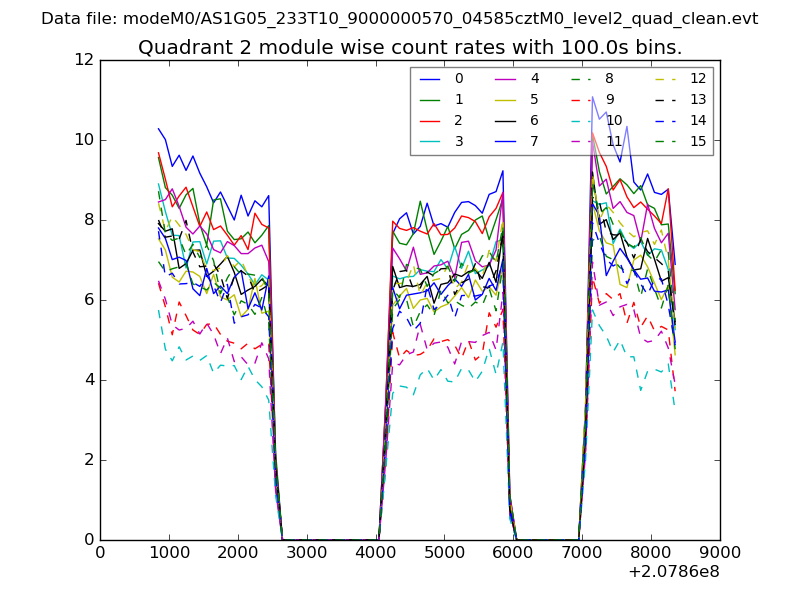
| Module-wise count rates for Quadrant B Data is divided into 100 sec bins |
 |
 |
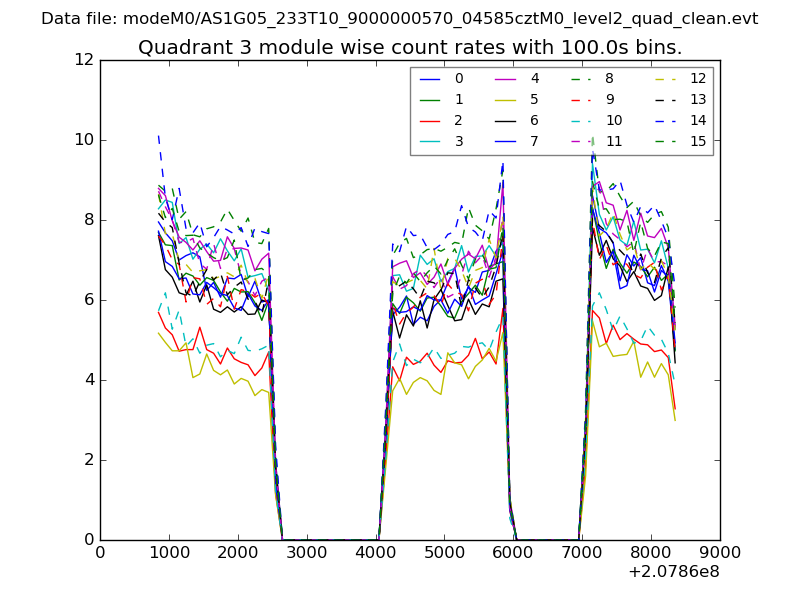
| Module-wise count rates for Quadrant C Data is divided into 100 sec bins |
 |
 |
| Module-wise count rates for Quadrant D Data is divided into 100 sec bins |
 |
 |
| Parameter | Plot |
|---|---|
| CZT HV Monitor | 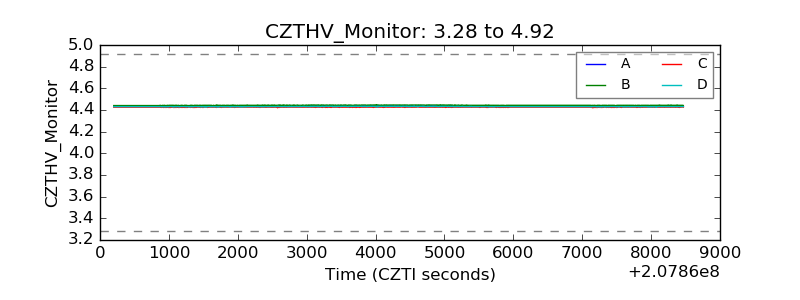 |
| D_VDD | 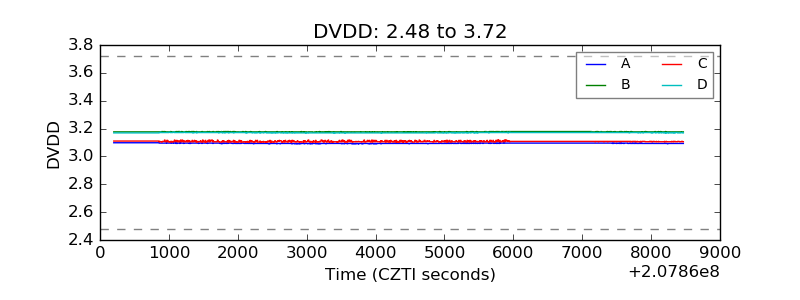 |
| Temperature 1 | 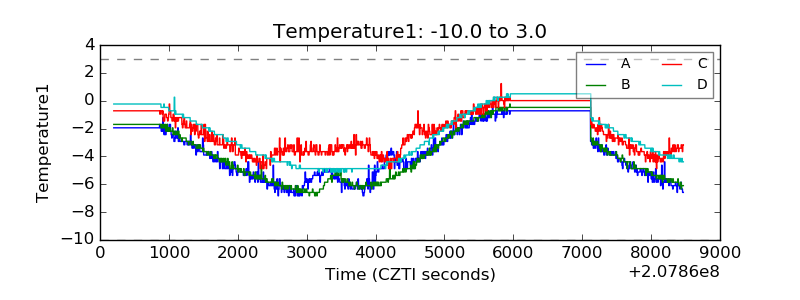 |
| Veto HV Monitor | 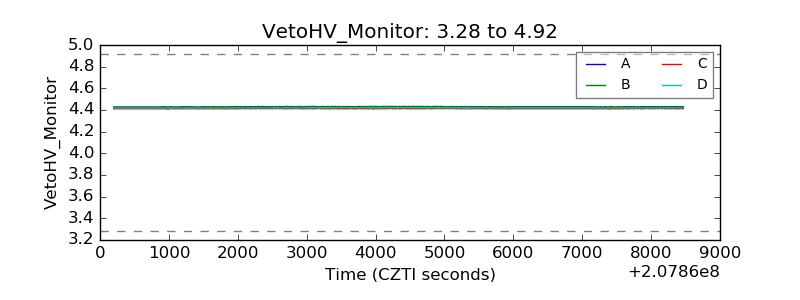 |
| Veto LLD | 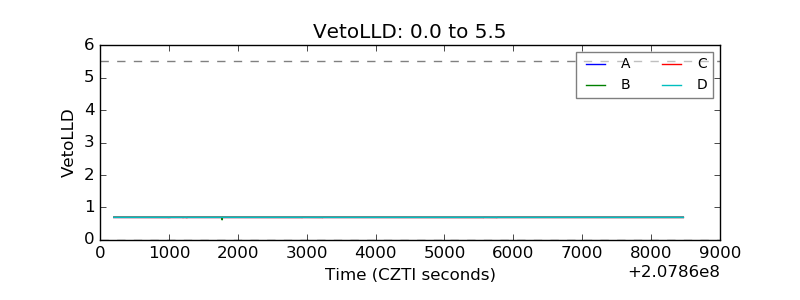 |
| Alpha Counter |  |
| _CPM_Rate | 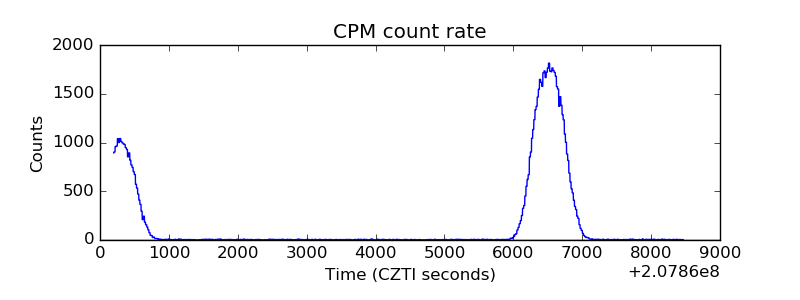 |
| CZT Counter | 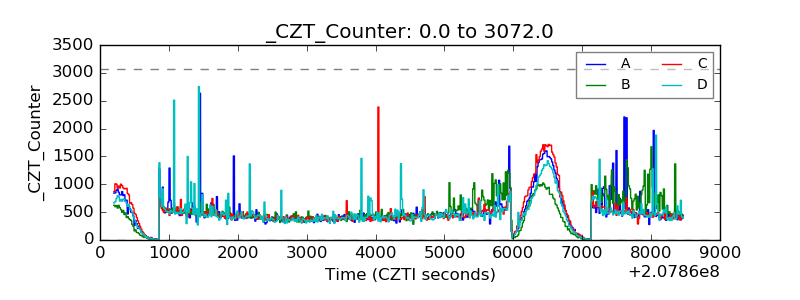 |
| +2.5 Volts monitor |  |
| +5 Volts monitor |  |
| _ROLL_ROT | 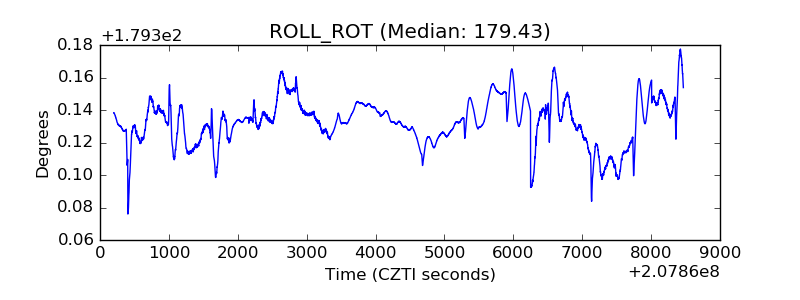 |
| _Roll_DEC | 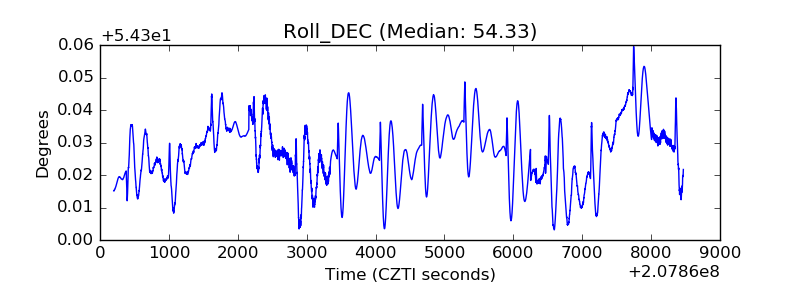 |
| _Roll_RA | 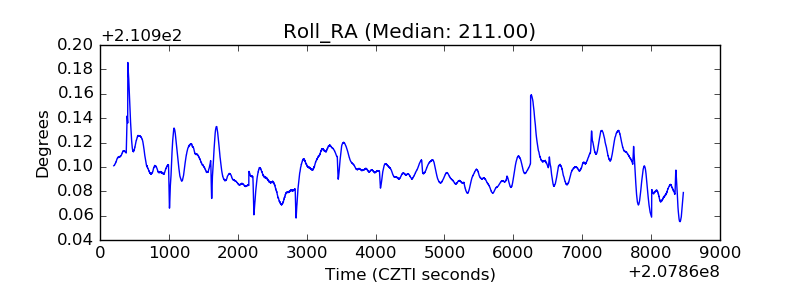 |
| Veto Counter | 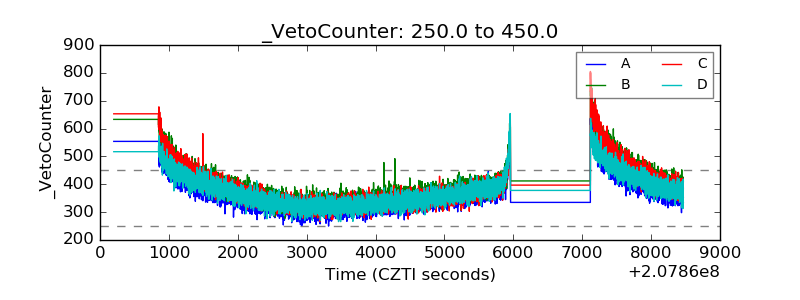 |