| Param | Original file | Final file |
|---|---|---|
| Filename | modeM0/AS1G05_233T10_9000000570_04586cztM0_level2.evt | modeM0/AS1G05_233T10_9000000570_04586cztM0_level2_quad_clean.evt |
| Size (bytes) | 47,004,480 | 12,712,320 |
| Size | 44.8 MB | 12.1 MB |
| Events in quadrant A | 424,519 | 101,692 |
| Events in quadrant B | 115,589 | 24,824 |
| Events in quadrant C | 436,608 | 91,505 |
| Events in quadrant D | 371,613 | 85,859 |
| Mode M9 | |||
|---|---|---|---|
| Quadrant | BADHDUFLAG | Total packets | Discarded packets |
| A | 0 | 12 | 0 |
| B | 0 | 19 | 0 |
| C | 0 | 12 | 0 |
| D | 0 | 20 | 0 |
| Mode M0 | |||
|---|---|---|---|
| Quadrant | BADHDUFLAG | Total packets | Discarded packets |
| A | 0 | 21466 | 19589 |
| B | 0 | 23299 | 22846 |
| C | 0 | 20879 | 18922 |
| D | 0 | 21805 | 20137 |
| Mode SS | |||
|---|---|---|---|
| Quadrant | BADHDUFLAG | Total packets | Discarded packets |
| A | 0 | 209 | 60 |
| B | 0 | 209 | 64 |
| C | 0 | 209 | 64 |
| D | 0 | 209 | 71 |
| Quadrant | Total seconds | Saturated seconds | Saturation percentage |
|---|---|---|---|
| A | 943 | 1 | 0.106045% |
| B | 229 | 4 | 1.746725% |
| C | 983 | 1 | 0.101729% |
| D | 839 | 2 | 0.238379% |
Noise dominated data is calculated using 1-second bins in cleaned event files. If a bin has >2000 counts, and if more than 50% of those come from <1% of pixels, then it is considered to be noise-dominated and hence unusable.
| Quadrant | # 1 sec bins | Bins with >0 counts | Bins with >2000 counts | High rate bins dominated by noise | Noise dominated (total time) | Noise dominated (detector-on time) | Marked lightcurve |
|---|---|---|---|---|---|---|---|
| A | 37372 | 1883 | 0 | 0 | 0.00% | 0.00% | 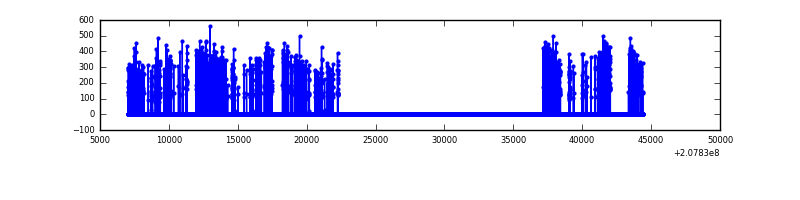 |
| B | 37372 | 453 | 0 | 0 | 0.00% | 0.00% | 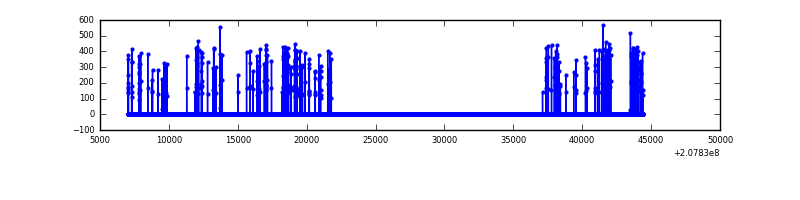 |
| C | 37372 | 1964 | 0 | 0 | 0.00% | 0.00% |  |
| D | 37180 | 1675 | 0 | 0 | 0.00% | 0.00% | 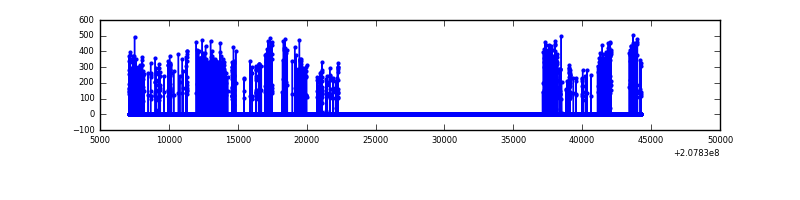 |
Top three noisy pixels from each quadrant. If the there are fewer than three noisy pixels in the level2.evt file, extra rows are filled as -1
| Pixel properties | Quadrant properties | ||||||
|---|---|---|---|---|---|---|---|
| Quadrant | DetID | PixID | Counts | Sigma | Mean | Median | Sigma |
| A | 0 | 118 | 1809 | 69.52 | 108 | 105 | 24.5 |
| A | 0 | 226 | 1323 | 49.69 | 108 | 105 | 24.5 |
| A | 0 | 13 | 1273 | 47.65 | 108 | 105 | 24.5 |
| B | 15 | 204 | 4402 | 613.11 | 26 | 26 | 7.1 |
| B | 14 | 167 | 3991 | 555.52 | 26 | 26 | 7.1 |
| B | 10 | 16 | 751 | 101.58 | 26 | 26 | 7.1 |
| C | 9 | 247 | 2202 | 76.15 | 110 | 110 | 27.5 |
| C | 8 | 128 | 989 | 31.99 | 110 | 110 | 27.5 |
| C | 13 | 61 | 966 | 31.16 | 110 | 110 | 27.5 |
| D | 2 | 136 | 5095 | 203.81 | 93 | 90 | 24.6 |
| D | 13 | 235 | 2627 | 103.31 | 93 | 90 | 24.6 |
| D | 13 | 25 | 2176 | 84.94 | 93 | 90 | 24.6 |
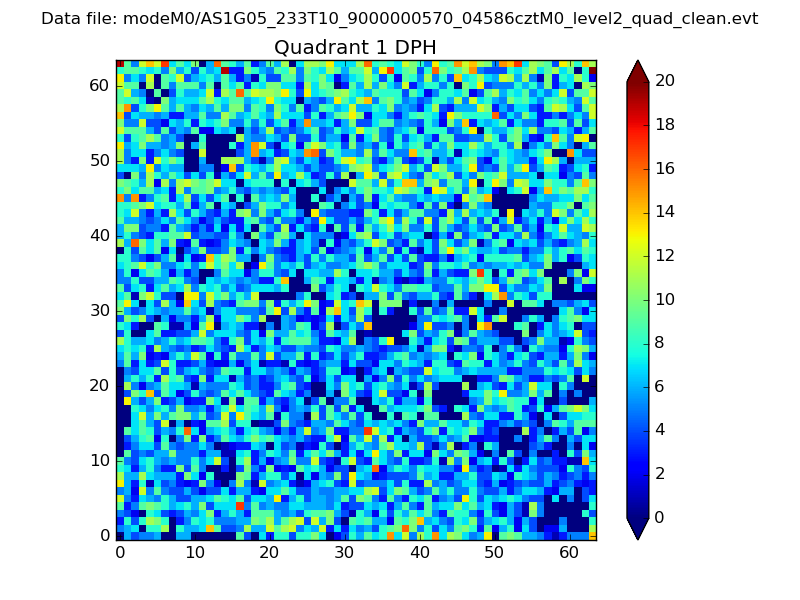
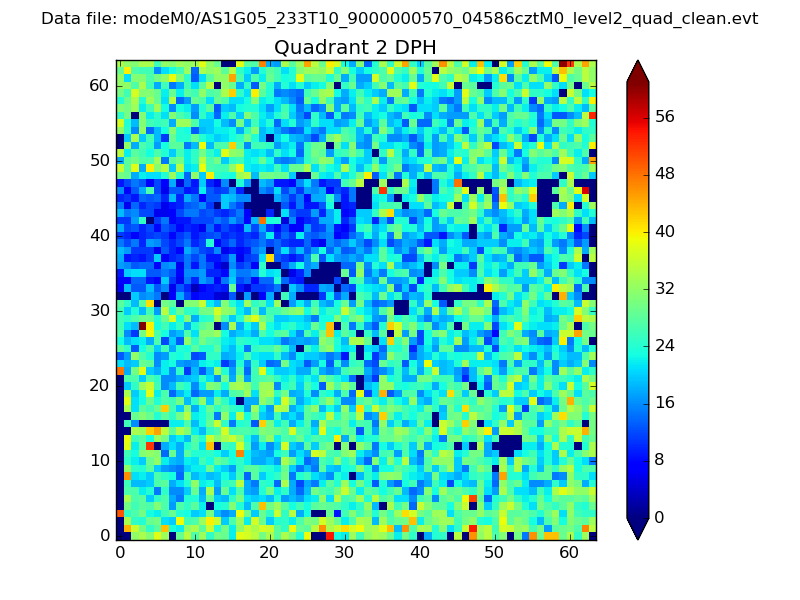
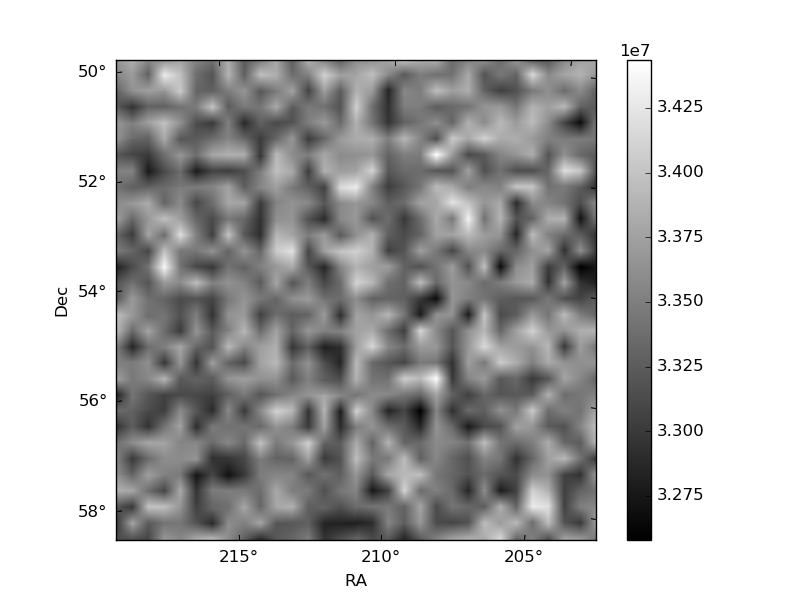
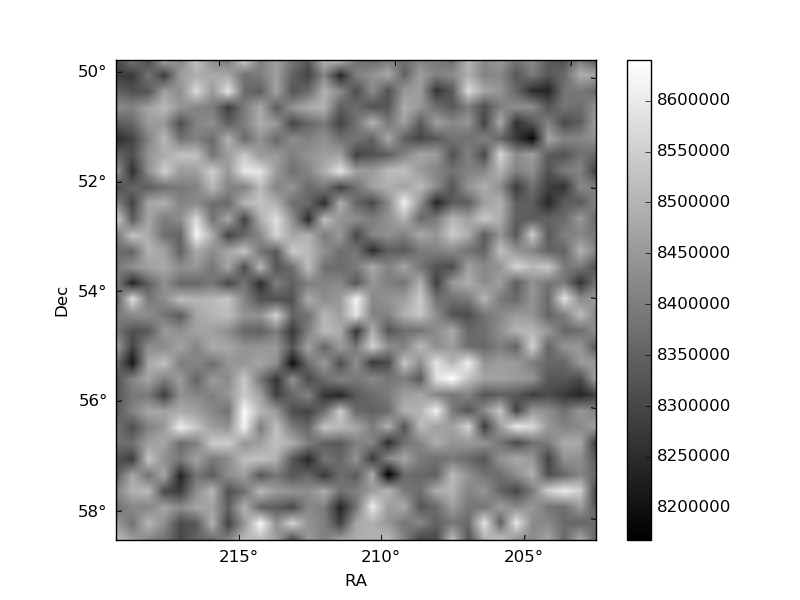
Histogram calculated using DETX and DETY for each event in the final _common_clean file
| Quadrant A | 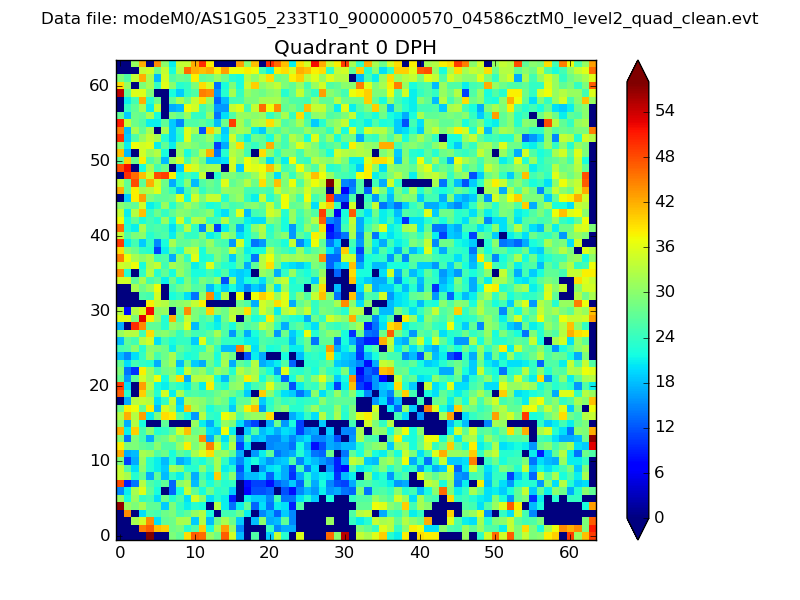 |
 |
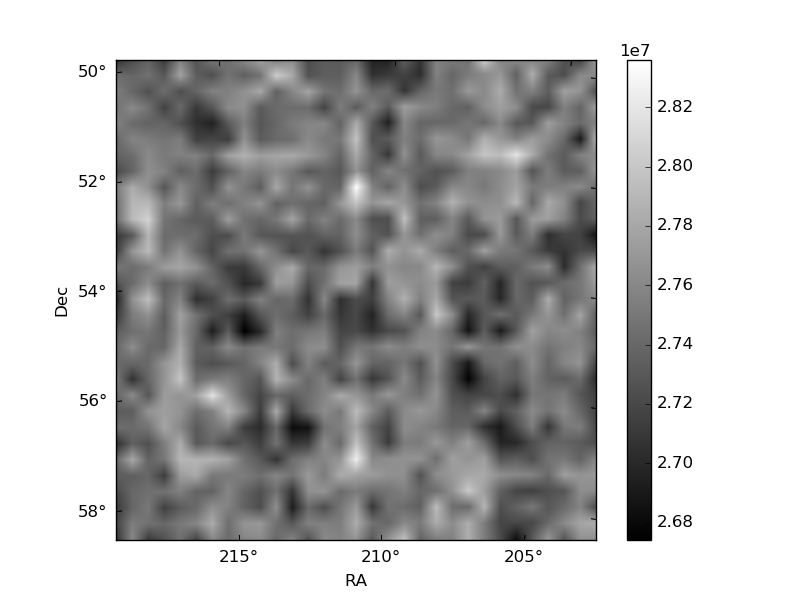
Quadrant B |
|---|---|---|---|
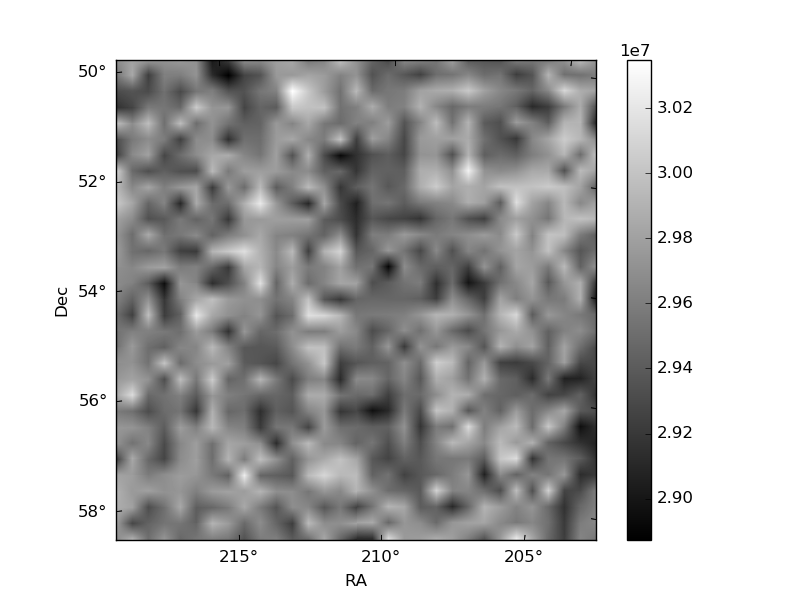
| Quadrant D | 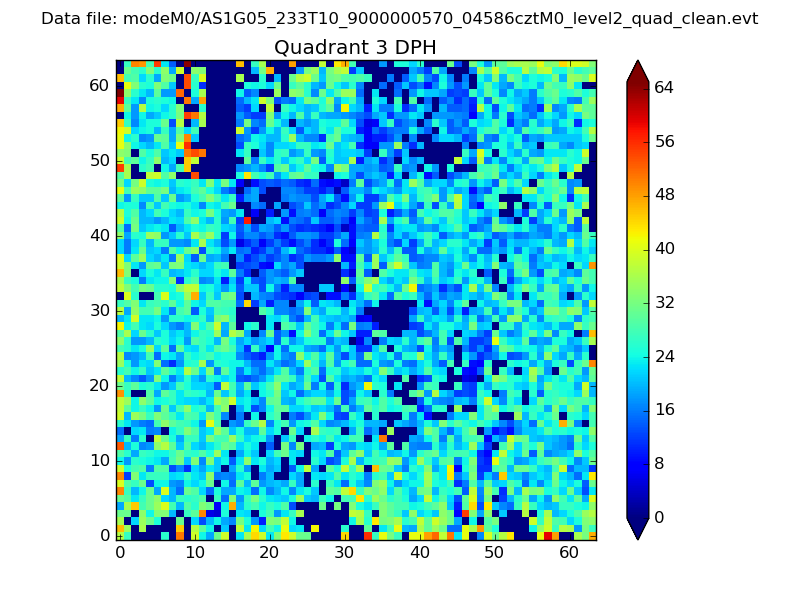 |
 |
Quadrant C |
| Plot type | Count rate plots | Images |
|---|---|---|
| Comparison with Poisson distribution Blue bars denote a histogram of data divided into 1 sec bins. Red curve is a Poisson curve with rate = median count rate of data. |
 |
 |
| Quadrant-wise count rates Data is divided into 100 sec bins |
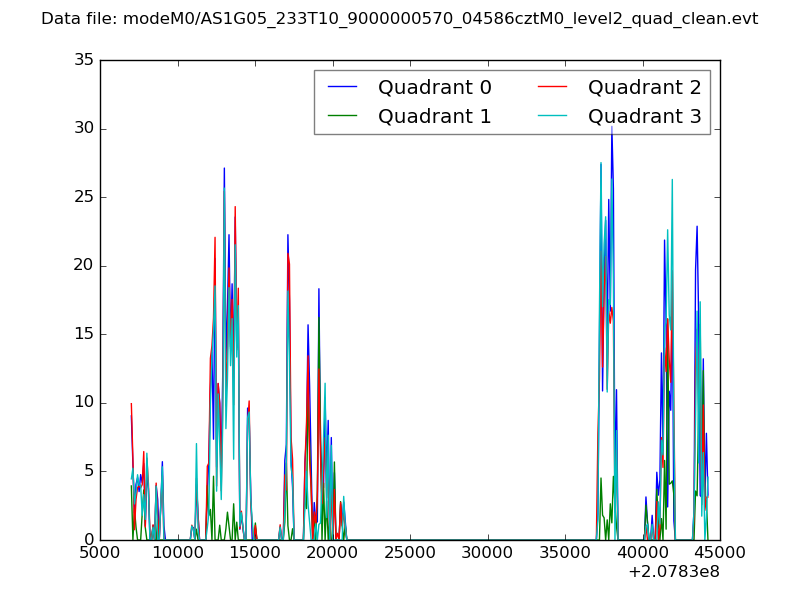 |
|
| Module-wise count rates for Quadrant A Data is divided into 100 sec bins |
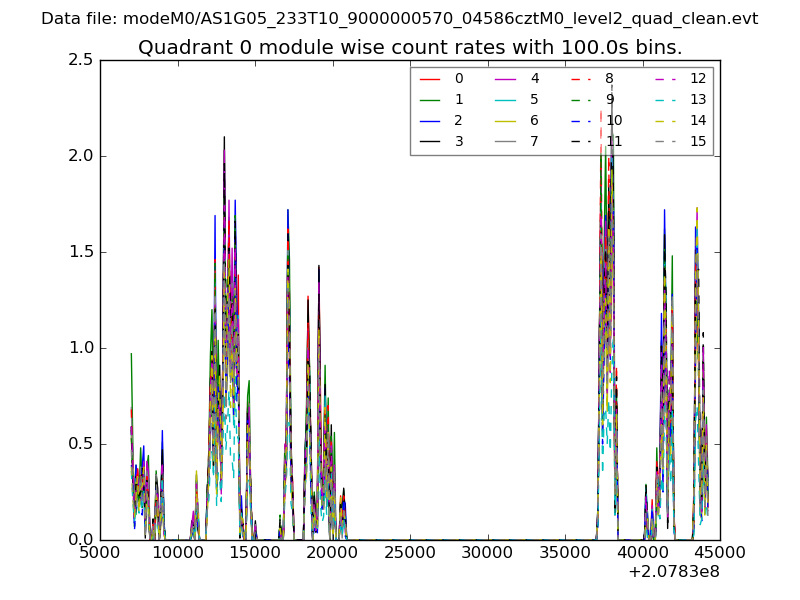 |
 |
| Module-wise count rates for Quadrant B Data is divided into 100 sec bins |
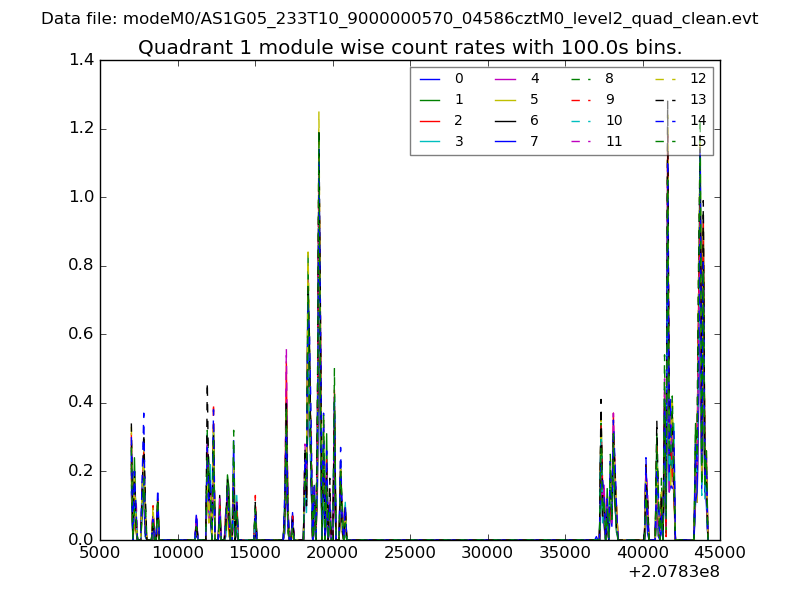 |
 |
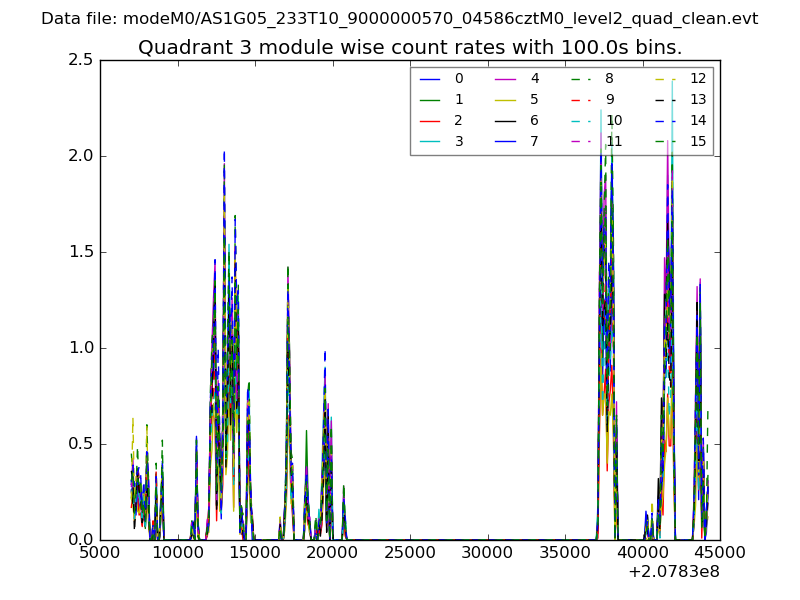
| Module-wise count rates for Quadrant C Data is divided into 100 sec bins |
 |
 |
| Module-wise count rates for Quadrant D Data is divided into 100 sec bins |
 |
 |
| Parameter | Plot |
|---|---|
| CZT HV Monitor |  |
| D_VDD | 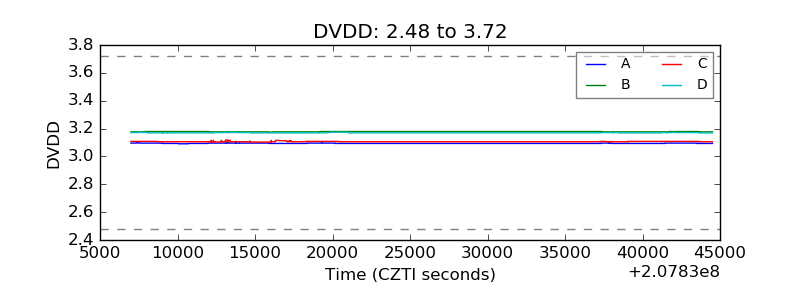 |
| Temperature 1 | 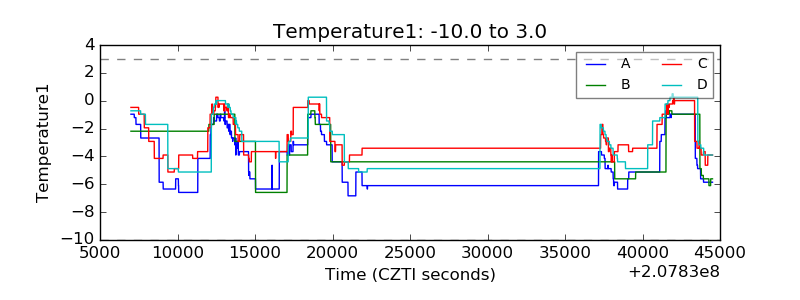 |
| Veto HV Monitor | 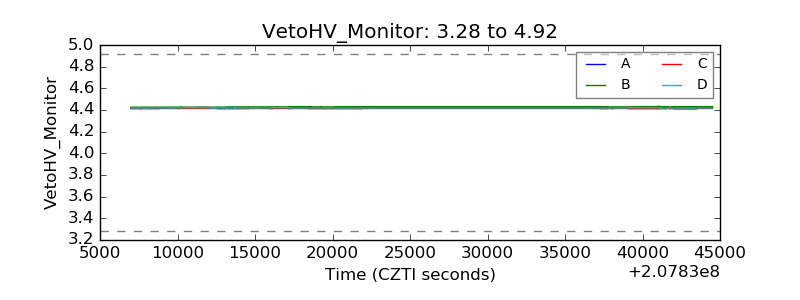 |
| Veto LLD | 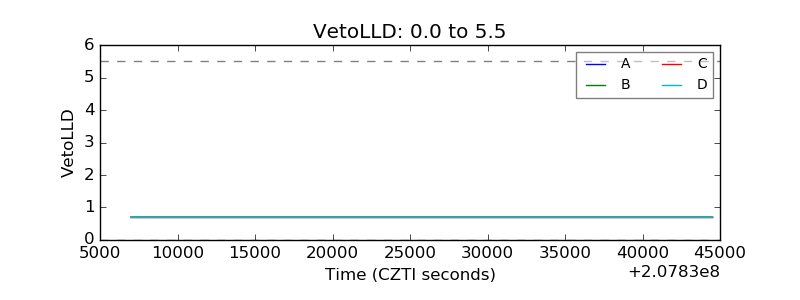 |
| Alpha Counter | 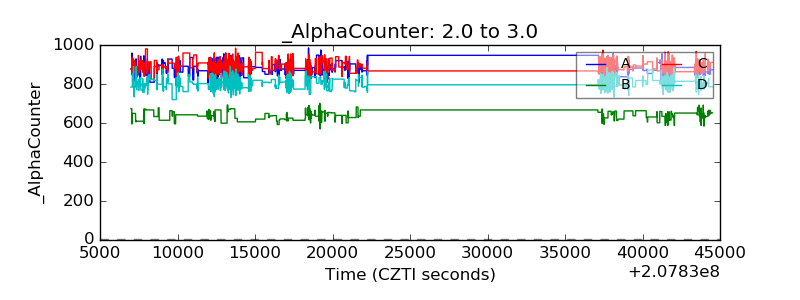 |
| _CPM_Rate | 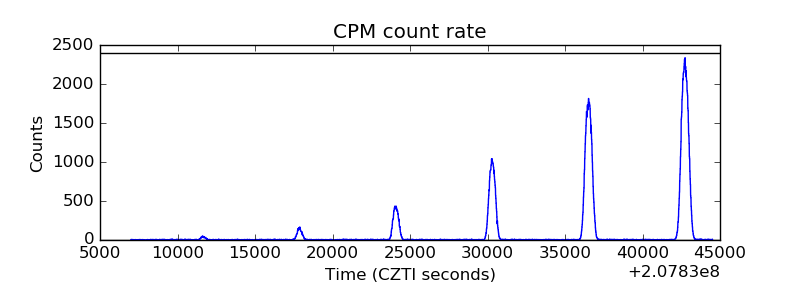 |
| CZT Counter | 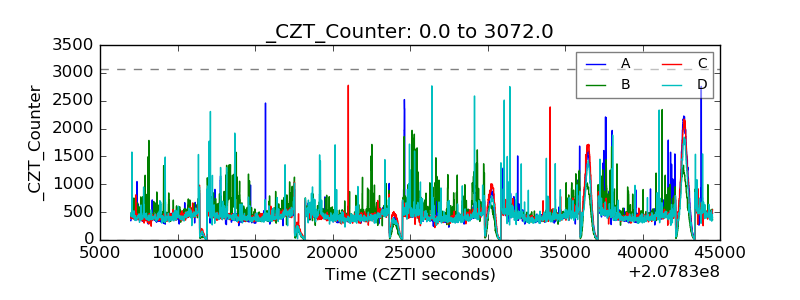 |
| +2.5 Volts monitor |  |
| +5 Volts monitor |  |
| _ROLL_ROT | 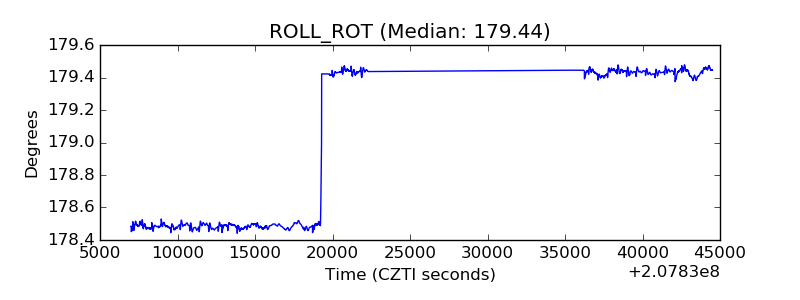 |
| _Roll_DEC | 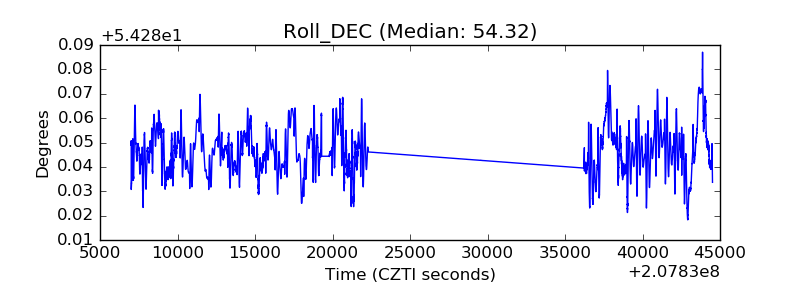 |
| _Roll_RA | 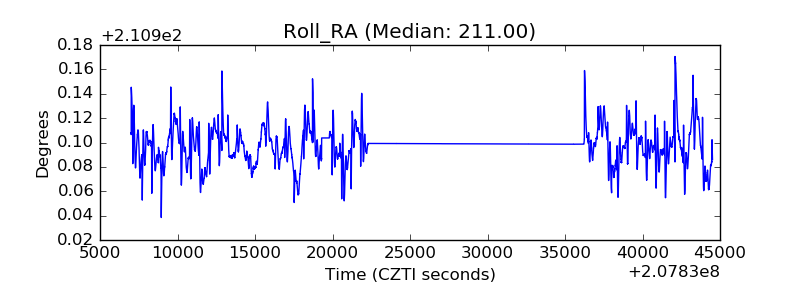 |
| Veto Counter |  |