| Param | Original file | Final file |
|---|---|---|
| Filename | modeM0/AS1G05_233T10_9000000570_04588cztM0_level2.evt | modeM0/AS1G05_233T10_9000000570_04588cztM0_level2_quad_clean.evt |
| Size (bytes) | 186,094,080 | 24,658,560 |
| Size | 177.5 MB | 23.5 MB |
| Events in quadrant A | 1,258,535 | 137,281 |
| Events in quadrant B | 1,420,503 | 140,925 |
| Events in quadrant C | 1,381,224 | 137,272 |
| Events in quadrant D | 1,383,305 | 130,673 |
| Mode M9 | |||
|---|---|---|---|
| Quadrant | BADHDUFLAG | Total packets | Discarded packets |
| A | 0 | 3 | 0 |
| B | 0 | 3 | 0 |
| C | 0 | 3 | 0 |
| D | 0 | 4 | 0 |
| Mode M0 | |||
|---|---|---|---|
| Quadrant | BADHDUFLAG | Total packets | Discarded packets |
| A | 0 | 5688 | 1 |
| B | 0 | 6024 | 1 |
| C | 0 | 5795 | 1 |
| D | 0 | 6131 | 1 |
| Mode SS | |||
|---|---|---|---|
| Quadrant | BADHDUFLAG | Total packets | Discarded packets |
| A | 0 | 56 | 0 |
| B | 0 | 56 | 0 |
| C | 0 | 56 | 0 |
| D | 0 | 56 | 0 |
| Quadrant | Total seconds | Saturated seconds | Saturation percentage |
|---|---|---|---|
| A | 2795 | 4 | 0.143113% |
| B | 2795 | 5 | 0.178891% |
| C | 2795 | 4 | 0.143113% |
| D | 2795 | 18 | 0.644007% |
Noise dominated data is calculated using 1-second bins in cleaned event files. If a bin has >2000 counts, and if more than 50% of those come from <1% of pixels, then it is considered to be noise-dominated and hence unusable.
| Quadrant | # 1 sec bins | Bins with >0 counts | Bins with >2000 counts | High rate bins dominated by noise | Noise dominated (total time) | Noise dominated (detector-on time) | Marked lightcurve |
|---|---|---|---|---|---|---|---|
| A | 2795 | 2795 | 0 | 0 | 0.00% | 0.00% | 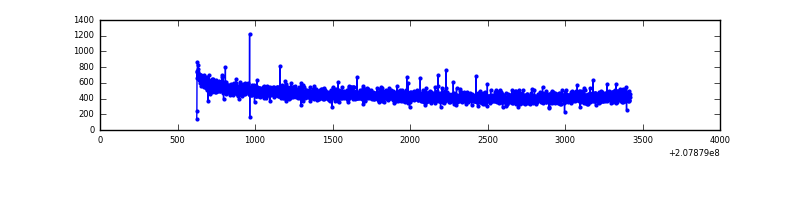 |
| B | 2795 | 2795 | 2 | 2 | 0.07% | 0.07% | 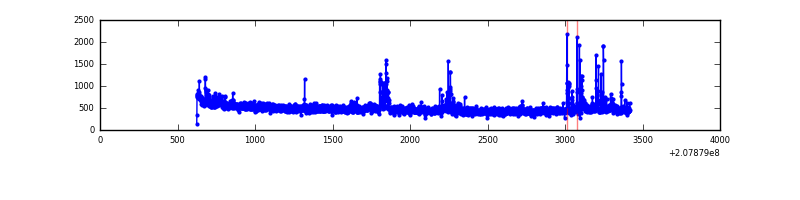 |
| C | 2795 | 2795 | 1 | 1 | 0.04% | 0.04% | 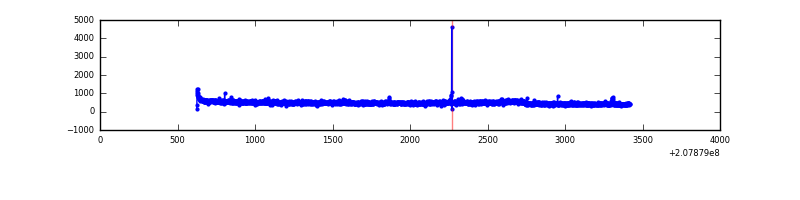 |
| D | 2795 | 2795 | 7 | 7 | 0.25% | 0.25% | 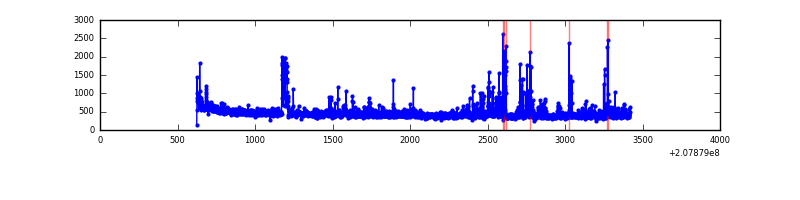 |
Top three noisy pixels from each quadrant. If the there are fewer than three noisy pixels in the level2.evt file, extra rows are filled as -1
| Pixel properties | Quadrant properties | ||||||
|---|---|---|---|---|---|---|---|
| Quadrant | DetID | PixID | Counts | Sigma | Mean | Median | Sigma |
| A | 0 | 226 | 3413 | 45.97 | 326 | 320 | 67.3 |
| A | 12 | 194 | 3210 | 42.95 | 326 | 320 | 67.3 |
| A | 13 | 254 | 1135 | 12.11 | 326 | 320 | 67.3 |
| B | 10 | 16 | 88565 | 1388.34 | 333 | 327 | 63.6 |
| B | 15 | 204 | 19686 | 304.6 | 333 | 327 | 63.6 |
| B | 12 | 18 | 8104 | 122.36 | 333 | 327 | 63.6 |
| C | 14 | 48 | 118306 | 1579.38 | 318 | 319 | 74.7 |
| C | 9 | 54 | 8287 | 106.66 | 318 | 319 | 74.7 |
| C | 9 | 247 | 4593 | 57.21 | 318 | 319 | 74.7 |
| D | 12 | 233 | 65937 | 856.48 | 310 | 301 | 76.6 |
| D | 12 | 110 | 58561 | 760.23 | 310 | 301 | 76.6 |
| D | 13 | 235 | 45197 | 585.85 | 310 | 301 | 76.6 |
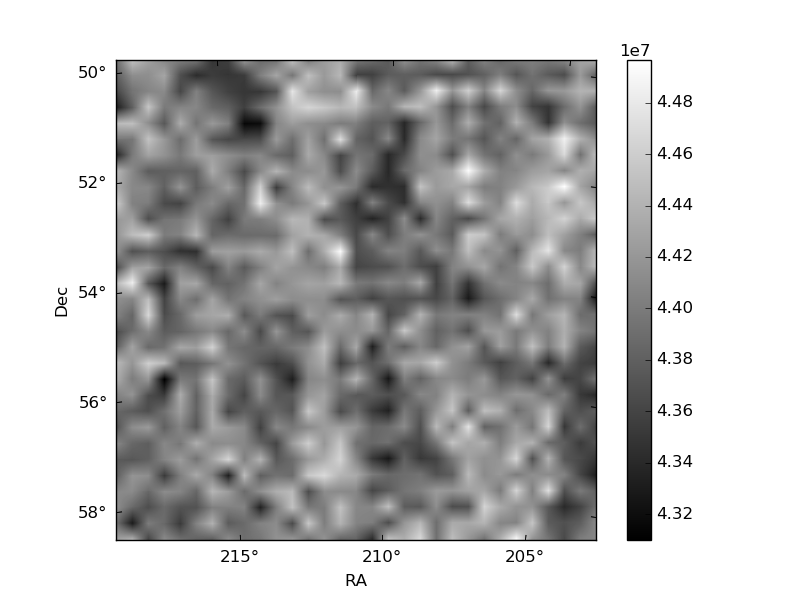
Histogram calculated using DETX and DETY for each event in the final _common_clean file
| Quadrant A | 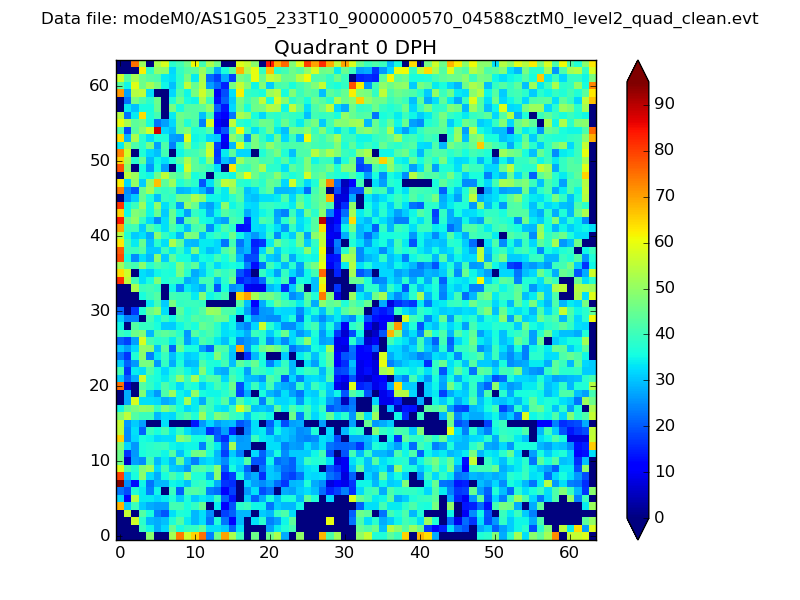 |
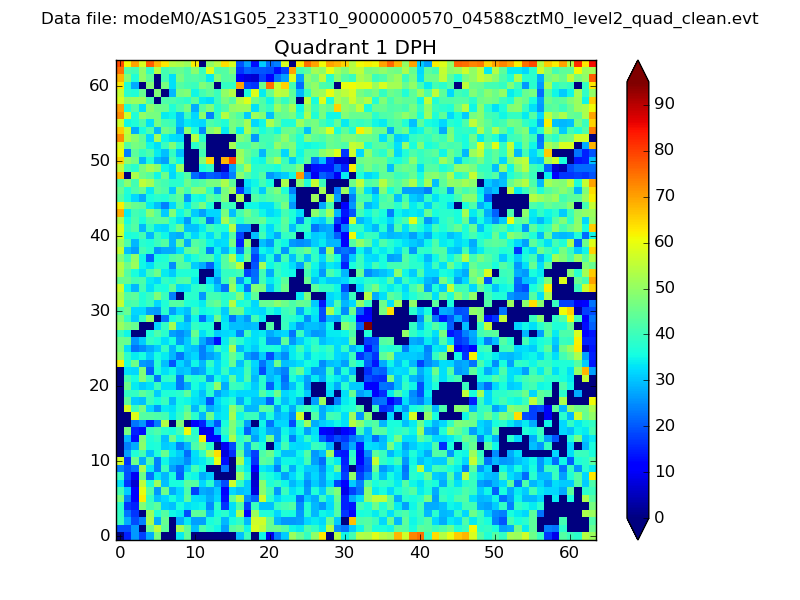 |
Quadrant B |
|---|---|---|---|
| Quadrant D | 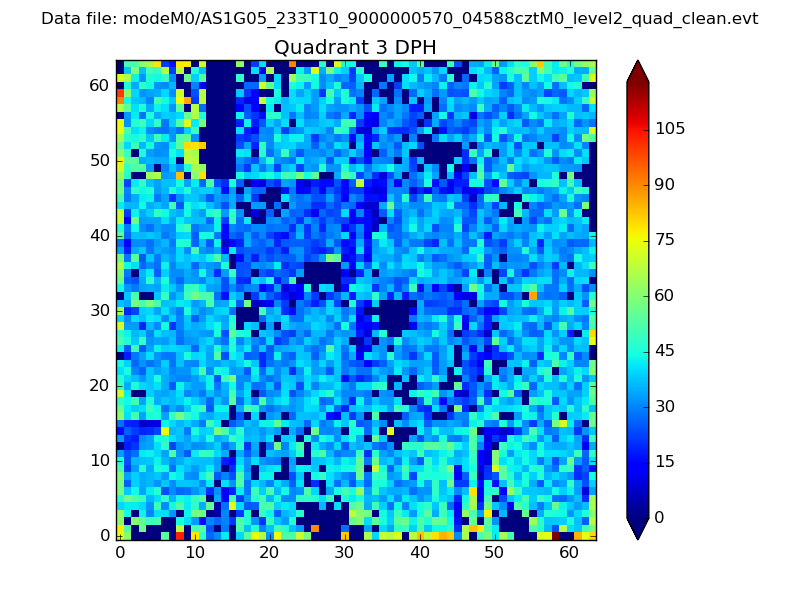 |
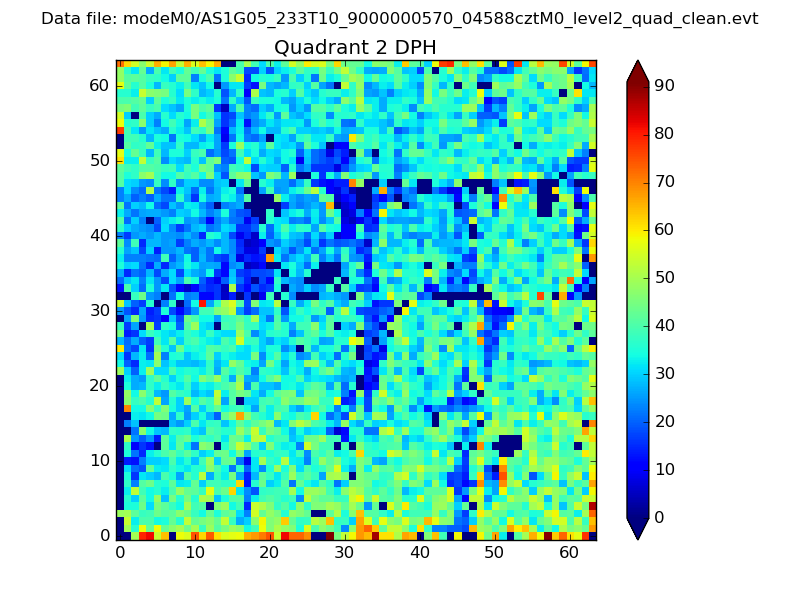 |
Quadrant C |
| Plot type | Count rate plots | Images |
|---|---|---|
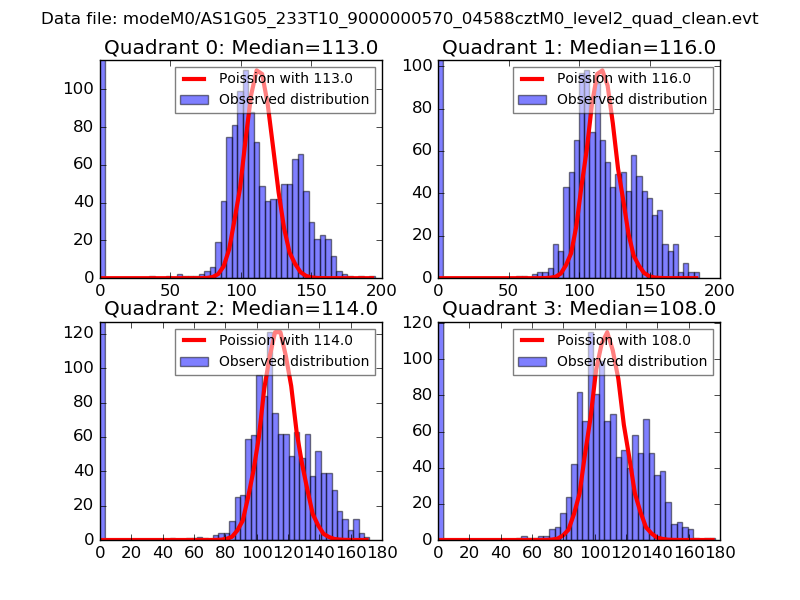
| Comparison with Poisson distribution Blue bars denote a histogram of data divided into 1 sec bins. Red curve is a Poisson curve with rate = median count rate of data. |
 |
 |
| Quadrant-wise count rates Data is divided into 100 sec bins |
 |
|
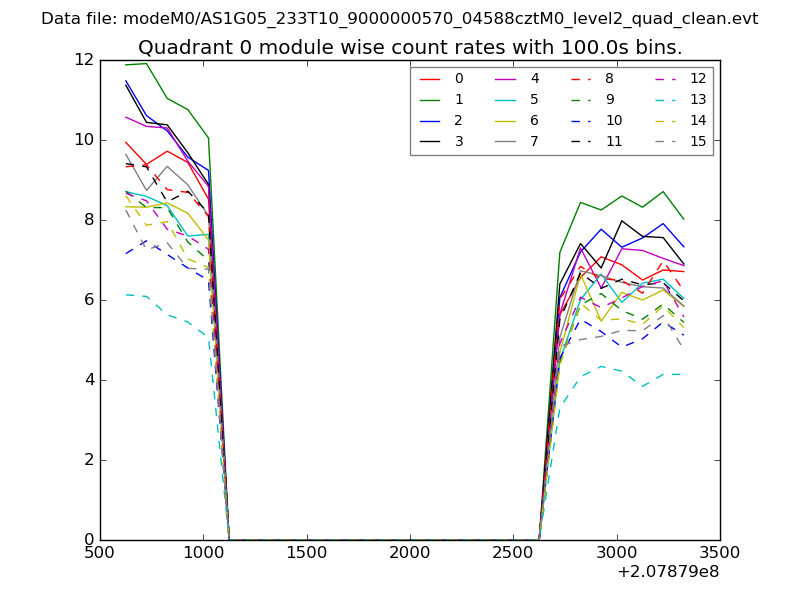
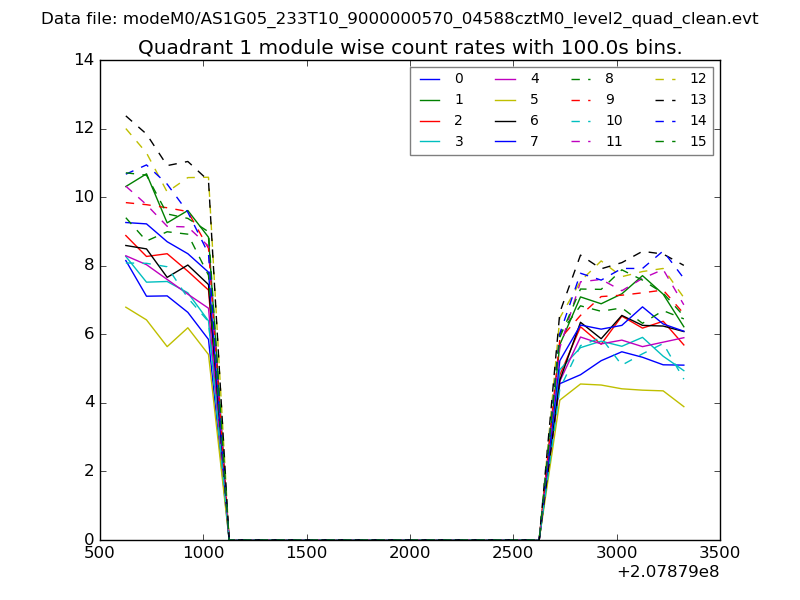
| Module-wise count rates for Quadrant A Data is divided into 100 sec bins |
 |
 |
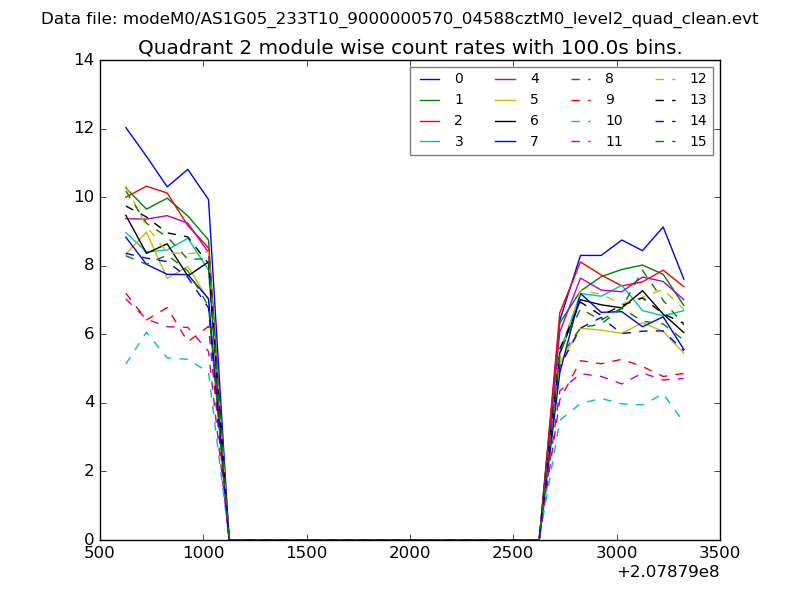
| Module-wise count rates for Quadrant B Data is divided into 100 sec bins |
 |
 |
| Module-wise count rates for Quadrant C Data is divided into 100 sec bins |
 |
 |
| Module-wise count rates for Quadrant D Data is divided into 100 sec bins |
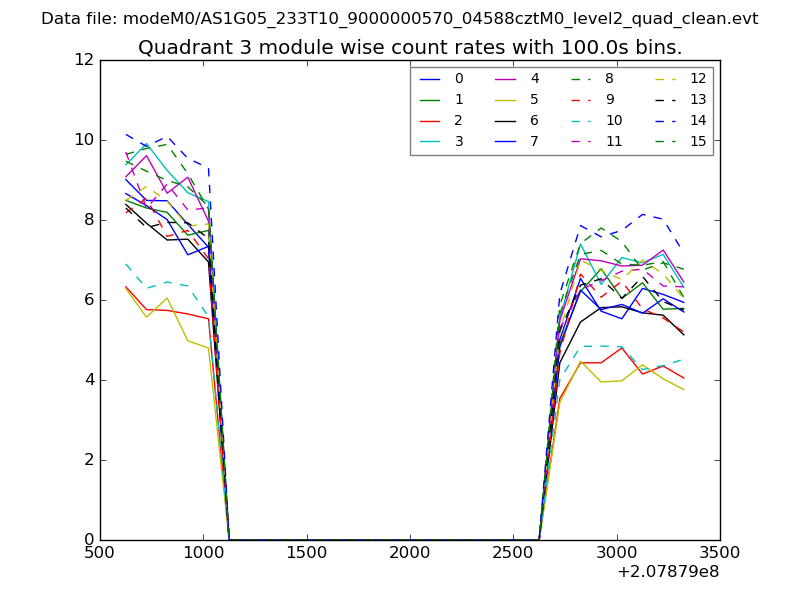 |
 |
| Parameter | Plot |
|---|---|
| CZT HV Monitor | 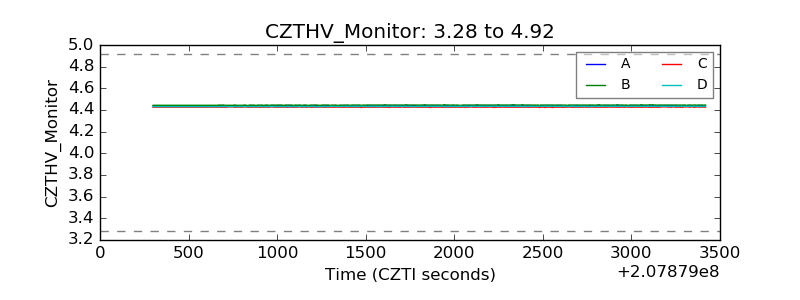 |
| D_VDD | 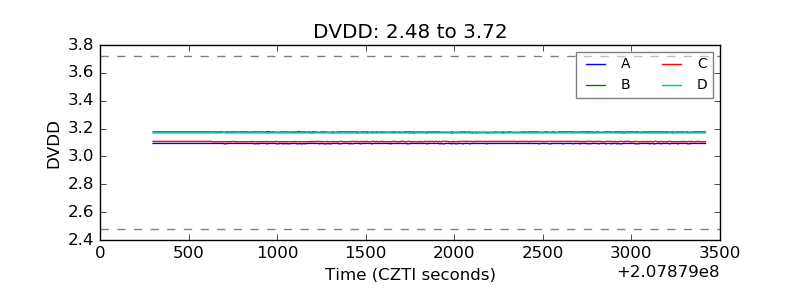 |
| Temperature 1 | 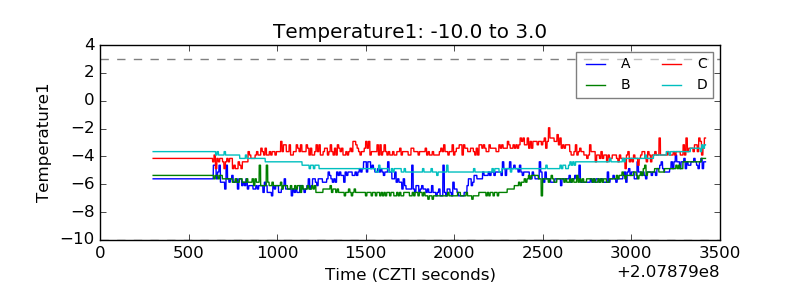 |
| Veto HV Monitor | 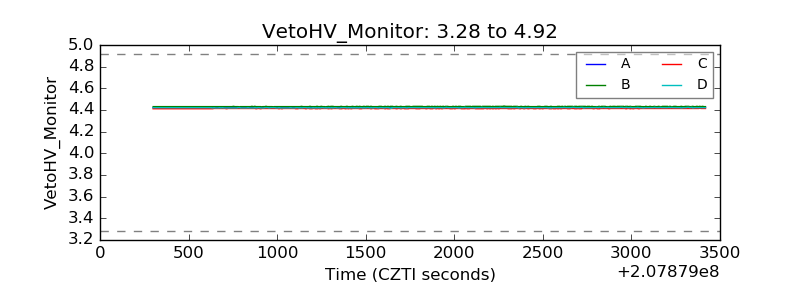 |
| Veto LLD | 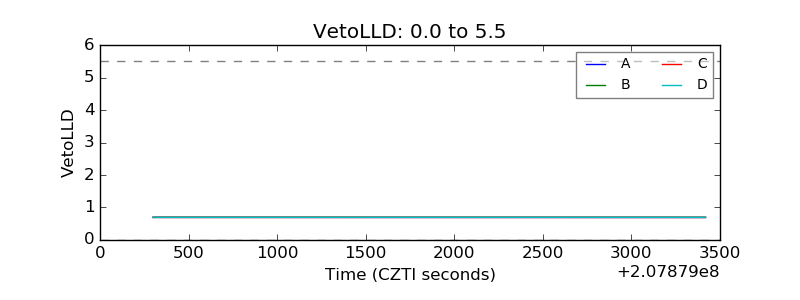 |
| Alpha Counter | 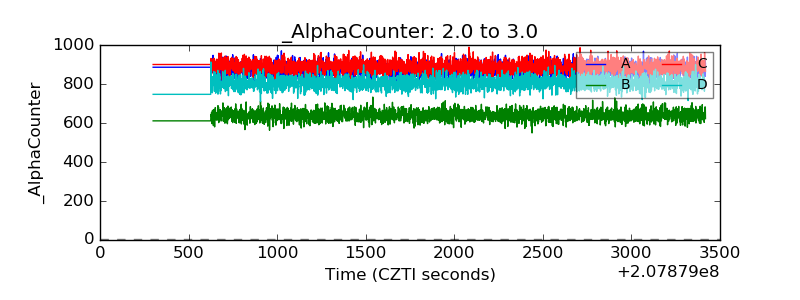 |
| _CPM_Rate | 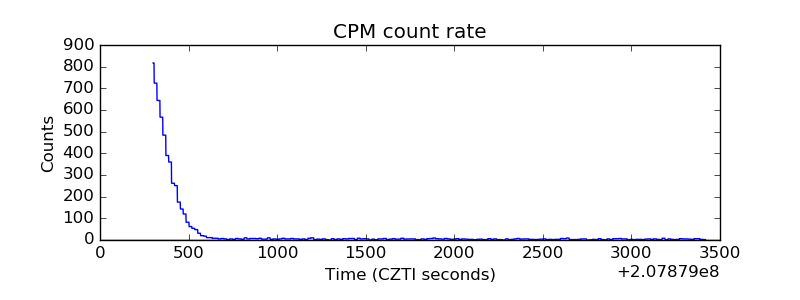 |
| CZT Counter | 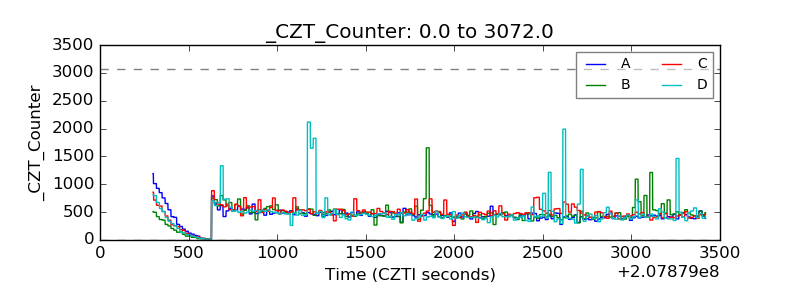 |
| +2.5 Volts monitor |  |
| +5 Volts monitor |  |
| _ROLL_ROT | 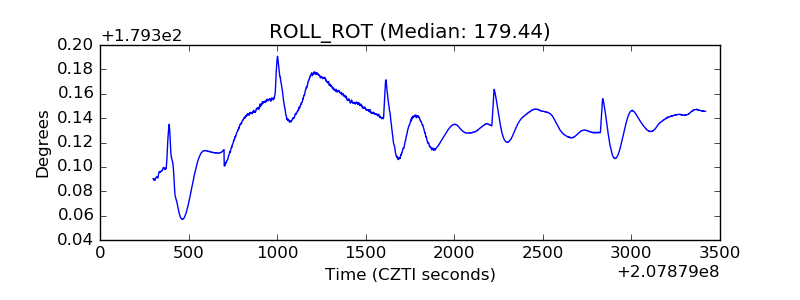 |
| _Roll_DEC | 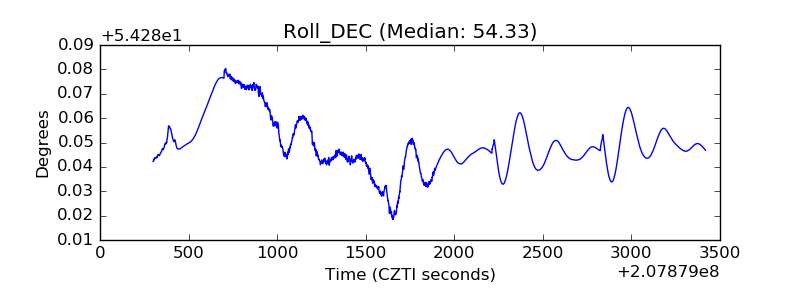 |
| _Roll_RA | 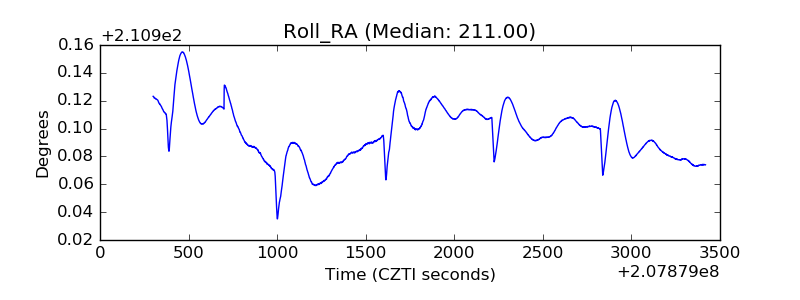 |
| Veto Counter | 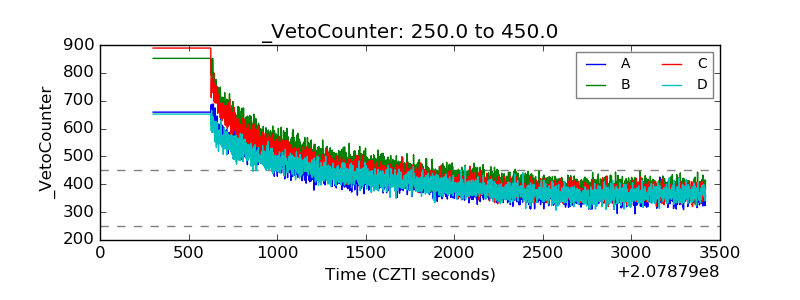 |