| Param | Original file | Final file |
|---|---|---|
| Filename | modeM0/AS1G05_167T02_9000000574cztM0_level2.fits | modeM0/AS1G05_167T02_9000000574cztM0_level2_quad_clean.evt |
| Size (bytes) | 298,661,760 | 206,363,520 |
| Size | 284.8 MB | 196.8 MB |
| Events in quadrant A | 1,811,346 | 1,055,758 |
| Events in quadrant B | 1,765,956 | 1,075,638 |
| Events in quadrant C | 1,775,912 | 1,035,198 |
| Events in quadrant D | 1,523,374 | 912,498 |
| Mode M0 | |||
|---|---|---|---|
| Quadrant | BADHDUFLAG | Total packets | Discarded packets |
| A | 0 | 65683 | 0 |
| B | 0 | 66910 | 0 |
| C | 0 | 78590 | 0 |
| D | 0 | 72881 | 0 |
| Mode SS | |||
|---|---|---|---|
| Quadrant | BADHDUFLAG | Total packets | Discarded packets |
| A | 0 | 640 | 0 |
| B | 0 | 640 | 0 |
| C | 0 | 640 | 0 |
| D | 0 | 640 | 0 |
| Mode M9 | |||
|---|---|---|---|
| Quadrant | BADHDUFLAG | Total packets | Discarded packets |
| A | 0 | 75 | 0 |
| B | 0 | 75 | 0 |
| C | 0 | 75 | 0 |
| D | 0 | 75 | 0 |
| Quadrant | Total seconds | Saturated seconds | Saturation percentage |
|---|---|---|---|
| A | 31569 | 203 | 0.643036% |
| B | 31569 | 253 | 0.801419% |
| C | 31569 | 163 | 0.516329% |
| D | 31569 | 630 | 1.995629% |
Noise dominated data is calculated using 1-second bins in cleaned event files. If a bin has >2000 counts, and if more than 50% of those come from <1% of pixels, then it is considered to be noise-dominated and hence unusable.
| Quadrant | # 1 sec bins | Bins with >0 counts | Bins with >2000 counts | High rate bins dominated by noise | Noise dominated (total time) | Noise dominated (detector-on time) | Marked lightcurve |
|---|---|---|---|---|---|---|---|
| A | 38929 | 31569 | 0 | 0 | 0.00% | 0.00% | 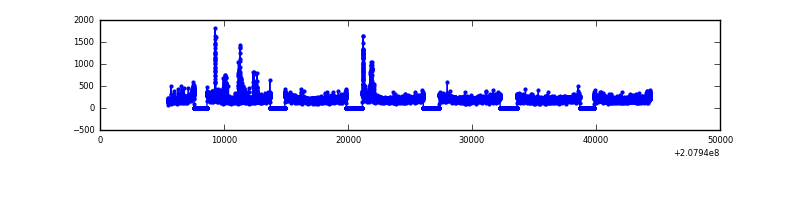 |
| B | 38929 | 31570 | 0 | 0 | 0.00% | 0.00% |  |
| C | 38929 | 31569 | 0 | 0 | 0.00% | 0.00% |  |
| D | 38929 | 31568 | 0 | 0 | 0.00% | 0.00% | 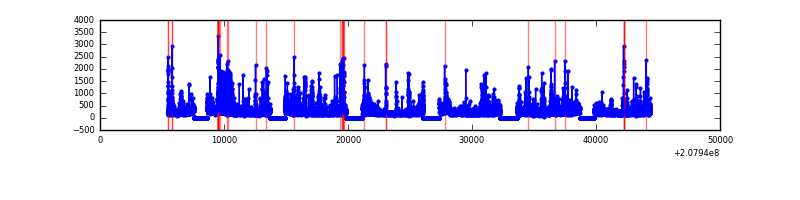 |
Top three noisy pixels from each quadrant. If the there are fewer than three noisy pixels in the level2.evt file, extra rows are filled as -1
| Pixel properties | Quadrant properties | ||||||
|---|---|---|---|---|---|---|---|
| Quadrant | DetID | PixID | Counts | Sigma | Mean | Median | Sigma |
| A | 14 | 188 | 1731 | 10.56 | 470 | 440 | 122.3 |
| A | 0 | 29 | 1724 | 10.5 | 470 | 440 | 122.3 |
| A | 7 | 110 | 1515 | 8.79 | 470 | 440 | 122.3 |
| B | 2 | 9 | 1481 | 10.87 | 465 | 442 | 95.6 |
| B | 12 | 226 | 1243 | 8.38 | 465 | 442 | 95.6 |
| B | 5 | 128 | 1235 | 8.29 | 465 | 442 | 95.6 |
| C | 1 | 81 | 1300 | 6.76 | 469 | 435 | 127.9 |
| C | 1 | 80 | 1296 | 6.73 | 469 | 435 | 127.9 |
| C | 12 | 241 | 1261 | 6.46 | 469 | 435 | 127.9 |
| D | 11 | 82 | 1168 | 6.62 | 433 | 395 | 116.8 |
| D | 10 | 189 | 1119 | 6.2 | 433 | 395 | 116.8 |
| D | 6 | 231 | 1105 | 6.08 | 433 | 395 | 116.8 |
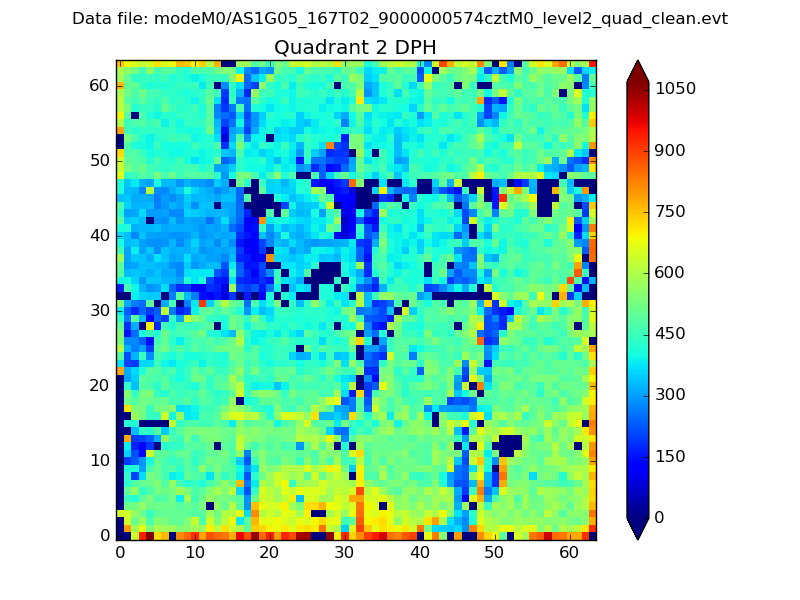
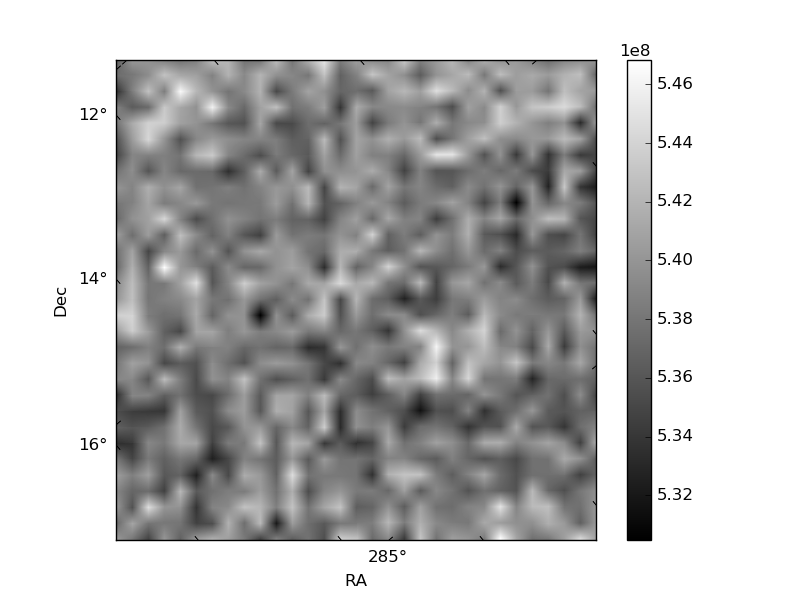
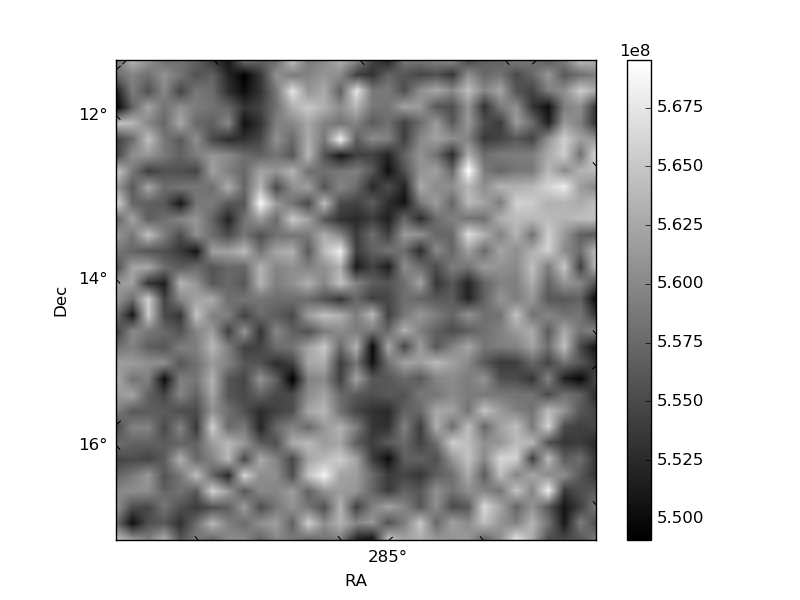
Histogram calculated using DETX and DETY for each event in the final _common_clean file
| Quadrant A | 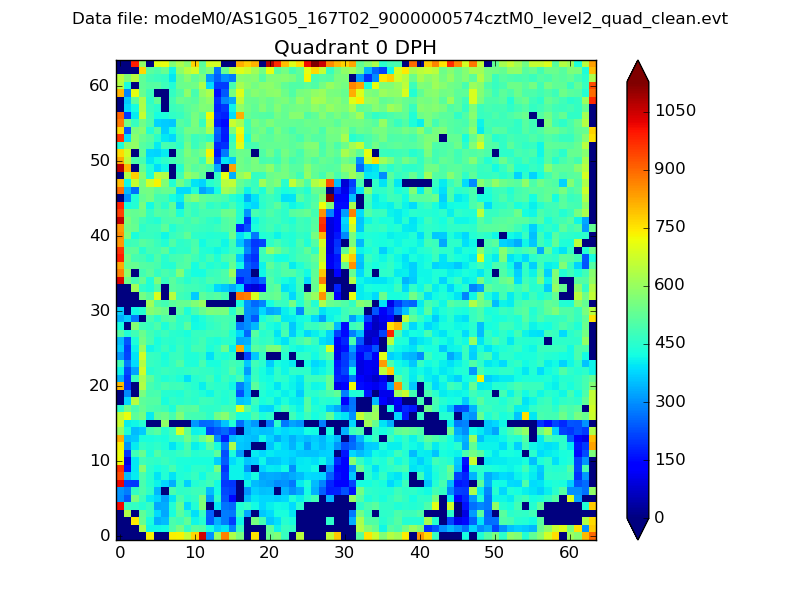 |
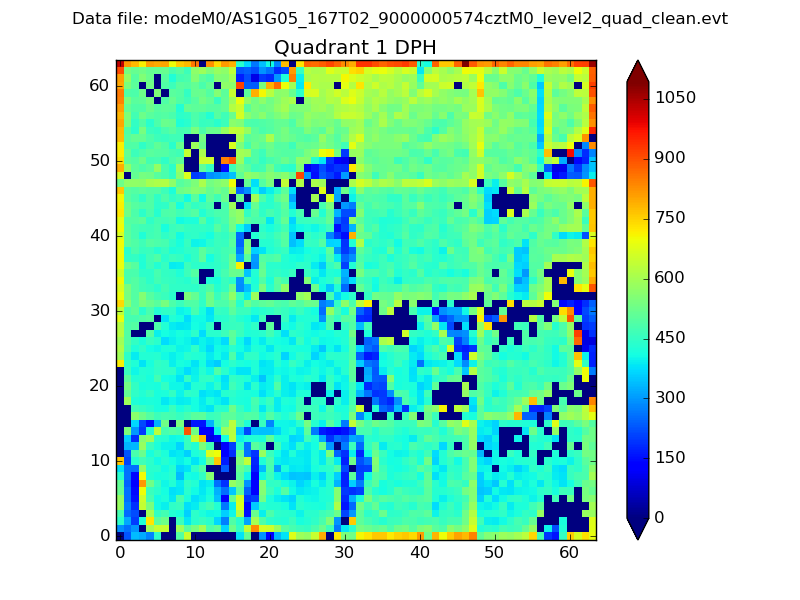 |
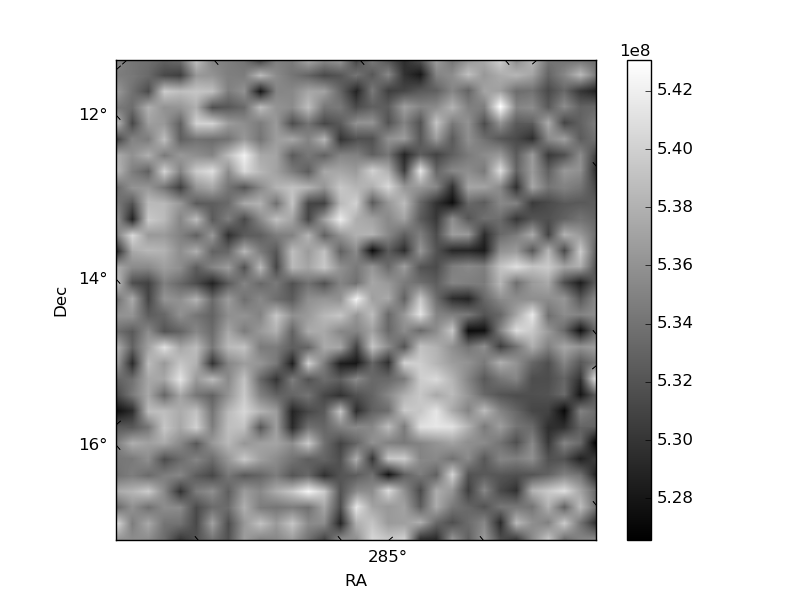
Quadrant B |
|---|---|---|---|
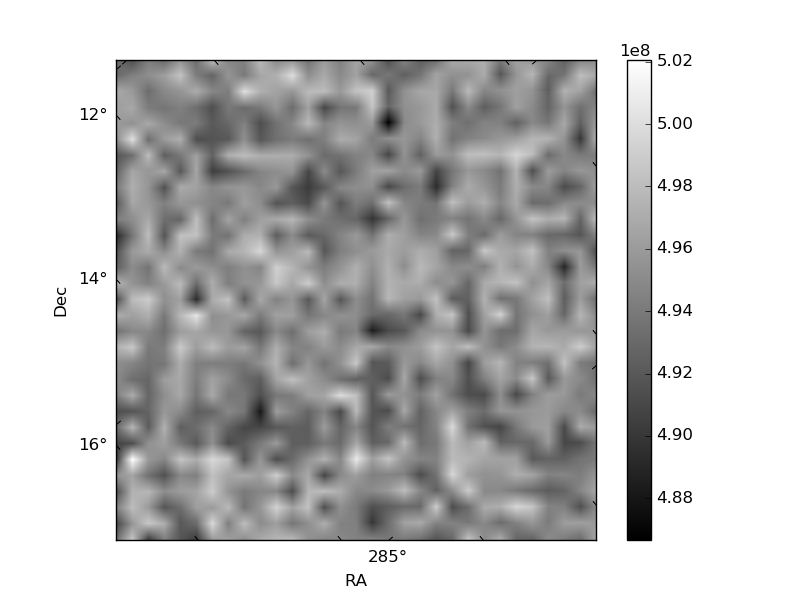
| Quadrant D | 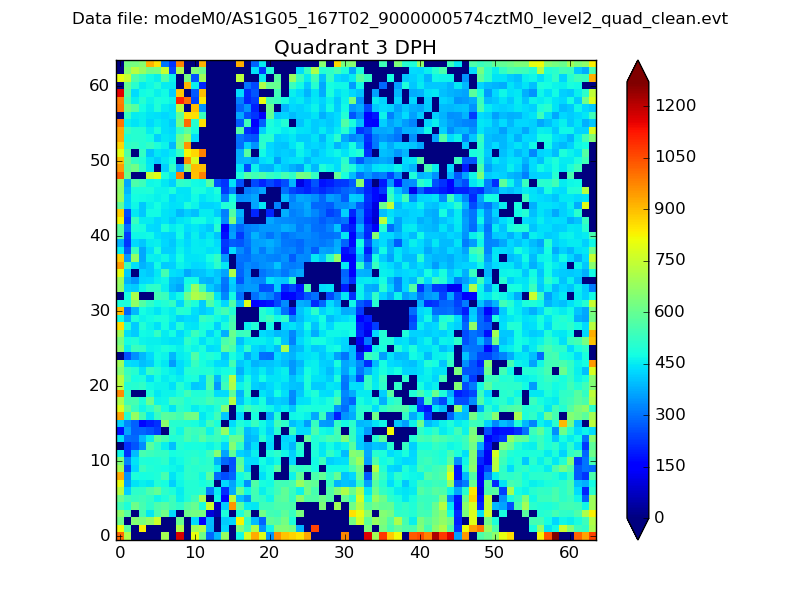 |
 |
Quadrant C |
| Plot type | Count rate plots | Images |
|---|---|---|
| Comparison with Poisson distribution Blue bars denote a histogram of data divided into 1 sec bins. Red curve is a Poisson curve with rate = median count rate of data. |
 |
 |
| Quadrant-wise count rates Data is divided into 100 sec bins |
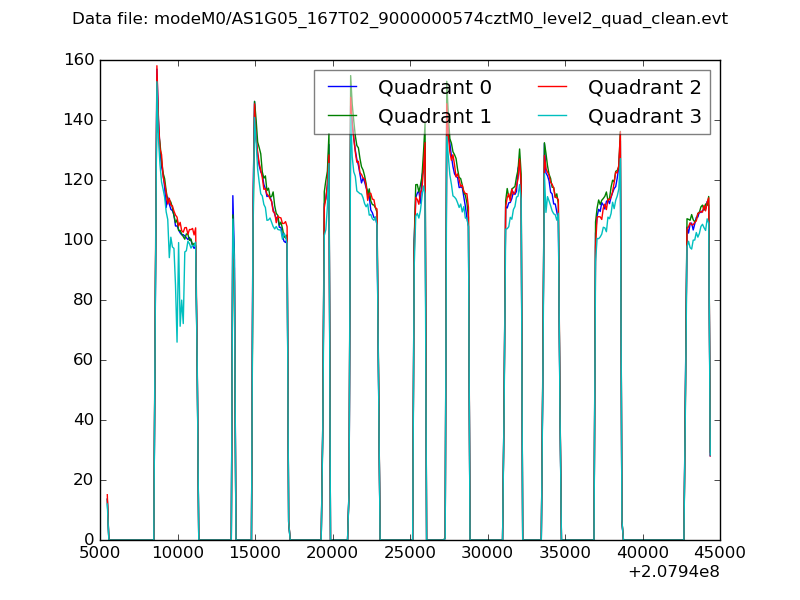 |
|
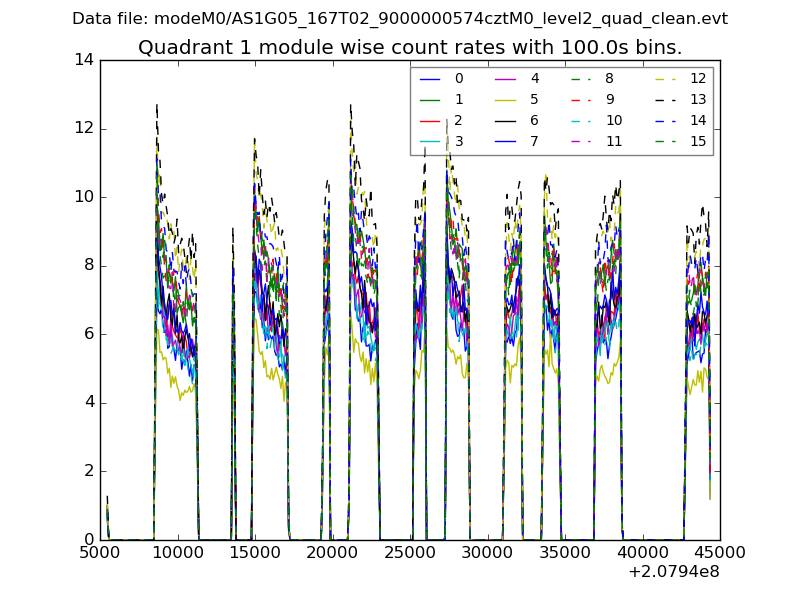
| Module-wise count rates for Quadrant A Data is divided into 100 sec bins |
 |
 |
| Module-wise count rates for Quadrant B Data is divided into 100 sec bins |
 |
 |
| Module-wise count rates for Quadrant C Data is divided into 100 sec bins |
 |
 |
| Module-wise count rates for Quadrant D Data is divided into 100 sec bins |
 |
 |
| Parameter | Plot |
|---|---|
| CZT HV Monitor | 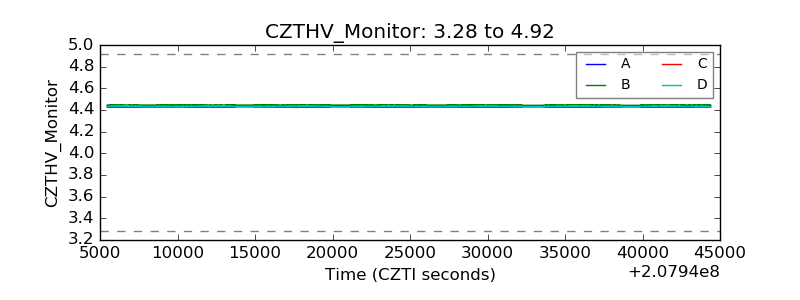 |
| D_VDD | 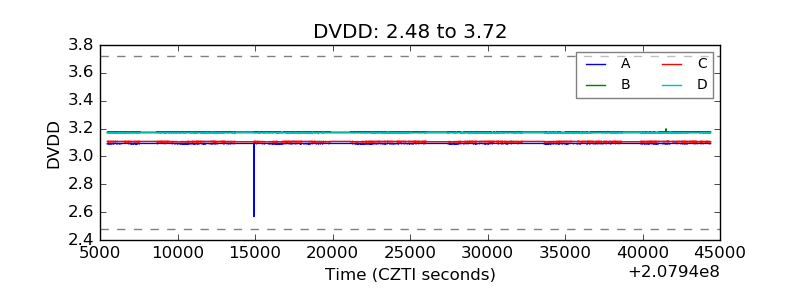 |
| Temperature 1 |  |
| Veto HV Monitor |  |
| Veto LLD | 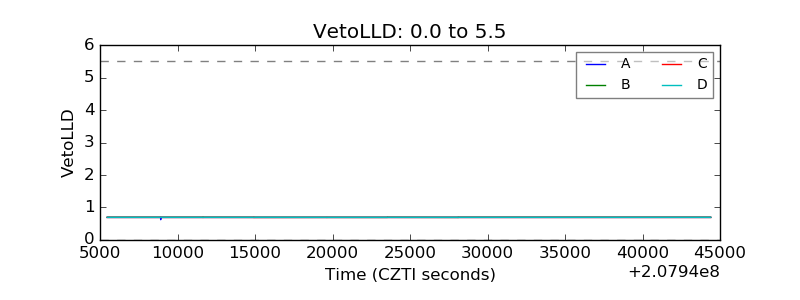 |
| Alpha Counter |  |
| _CPM_Rate | 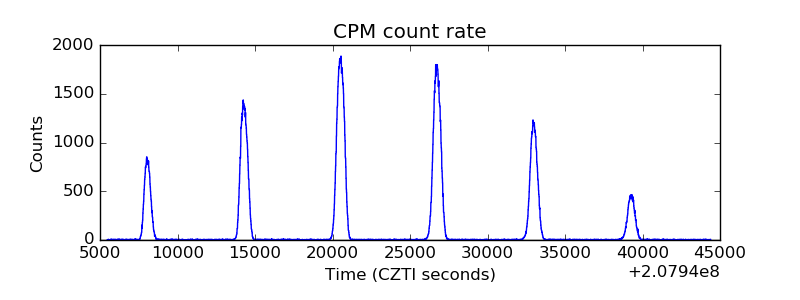 |
| CZT Counter |  |
| +2.5 Volts monitor | 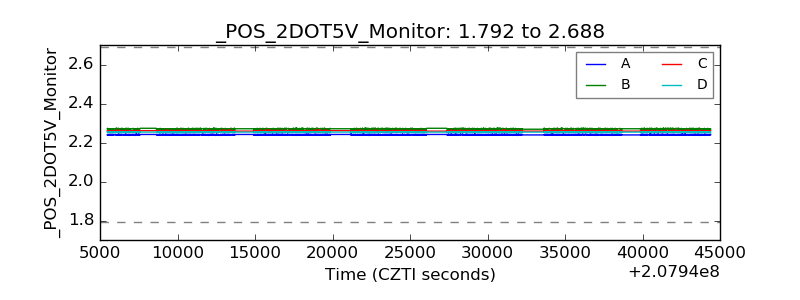 |
| +5 Volts monitor |  |
| _ROLL_ROT | 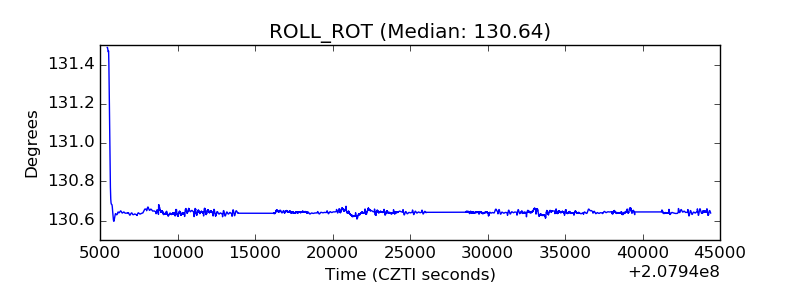 |
| _Roll_DEC | 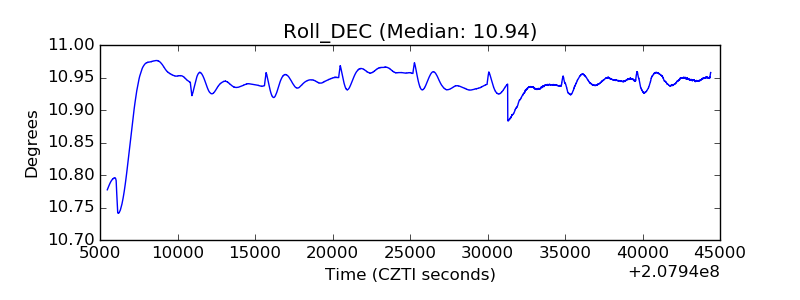 |
| _Roll_RA | 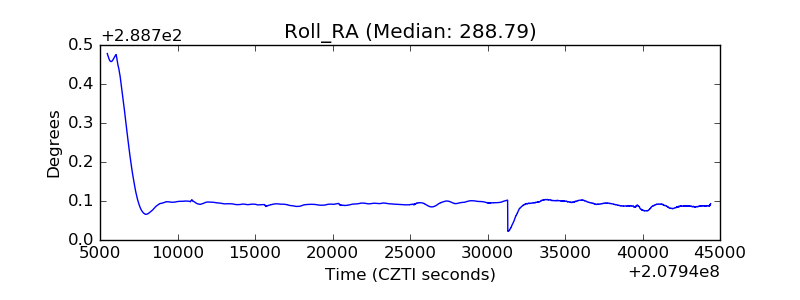 |
| Veto Counter |  |