| Param | Original file | Final file |
|---|---|---|
| Filename | modeM0/AS1G05_167T02_9000000574_04598cztM0_level2.evt | modeM0/AS1G05_167T02_9000000574_04598cztM0_level2_quad_clean.evt |
| Size (bytes) | 273,098,880 | 30,067,200 |
| Size | 260.4 MB | 28.7 MB |
| Events in quadrant A | 1,756,296 | 167,682 |
| Events in quadrant B | 1,946,868 | 168,814 |
| Events in quadrant C | 2,044,310 | 170,137 |
| Events in quadrant D | 2,285,815 | 156,828 |
| Mode M0 | |||
|---|---|---|---|
| Quadrant | BADHDUFLAG | Total packets | Discarded packets |
| A | 0 | 7570 | 2 |
| B | 0 | 8050 | 1 |
| C | 0 | 8371 | 1 |
| D | 0 | 9228 | 1 |
| Mode SS | |||
|---|---|---|---|
| Quadrant | BADHDUFLAG | Total packets | Discarded packets |
| A | 0 | 70 | 0 |
| B | 0 | 70 | 0 |
| C | 0 | 70 | 0 |
| D | 0 | 70 | 0 |
| Mode M9 | |||
|---|---|---|---|
| Quadrant | BADHDUFLAG | Total packets | Discarded packets |
| A | 0 | 11 | 0 |
| B | 0 | 11 | 0 |
| C | 0 | 11 | 0 |
| D | 0 | 11 | 0 |
| Quadrant | Total seconds | Saturated seconds | Saturation percentage |
|---|---|---|---|
| A | 3481 | 58 | 1.666188% |
| B | 3481 | 65 | 1.867280% |
| C | 3481 | 45 | 1.292732% |
| D | 3481 | 173 | 4.969836% |
Noise dominated data is calculated using 1-second bins in cleaned event files. If a bin has >2000 counts, and if more than 50% of those come from <1% of pixels, then it is considered to be noise-dominated and hence unusable.
| Quadrant | # 1 sec bins | Bins with >0 counts | Bins with >2000 counts | High rate bins dominated by noise | Noise dominated (total time) | Noise dominated (detector-on time) | Marked lightcurve |
|---|---|---|---|---|---|---|---|
| A | 4521 | 3482 | 2 | 2 | 0.04% | 0.06% | 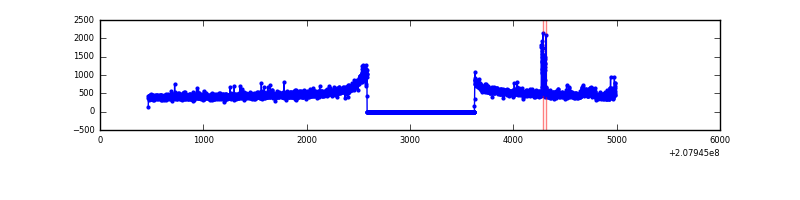 |
| B | 4521 | 3482 | 8 | 8 | 0.18% | 0.23% | 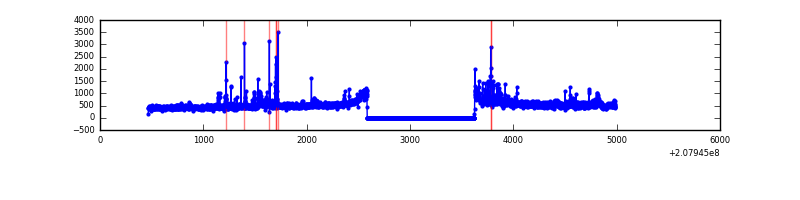 |
| C | 4521 | 3482 | 2 | 2 | 0.04% | 0.06% | 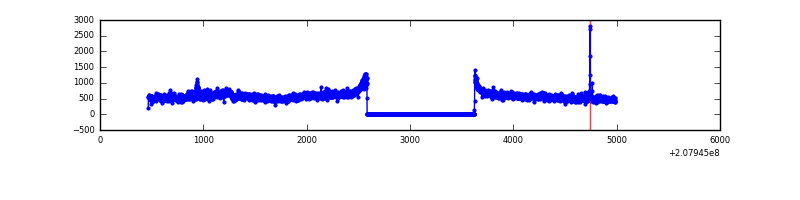 |
| D | 4521 | 3482 | 110 | 110 | 2.43% | 3.16% | 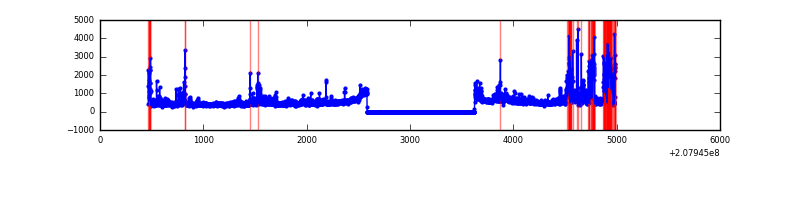 |
Top three noisy pixels from each quadrant. If the there are fewer than three noisy pixels in the level2.evt file, extra rows are filled as -1
| Pixel properties | Quadrant properties | ||||||
|---|---|---|---|---|---|---|---|
| Quadrant | DetID | PixID | Counts | Sigma | Mean | Median | Sigma |
| A | 10 | 253 | 28869 | 313.91 | 438 | 428 | 90.6 |
| A | 15 | 174 | 18891 | 203.78 | 438 | 428 | 90.6 |
| A | 7 | 16 | 7777 | 81.11 | 438 | 428 | 90.6 |
| B | 4 | 48 | 78471 | 916.92 | 439 | 428 | 85.1 |
| B | 10 | 16 | 68675 | 801.83 | 439 | 428 | 85.1 |
| B | 15 | 204 | 37202 | 432.06 | 439 | 428 | 85.1 |
| C | 14 | 48 | 359381 | 3520.3 | 425 | 428 | 102.0 |
| C | 9 | 247 | 17578 | 168.19 | 425 | 428 | 102.0 |
| C | 9 | 54 | 4624 | 41.15 | 425 | 428 | 102.0 |
| D | 13 | 235 | 586340 | 5622.41 | 421 | 408 | 104.2 |
| D | 7 | 67 | 36495 | 346.28 | 421 | 408 | 104.2 |
| D | 2 | 136 | 18694 | 175.47 | 421 | 408 | 104.2 |
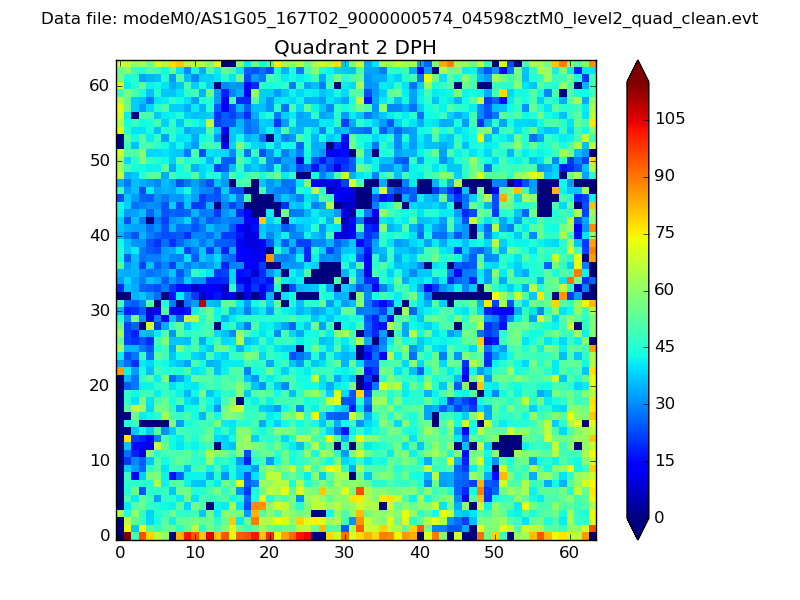
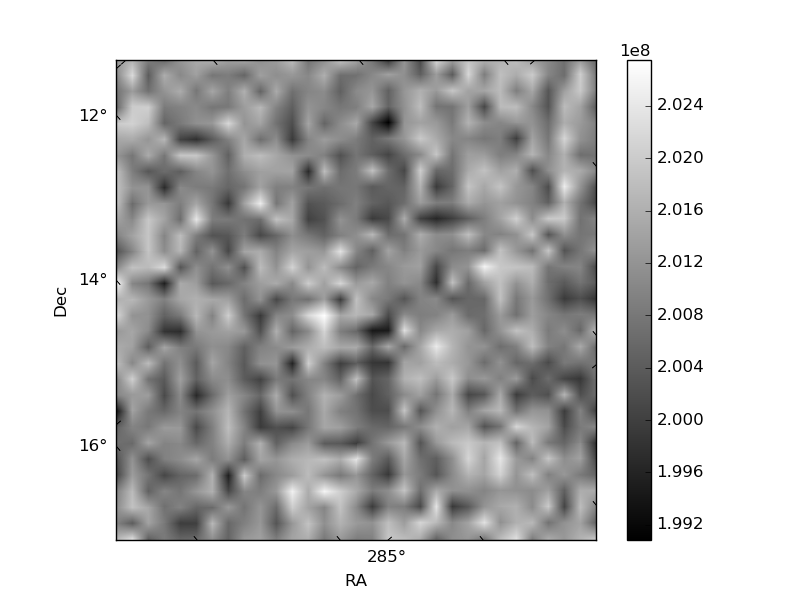
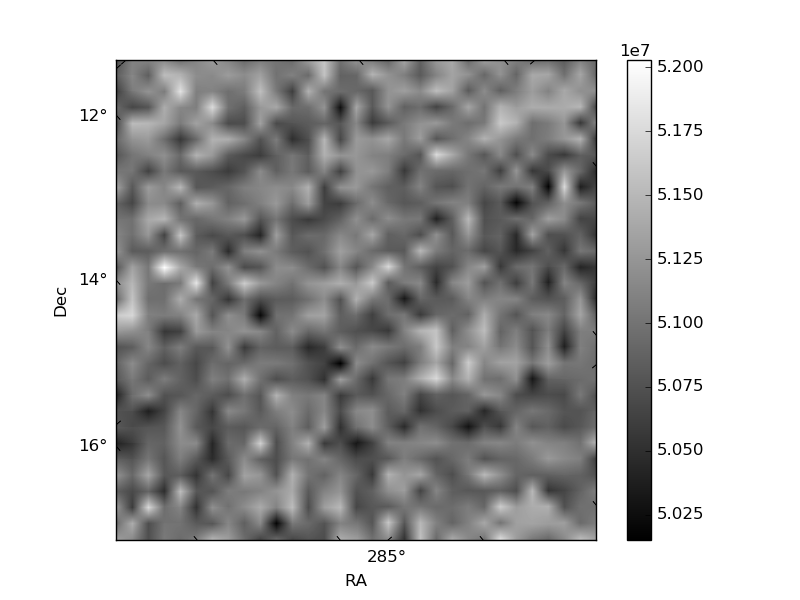
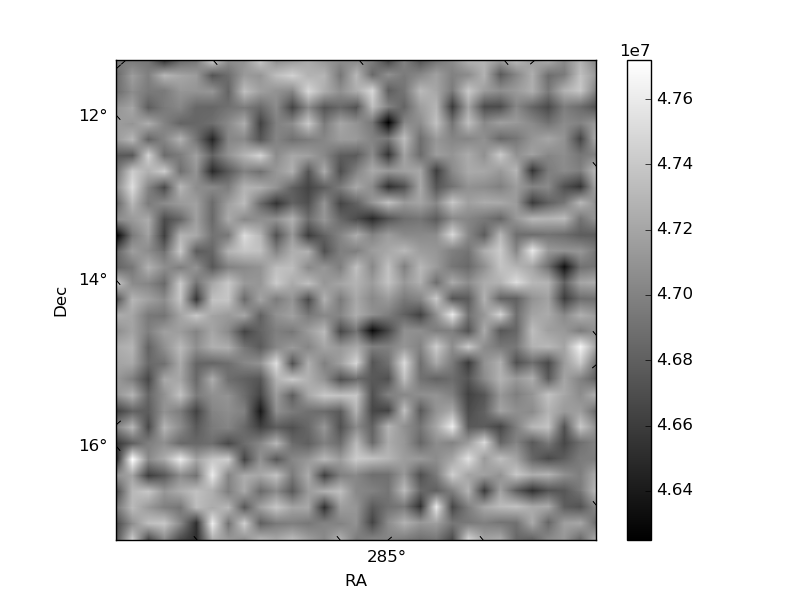
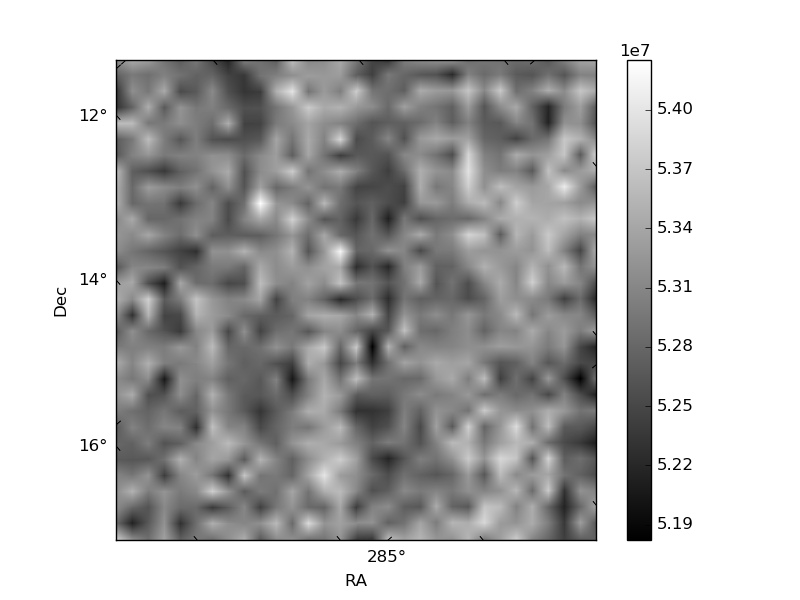
Histogram calculated using DETX and DETY for each event in the final _common_clean file
| Quadrant A | 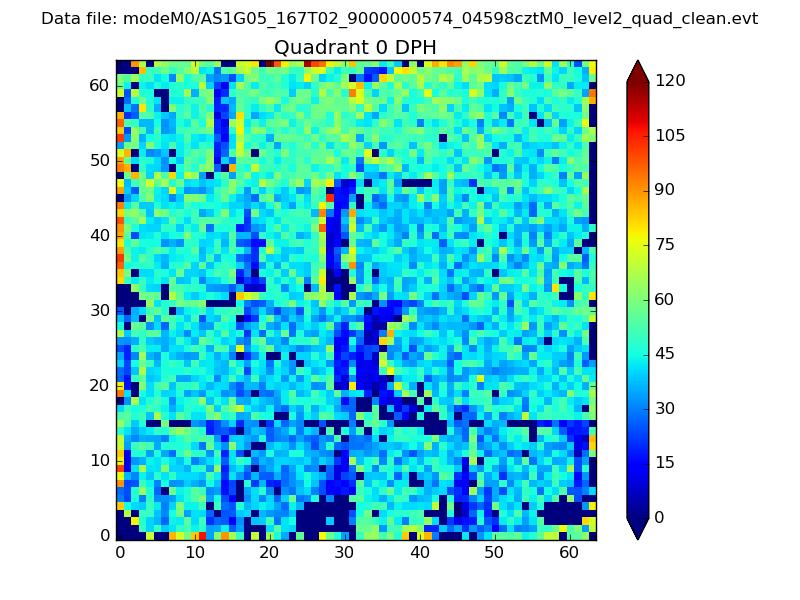 |
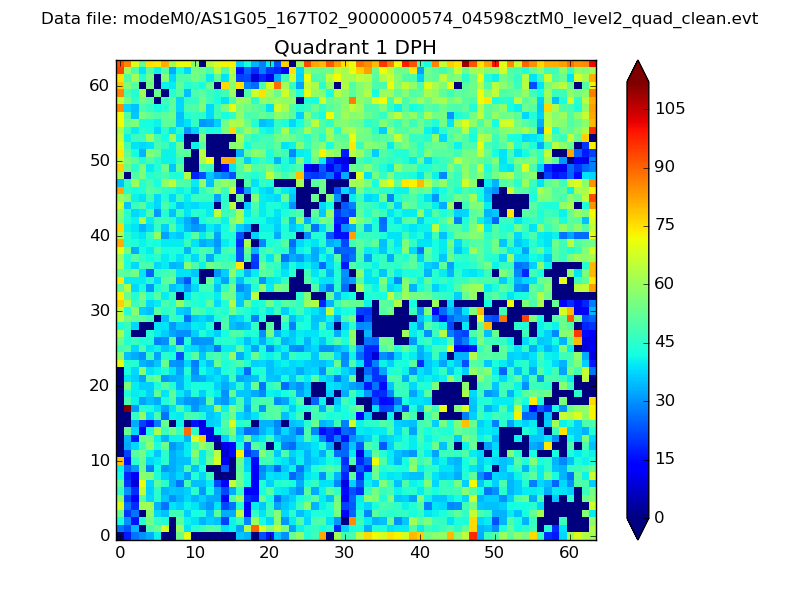 |
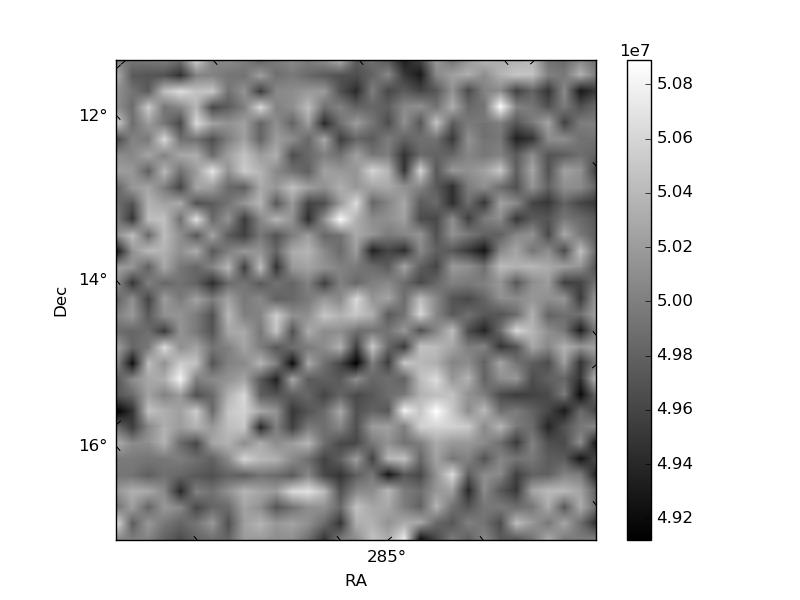
Quadrant B |
|---|---|---|---|
| Quadrant D | 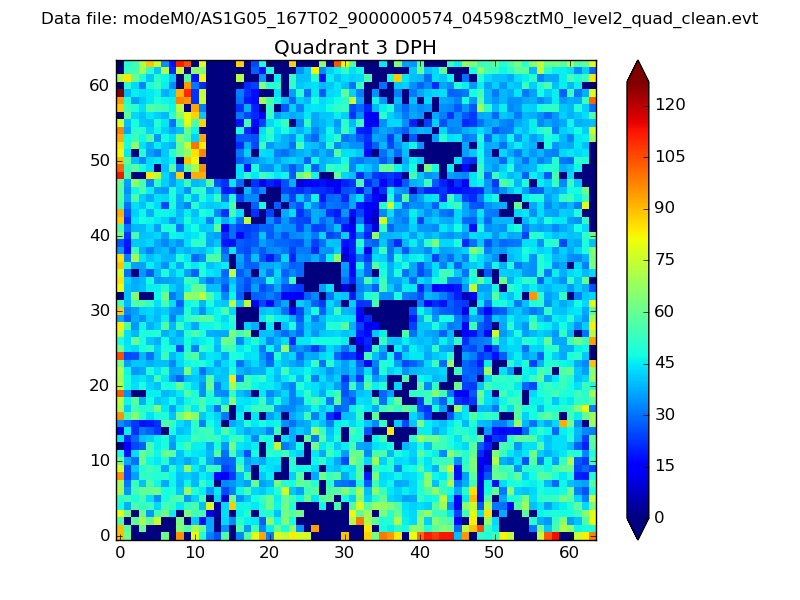 |
 |
Quadrant C |
| Plot type | Count rate plots | Images |
|---|---|---|
| Comparison with Poisson distribution Blue bars denote a histogram of data divided into 1 sec bins. Red curve is a Poisson curve with rate = median count rate of data. |
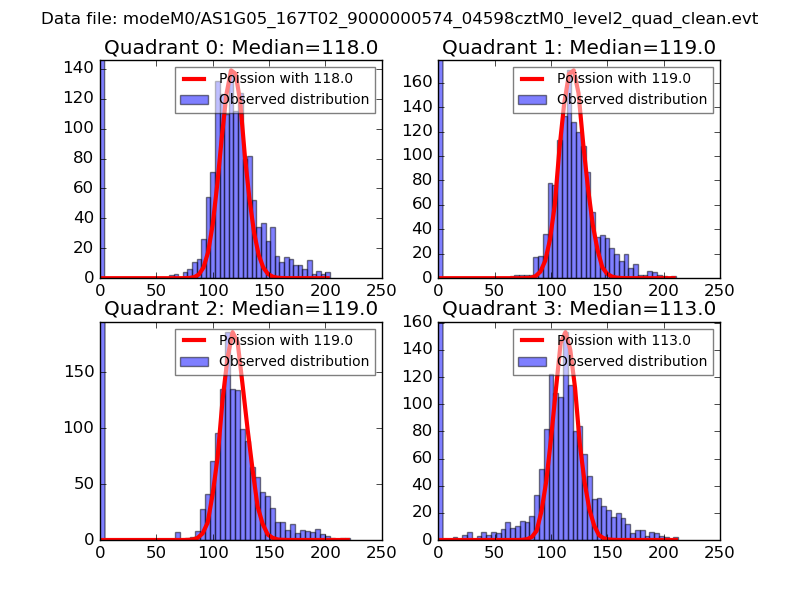 |
 |
| Quadrant-wise count rates Data is divided into 100 sec bins |
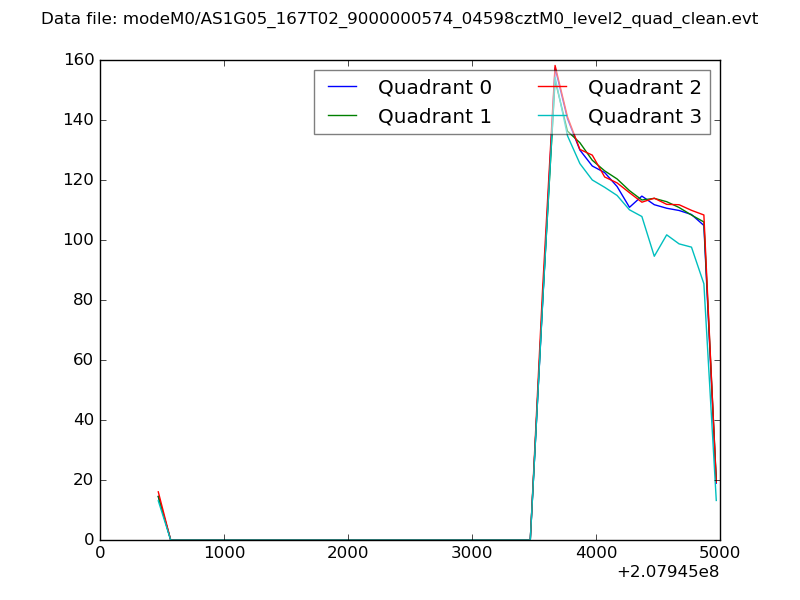 |
|
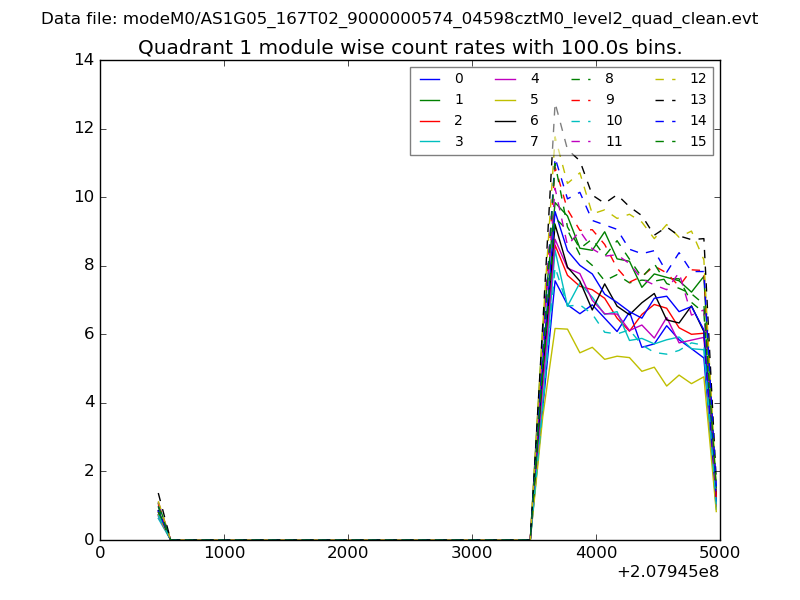
| Module-wise count rates for Quadrant A Data is divided into 100 sec bins |
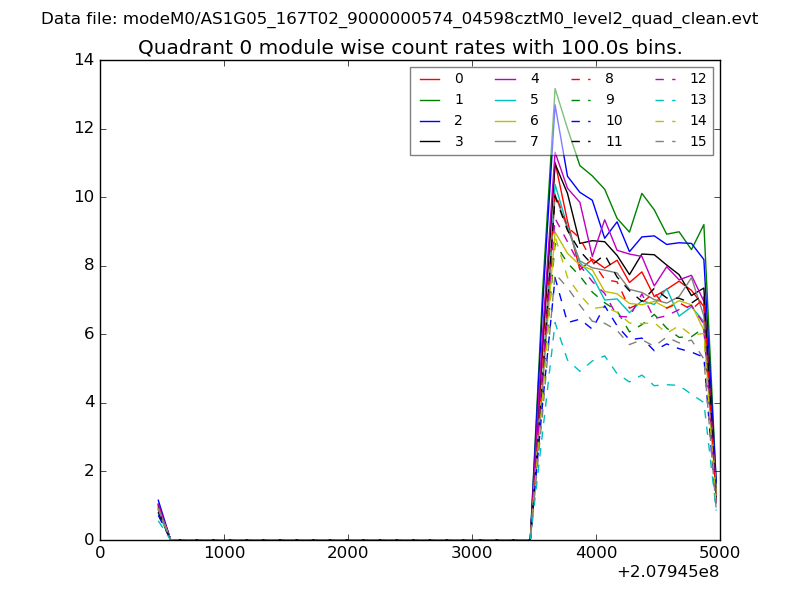 |
 |
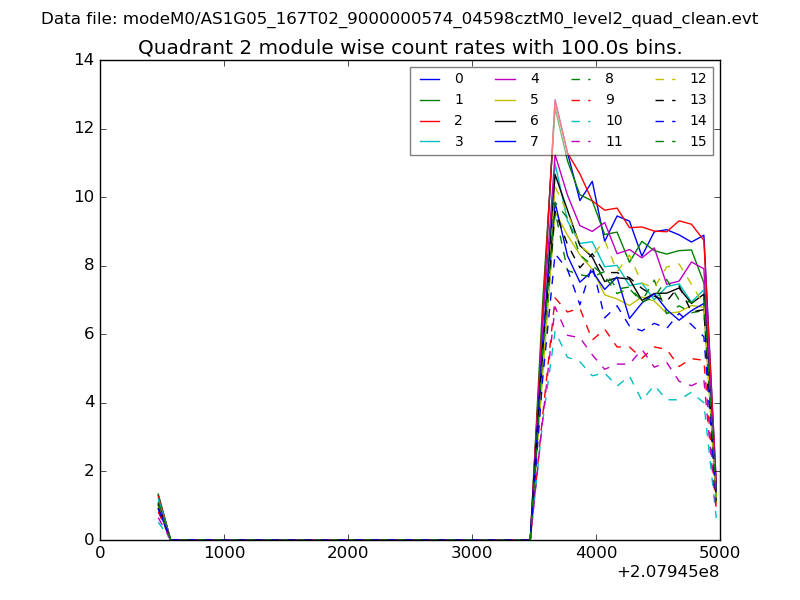
| Module-wise count rates for Quadrant B Data is divided into 100 sec bins |
 |
 |
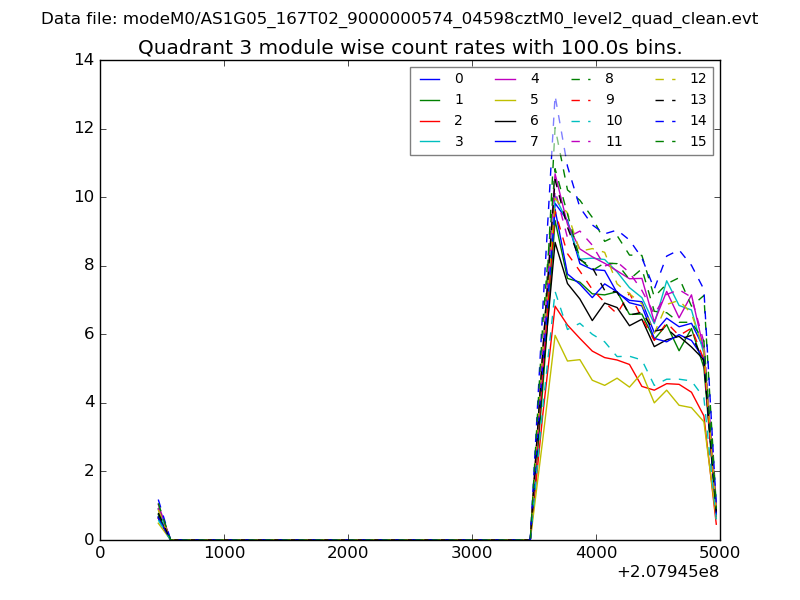
| Module-wise count rates for Quadrant C Data is divided into 100 sec bins |
 |
 |
| Module-wise count rates for Quadrant D Data is divided into 100 sec bins |
 |
 |
| Parameter | Plot |
|---|---|
| CZT HV Monitor | 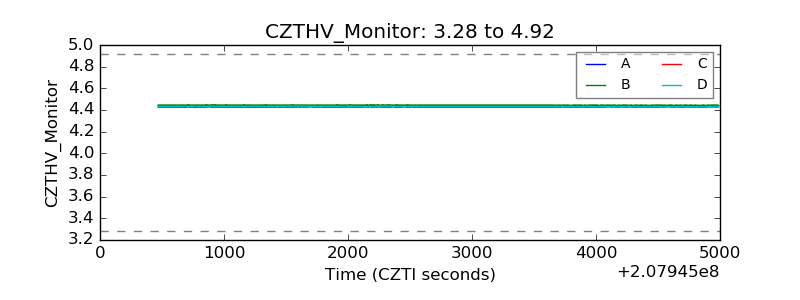 |
| D_VDD | 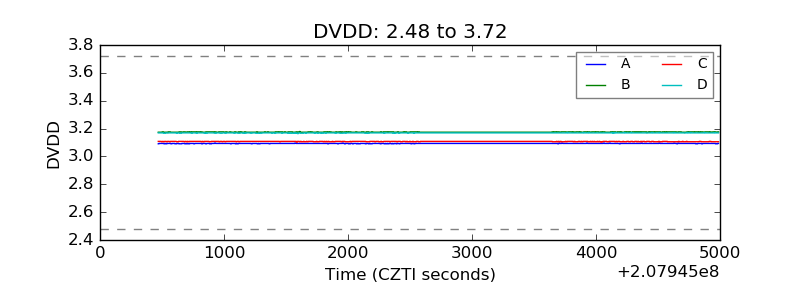 |
| Temperature 1 | 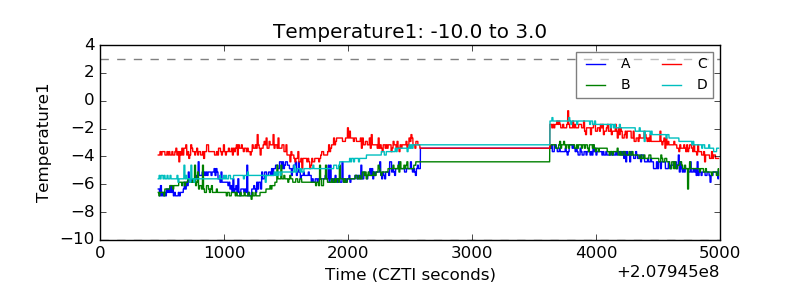 |
| Veto HV Monitor | 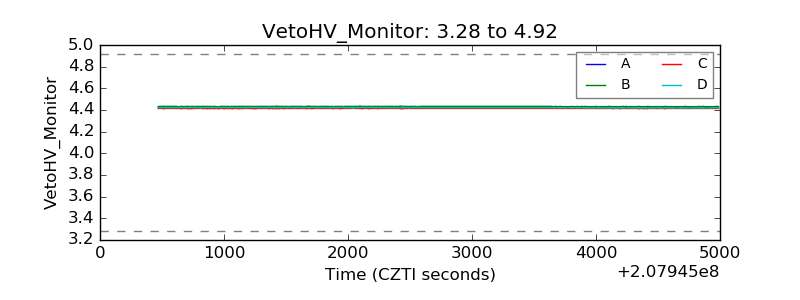 |
| Veto LLD | 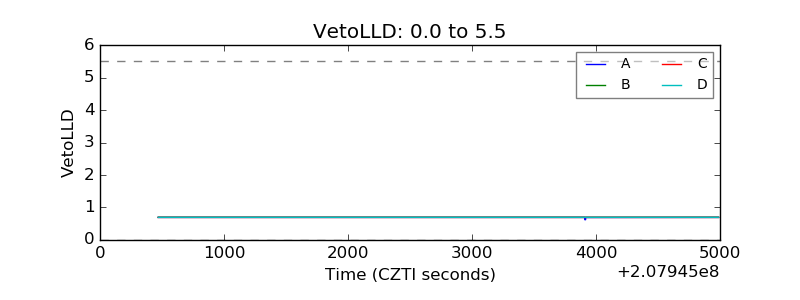 |
| Alpha Counter | 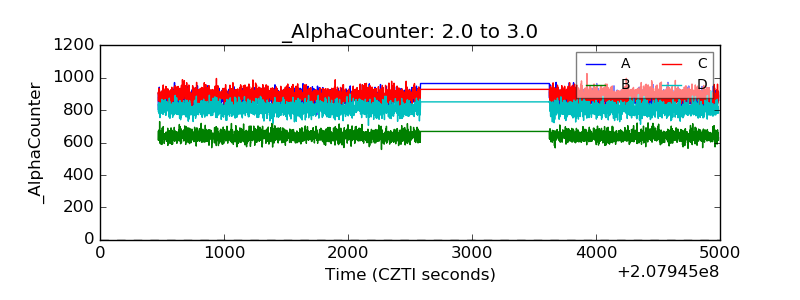 |
| _CPM_Rate | 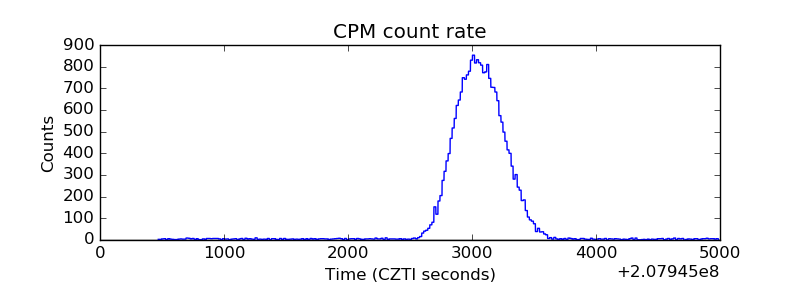 |
| CZT Counter | 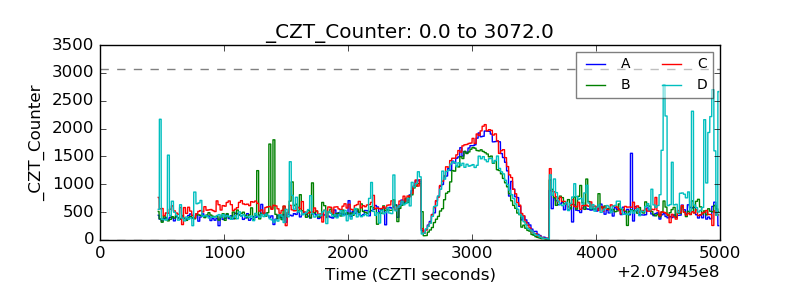 |
| +2.5 Volts monitor |  |
| +5 Volts monitor |  |
| _ROLL_ROT | 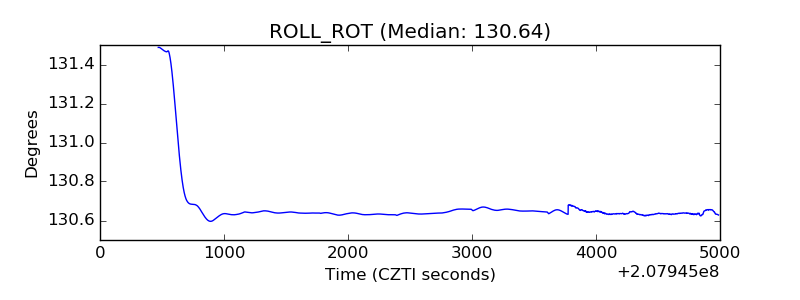 |
| _Roll_DEC | 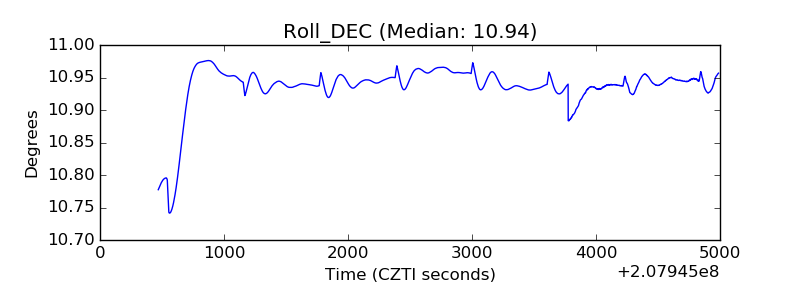 |
| _Roll_RA | 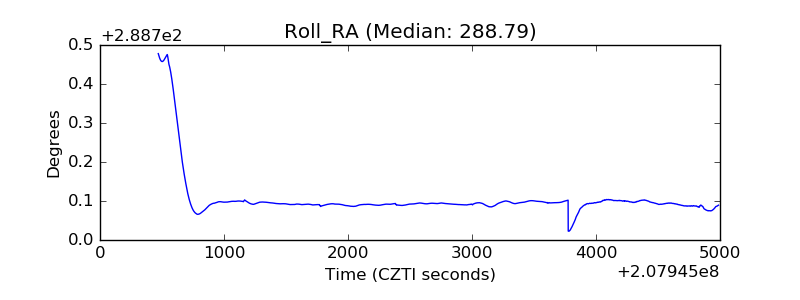 |
| Veto Counter | 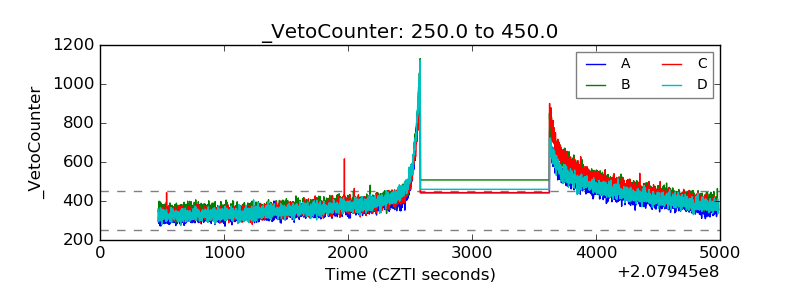 |