| Param | Original file | Final file |
|---|---|---|
| Filename | modeM0/AS1G05_167T02_9000000574_04600cztM0_level2.evt | modeM0/AS1G05_167T02_9000000574_04600cztM0_level2_quad_clean.evt |
| Size (bytes) | 509,201,280 | 77,662,080 |
| Size | 485.6 MB | 74.1 MB |
| Events in quadrant A | 3,085,592 | 483,199 |
| Events in quadrant B | 3,315,211 | 485,037 |
| Events in quadrant C | 4,297,816 | 487,871 |
| Events in quadrant D | 4,289,563 | 449,835 |
| Mode M0 | |||
|---|---|---|---|
| Quadrant | BADHDUFLAG | Total packets | Discarded packets |
| A | 0 | 13558 | 3 |
| B | 0 | 13998 | 2 |
| C | 0 | 17222 | 2 |
| D | 0 | 17381 | 5 |
| Mode SS | |||
|---|---|---|---|
| Quadrant | BADHDUFLAG | Total packets | Discarded packets |
| A | 0 | 128 | 0 |
| B | 0 | 128 | 0 |
| C | 0 | 128 | 0 |
| D | 0 | 128 | 0 |
| Mode M9 | |||
|---|---|---|---|
| Quadrant | BADHDUFLAG | Total packets | Discarded packets |
| A | 0 | 13 | 0 |
| B | 0 | 13 | 0 |
| C | 0 | 13 | 0 |
| D | 0 | 14 | 0 |
| Quadrant | Total seconds | Saturated seconds | Saturation percentage |
|---|---|---|---|
| A | 6391 | 52 | 0.813644% |
| B | 6391 | 63 | 0.985761% |
| C | 6391 | 48 | 0.751056% |
| D | 6390 | 373 | 5.837246% |
Noise dominated data is calculated using 1-second bins in cleaned event files. If a bin has >2000 counts, and if more than 50% of those come from <1% of pixels, then it is considered to be noise-dominated and hence unusable.
| Quadrant | # 1 sec bins | Bins with >0 counts | Bins with >2000 counts | High rate bins dominated by noise | Noise dominated (total time) | Noise dominated (detector-on time) | Marked lightcurve |
|---|---|---|---|---|---|---|---|
| A | 7571 | 6392 | 2 | 2 | 0.03% | 0.03% | 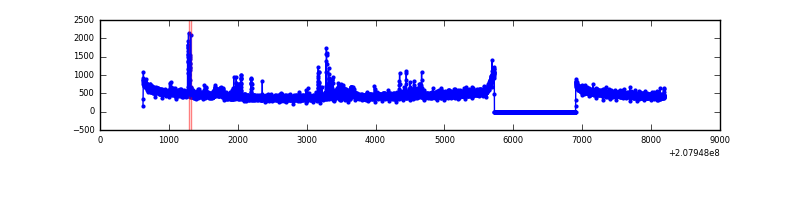 |
| B | 7571 | 6392 | 13 | 13 | 0.17% | 0.20% | 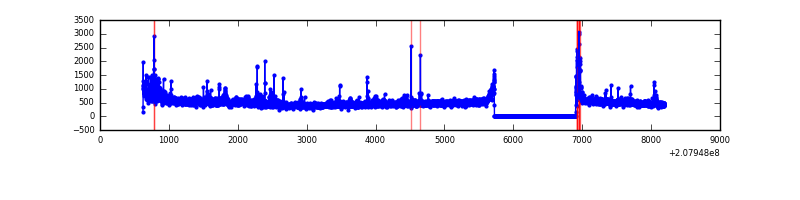 |
| C | 7571 | 6392 | 4 | 4 | 0.05% | 0.06% | 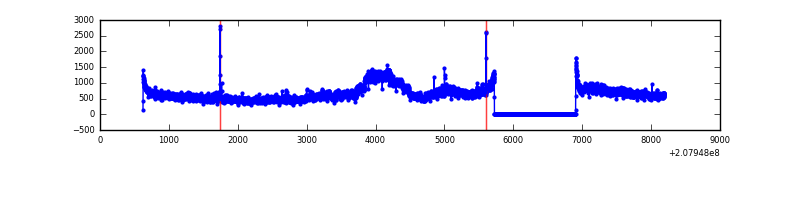 |
| D | 7571 | 6392 | 322 | 322 | 4.25% | 5.04% | 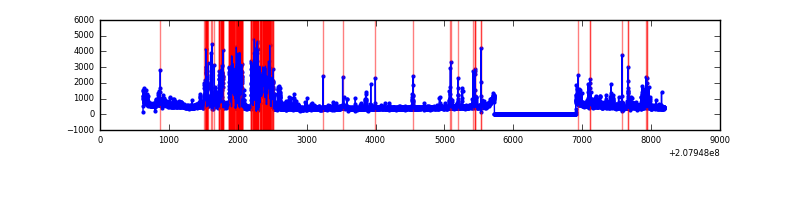 |
Top three noisy pixels from each quadrant. If the there are fewer than three noisy pixels in the level2.evt file, extra rows are filled as -1
| Pixel properties | Quadrant properties | ||||||
|---|---|---|---|---|---|---|---|
| Quadrant | DetID | PixID | Counts | Sigma | Mean | Median | Sigma |
| A | 10 | 253 | 71943 | 459.89 | 757 | 742 | 154.8 |
| A | 0 | 50 | 66646 | 425.68 | 757 | 742 | 154.8 |
| A | 15 | 174 | 19745 | 122.74 | 757 | 742 | 154.8 |
| B | 4 | 48 | 107073 | 726.91 | 768 | 753 | 146.3 |
| B | 14 | 167 | 95517 | 647.9 | 768 | 753 | 146.3 |
| B | 15 | 204 | 56740 | 382.78 | 768 | 753 | 146.3 |
| C | 14 | 48 | 1358517 | 7761.81 | 746 | 750 | 174.9 |
| C | 9 | 247 | 18655 | 102.36 | 746 | 750 | 174.9 |
| C | 10 | 21 | 6036 | 30.22 | 746 | 750 | 174.9 |
| D | 13 | 235 | 1195637 | 6813.97 | 725 | 704 | 175.4 |
| D | 2 | 136 | 132400 | 750.98 | 725 | 704 | 175.4 |
| D | 13 | 239 | 48777 | 274.13 | 725 | 704 | 175.4 |
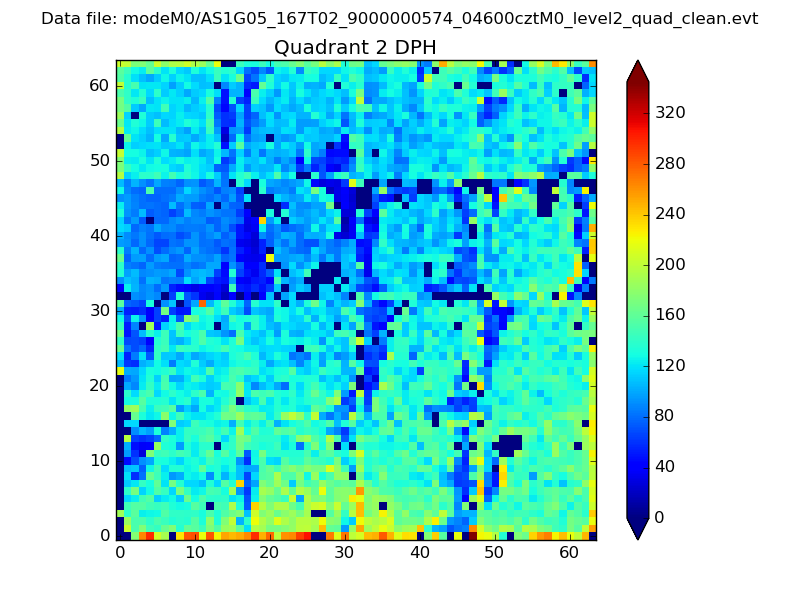
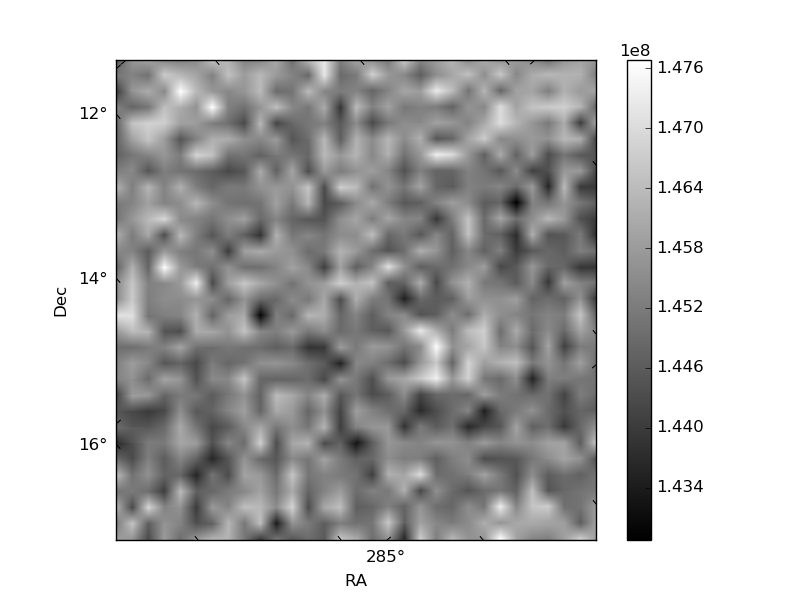
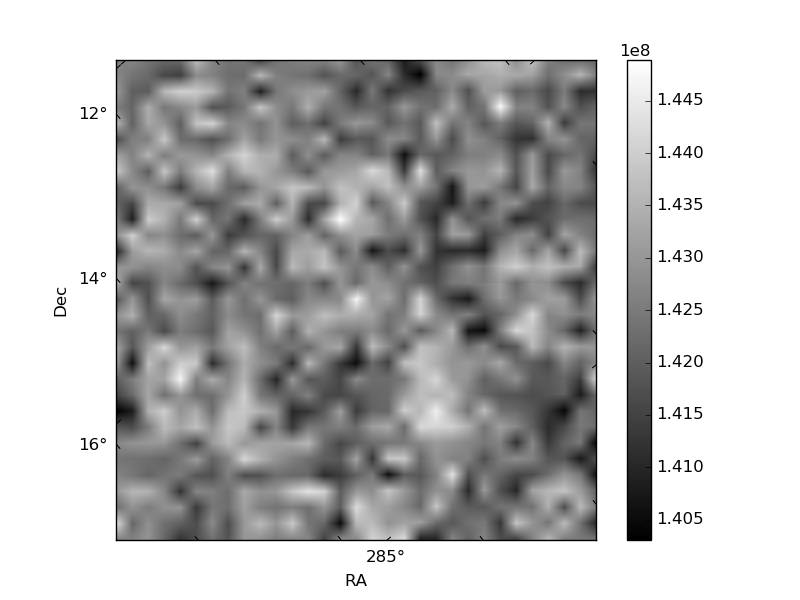
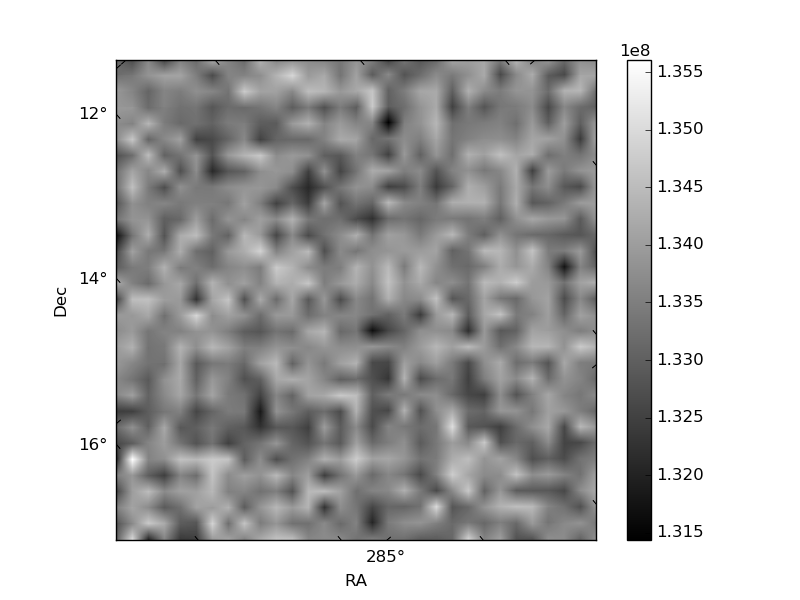
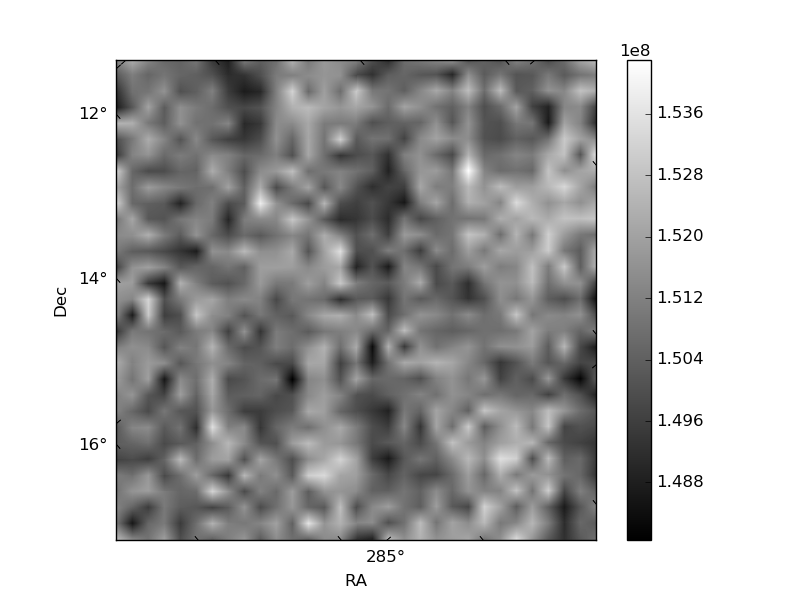
Histogram calculated using DETX and DETY for each event in the final _common_clean file
| Quadrant A | 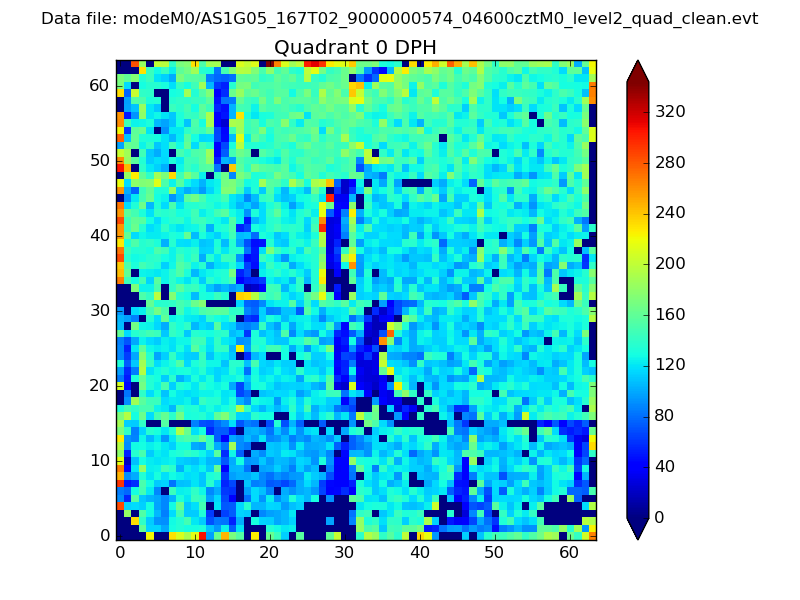 |
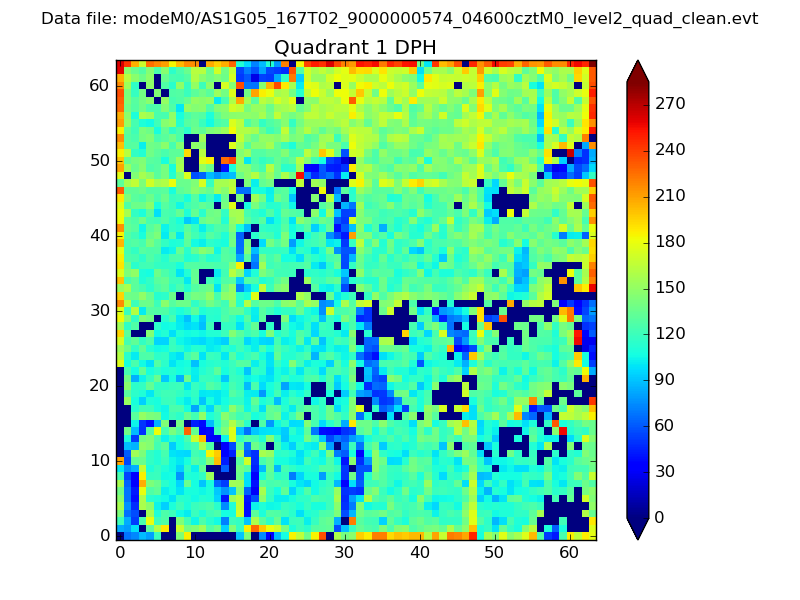 |
Quadrant B |
|---|---|---|---|
| Quadrant D | 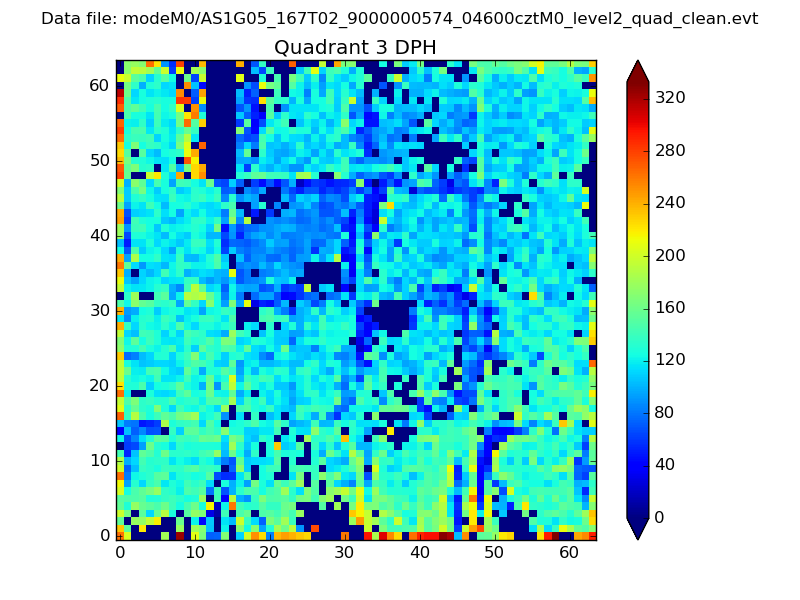 |
 |
Quadrant C |
| Plot type | Count rate plots | Images |
|---|---|---|
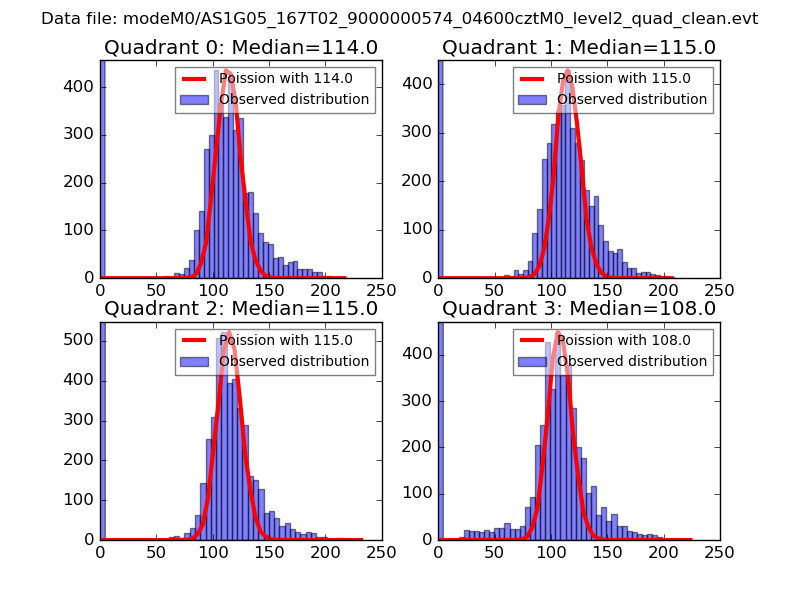
| Comparison with Poisson distribution Blue bars denote a histogram of data divided into 1 sec bins. Red curve is a Poisson curve with rate = median count rate of data. |
 |
 |
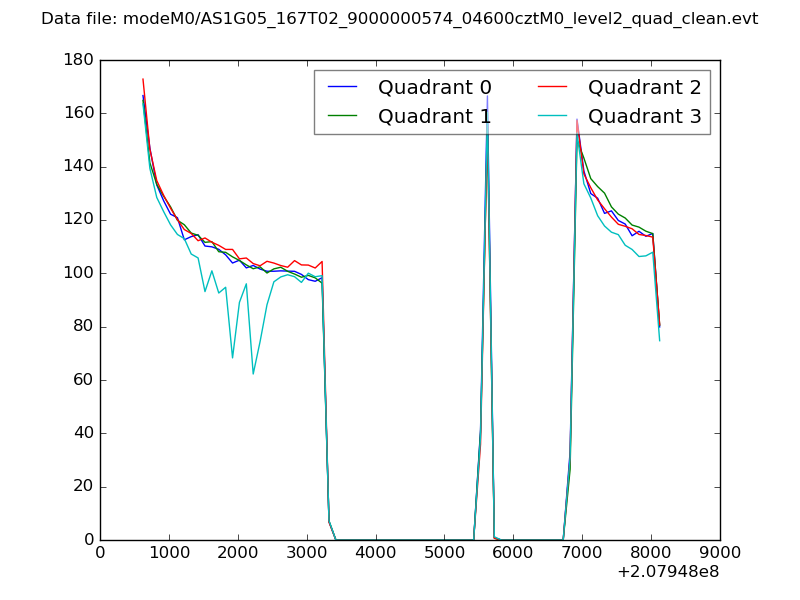
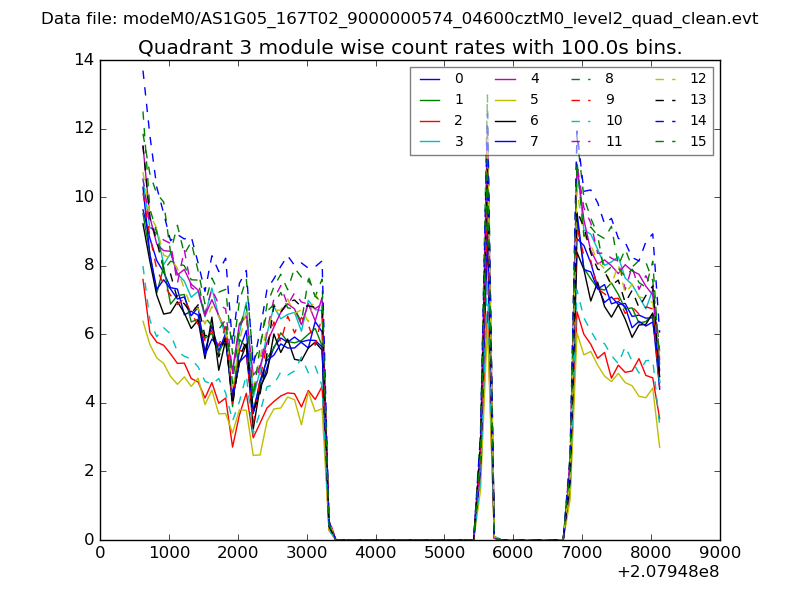
| Quadrant-wise count rates Data is divided into 100 sec bins |
 |
|
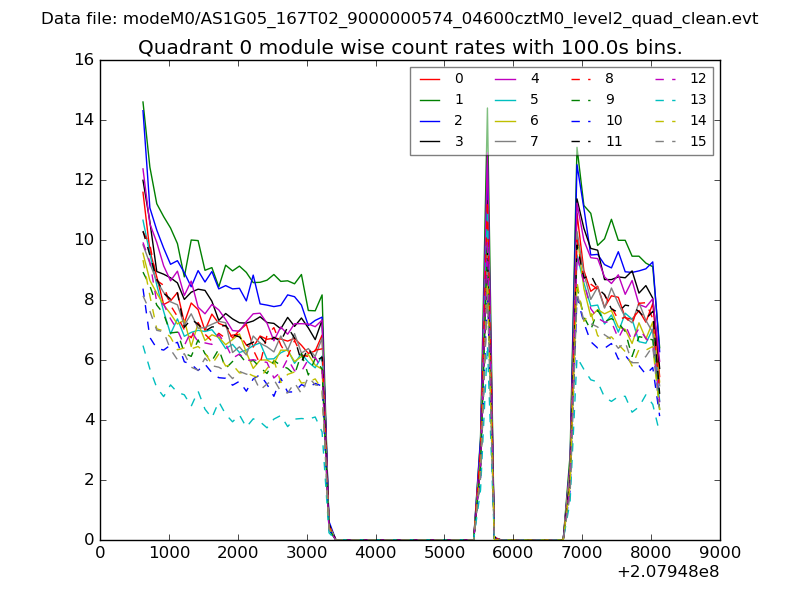
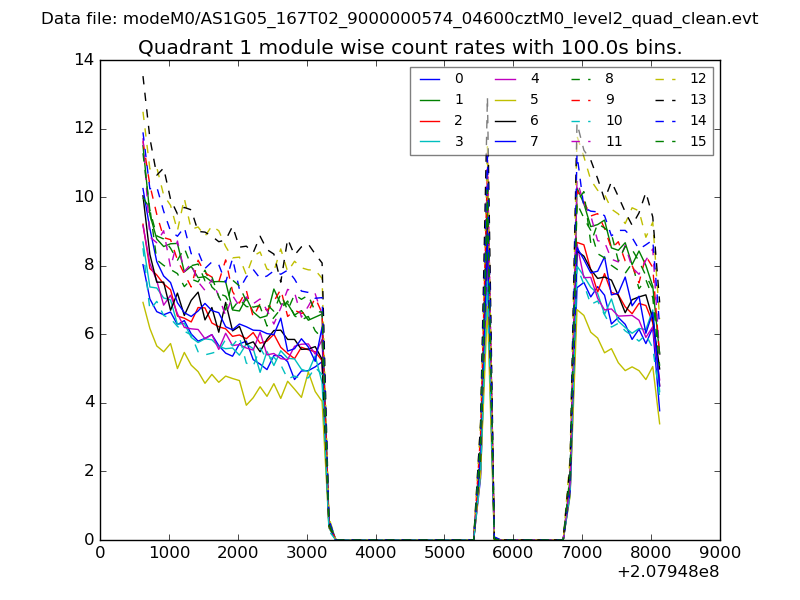
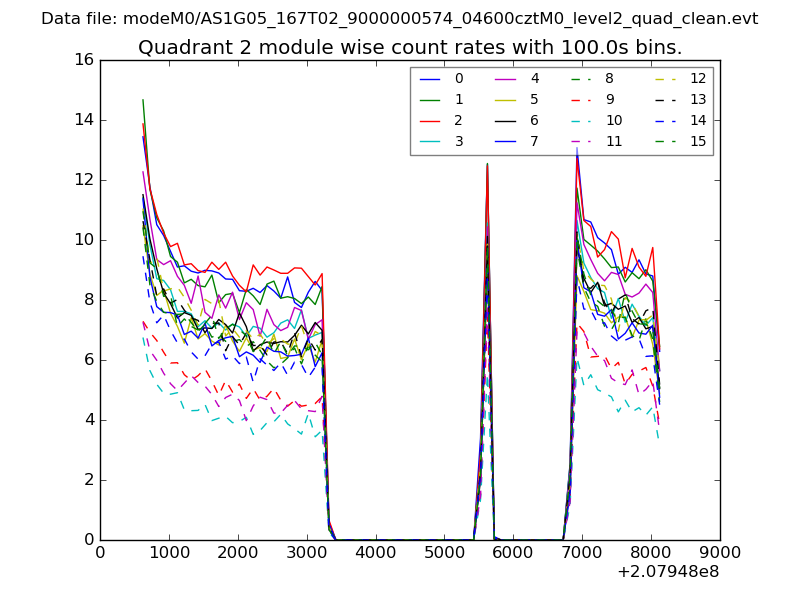
| Module-wise count rates for Quadrant A Data is divided into 100 sec bins |
 |
 |
| Module-wise count rates for Quadrant B Data is divided into 100 sec bins |
 |
 |
| Module-wise count rates for Quadrant C Data is divided into 100 sec bins |
 |
 |
| Module-wise count rates for Quadrant D Data is divided into 100 sec bins |
 |
 |
| Parameter | Plot |
|---|---|
| CZT HV Monitor | 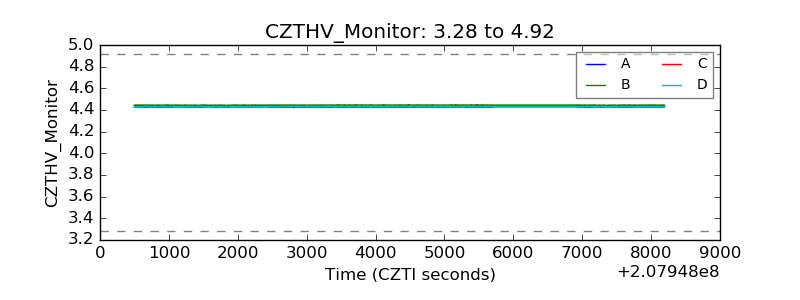 |
| D_VDD | 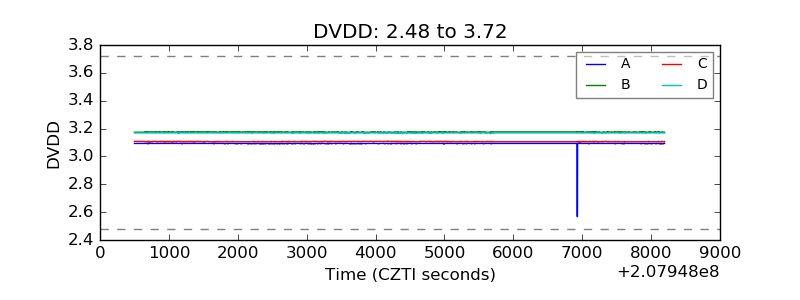 |
| Temperature 1 | 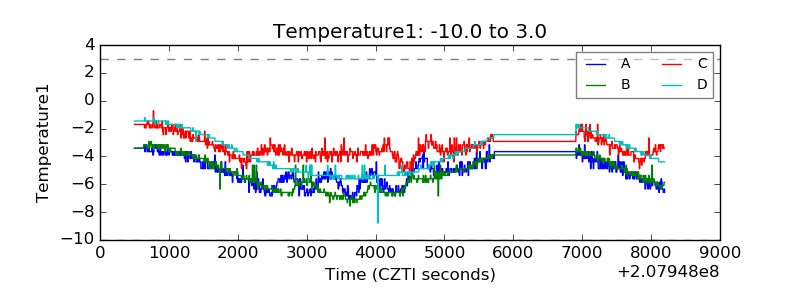 |
| Veto HV Monitor | 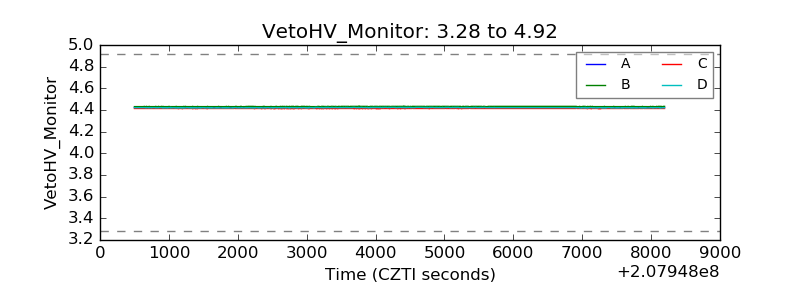 |
| Veto LLD | 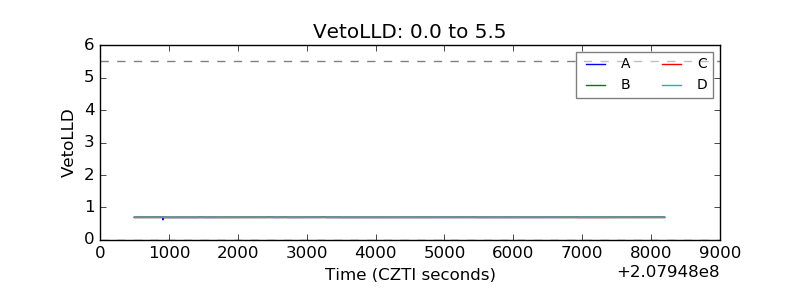 |
| Alpha Counter | 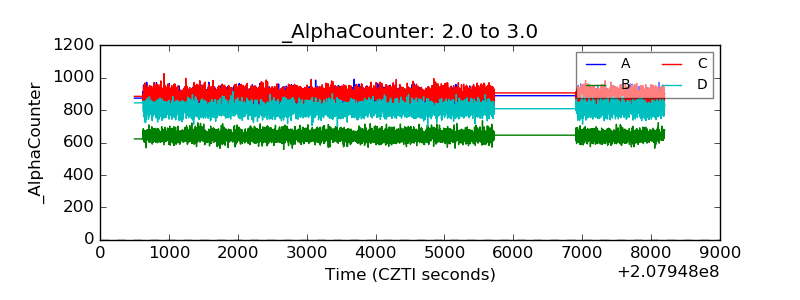 |
| _CPM_Rate | 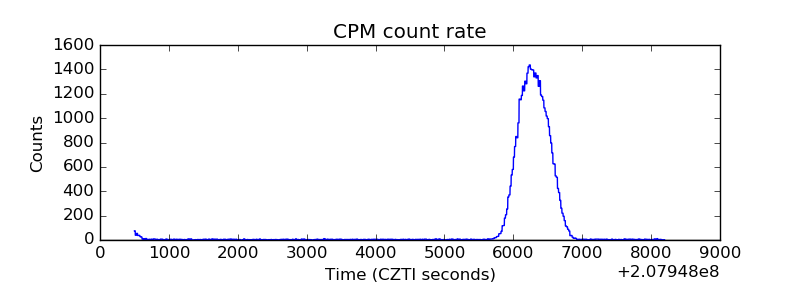 |
| CZT Counter | 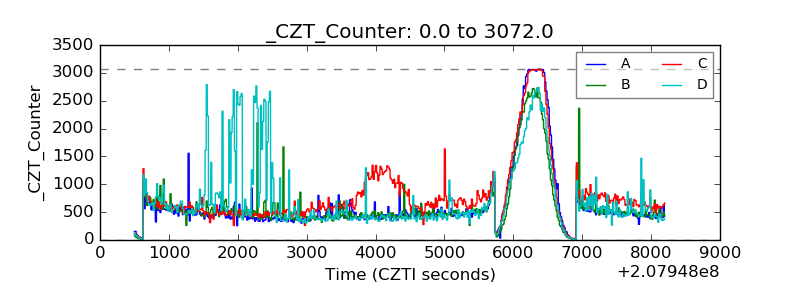 |
| +2.5 Volts monitor |  |
| +5 Volts monitor |  |
| _ROLL_ROT | 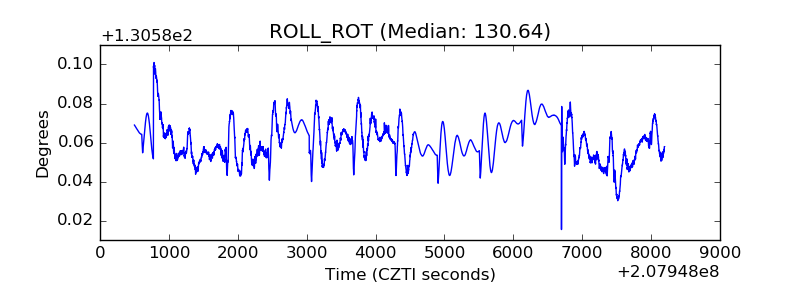 |
| _Roll_DEC |  |
| _Roll_RA | 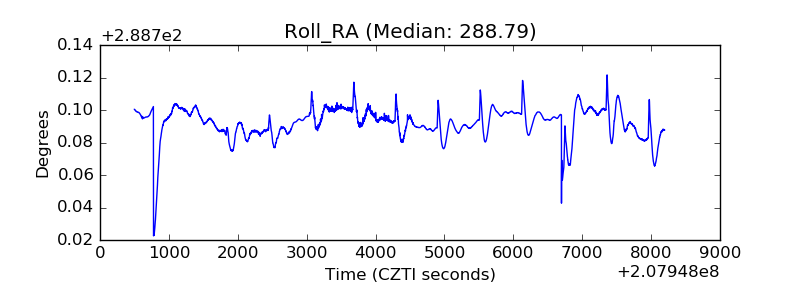 |
| Veto Counter | 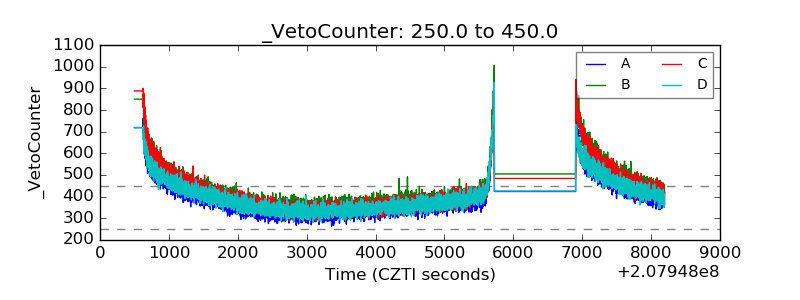 |