| Param | Original file | Final file |
|---|---|---|
| Filename | modeM0/AS1G05_167T02_9000000574_04601cztM0_level2.evt | modeM0/AS1G05_167T02_9000000574_04601cztM0_level2_quad_clean.evt |
| Size (bytes) | 470,197,440 | 75,833,280 |
| Size | 448.4 MB | 72.3 MB |
| Events in quadrant A | 2,966,018 | 468,722 |
| Events in quadrant B | 3,133,956 | 479,794 |
| Events in quadrant C | 4,494,331 | 470,530 |
| Events in quadrant D | 3,226,458 | 445,881 |
| Mode M0 | |||
|---|---|---|---|
| Quadrant | BADHDUFLAG | Total packets | Discarded packets |
| A | 0 | 13069 | 3 |
| B | 0 | 13229 | 2 |
| C | 0 | 17943 | 2 |
| D | 0 | 14107 | 2 |
| Mode SS | |||
|---|---|---|---|
| Quadrant | BADHDUFLAG | Total packets | Discarded packets |
| A | 0 | 124 | 0 |
| B | 0 | 124 | 0 |
| C | 0 | 124 | 0 |
| D | 0 | 124 | 0 |
| Mode M9 | |||
|---|---|---|---|
| Quadrant | BADHDUFLAG | Total packets | Discarded packets |
| A | 0 | 23 | 0 |
| B | 0 | 23 | 0 |
| C | 0 | 23 | 0 |
| D | 0 | 24 | 0 |
| Quadrant | Total seconds | Saturated seconds | Saturation percentage |
|---|---|---|---|
| A | 6184 | 29 | 0.468952% |
| B | 6184 | 52 | 0.840880% |
| C | 6184 | 22 | 0.355757% |
| D | 6184 | 78 | 1.261320% |
Noise dominated data is calculated using 1-second bins in cleaned event files. If a bin has >2000 counts, and if more than 50% of those come from <1% of pixels, then it is considered to be noise-dominated and hence unusable.
| Quadrant | # 1 sec bins | Bins with >0 counts | Bins with >2000 counts | High rate bins dominated by noise | Noise dominated (total time) | Noise dominated (detector-on time) | Marked lightcurve |
|---|---|---|---|---|---|---|---|
| A | 7474 | 6185 | 2 | 2 | 0.03% | 0.03% | 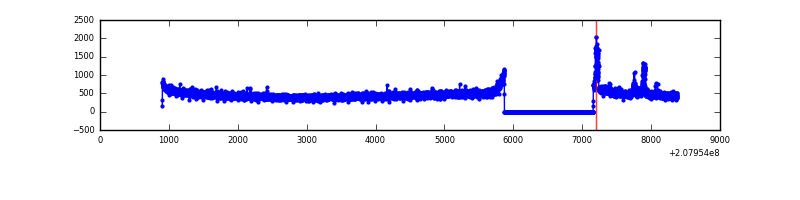 |
| B | 7474 | 6185 | 14 | 14 | 0.19% | 0.23% |  |
| C | 7474 | 6185 | 0 | 0 | 0.00% | 0.00% | 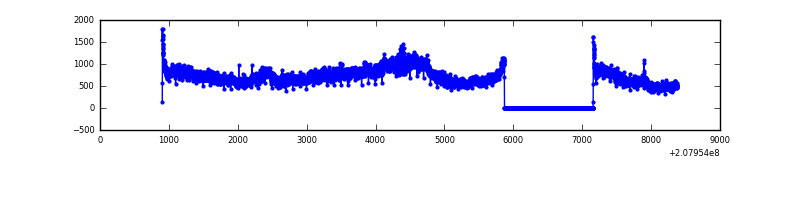 |
| D | 7474 | 6185 | 43 | 43 | 0.58% | 0.70% |  |
Top three noisy pixels from each quadrant. If the there are fewer than three noisy pixels in the level2.evt file, extra rows are filled as -1
| Pixel properties | Quadrant properties | ||||||
|---|---|---|---|---|---|---|---|
| Quadrant | DetID | PixID | Counts | Sigma | Mean | Median | Sigma |
| A | 15 | 174 | 104227 | 682.68 | 741 | 726 | 151.6 |
| A | 12 | 194 | 7353 | 43.71 | 741 | 726 | 151.6 |
| A | 0 | 226 | 7351 | 43.7 | 741 | 726 | 151.6 |
| B | 14 | 167 | 83370 | 579.3 | 754 | 739 | 142.6 |
| B | 4 | 48 | 48278 | 333.28 | 754 | 739 | 142.6 |
| B | 4 | 170 | 20064 | 135.48 | 754 | 739 | 142.6 |
| C | 14 | 48 | 1662599 | 9853.09 | 724 | 728 | 168.7 |
| C | 13 | 61 | 5941 | 30.91 | 724 | 728 | 168.7 |
| C | 12 | 4 | 4492 | 22.32 | 724 | 728 | 168.7 |
| D | 2 | 136 | 147355 | 856.84 | 712 | 695 | 171.2 |
| D | 13 | 235 | 129477 | 752.39 | 712 | 695 | 171.2 |
| D | 8 | 112 | 78980 | 457.37 | 712 | 695 | 171.2 |
Histogram calculated using DETX and DETY for each event in the final _common_clean file
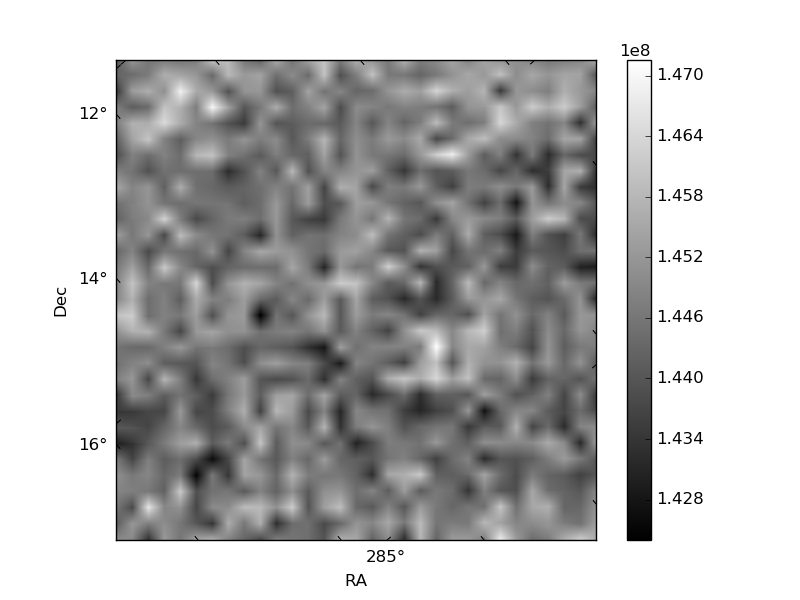
| Quadrant A | 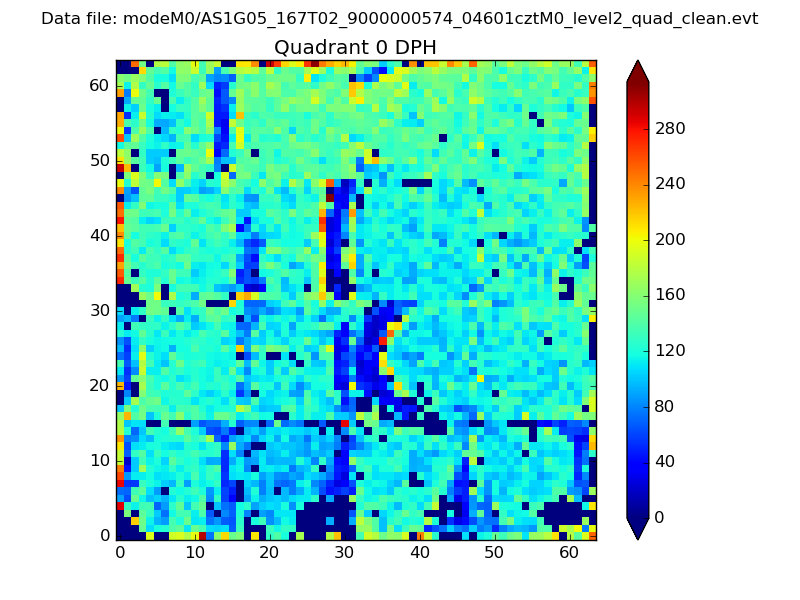 |
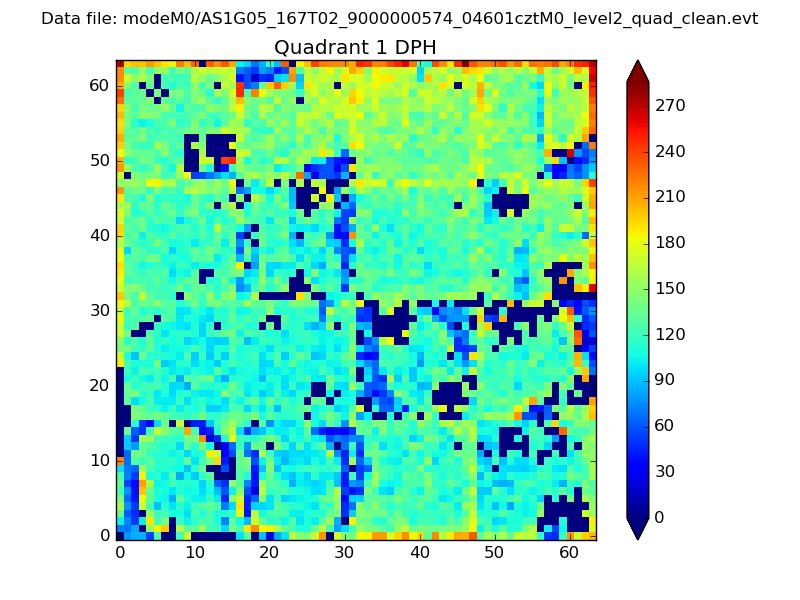 |
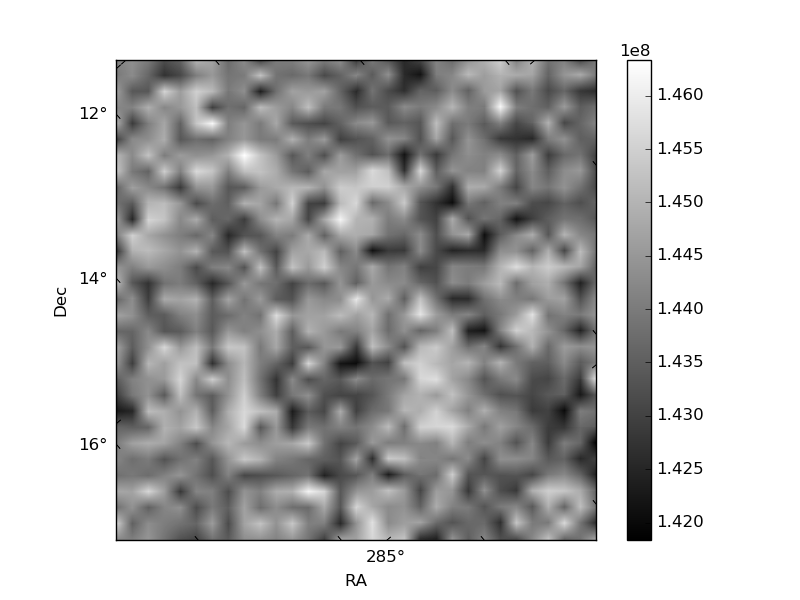
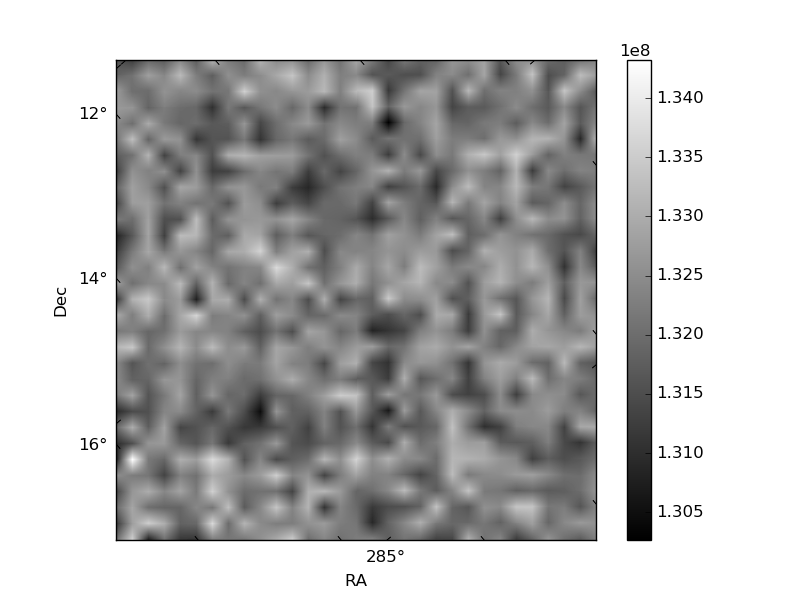
Quadrant B |
|---|---|---|---|
| Quadrant D |  |
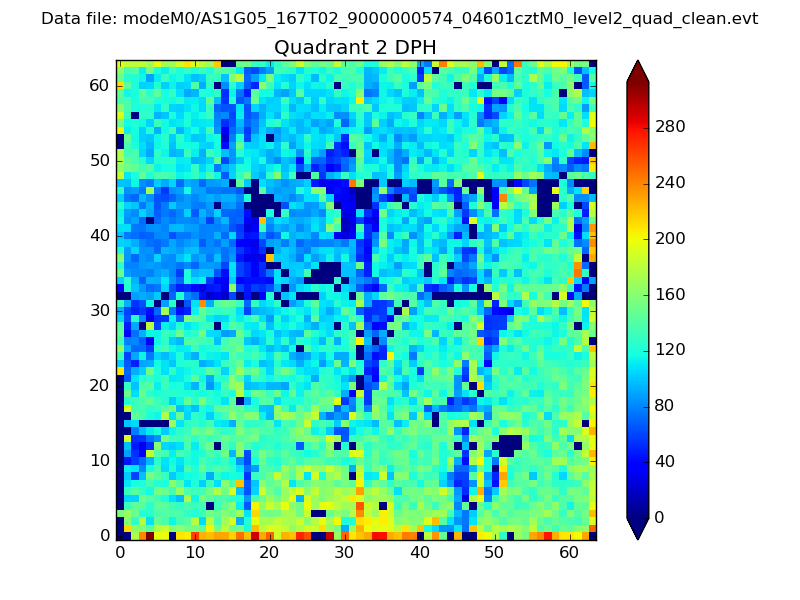 |
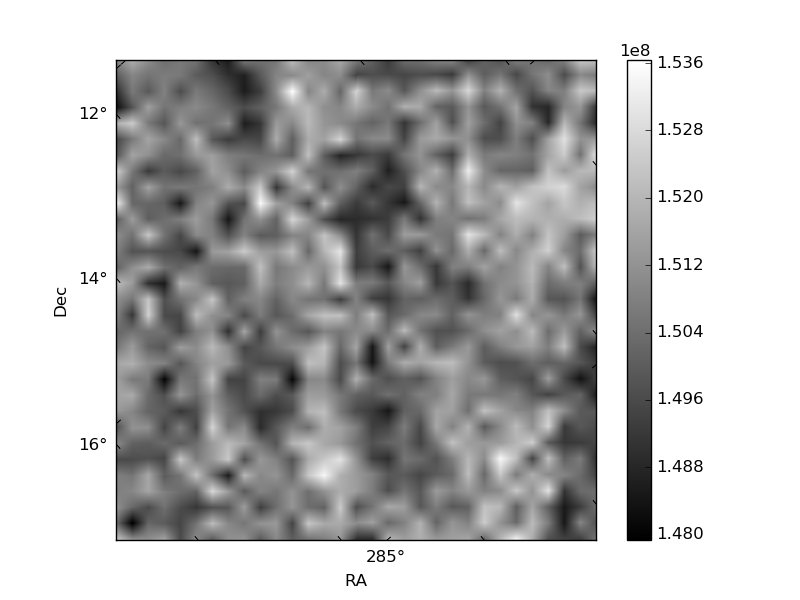
Quadrant C |
| Plot type | Count rate plots | Images |
|---|---|---|
| Comparison with Poisson distribution Blue bars denote a histogram of data divided into 1 sec bins. Red curve is a Poisson curve with rate = median count rate of data. |
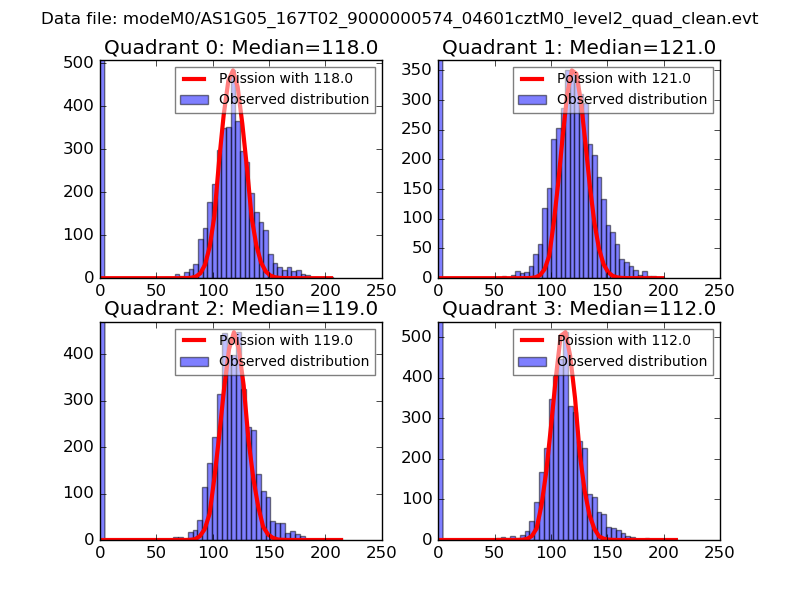 |
 |
| Quadrant-wise count rates Data is divided into 100 sec bins |
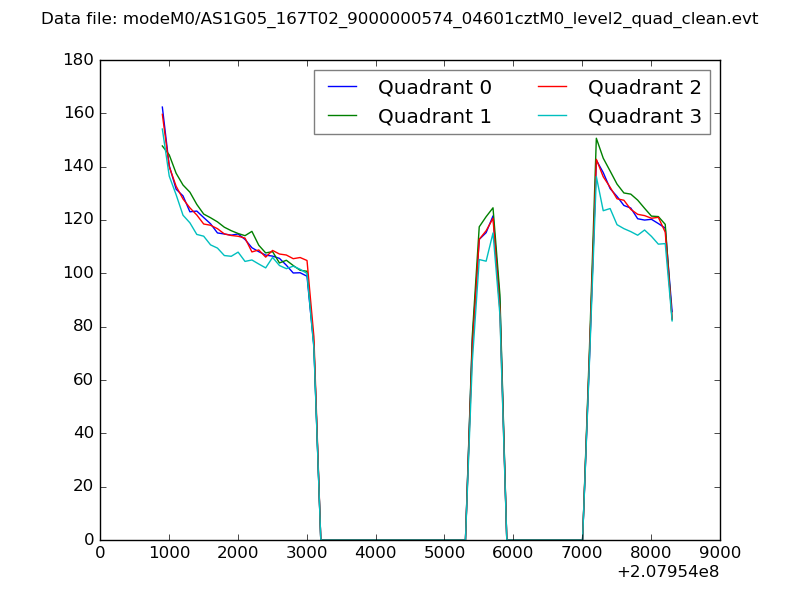 |
|
| Module-wise count rates for Quadrant A Data is divided into 100 sec bins |
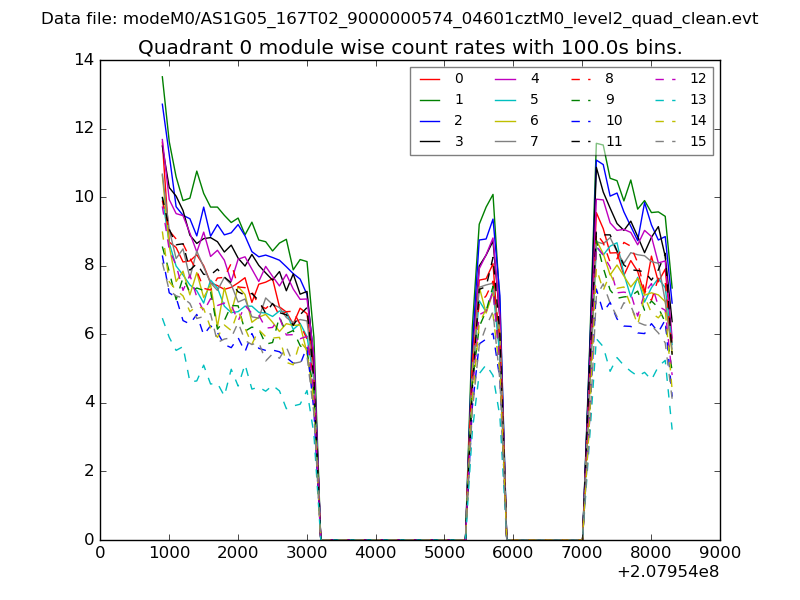 |
 |
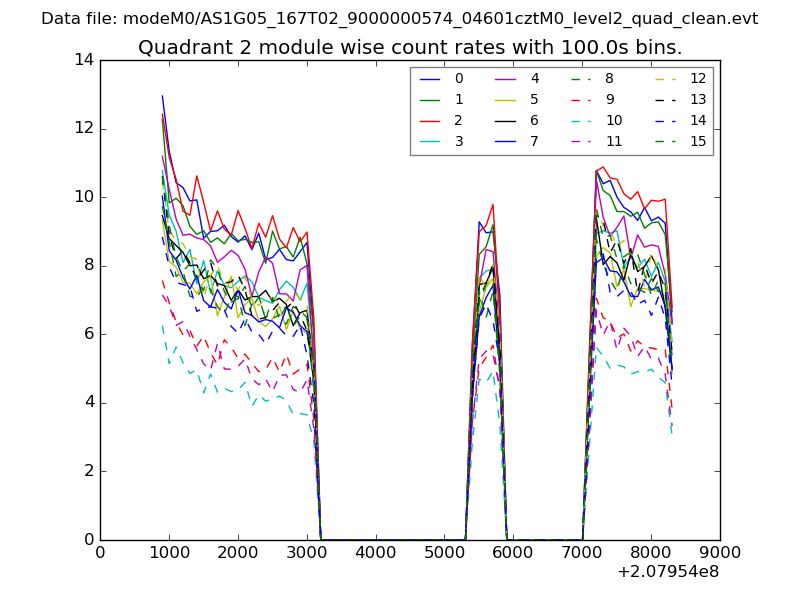
| Module-wise count rates for Quadrant B Data is divided into 100 sec bins |
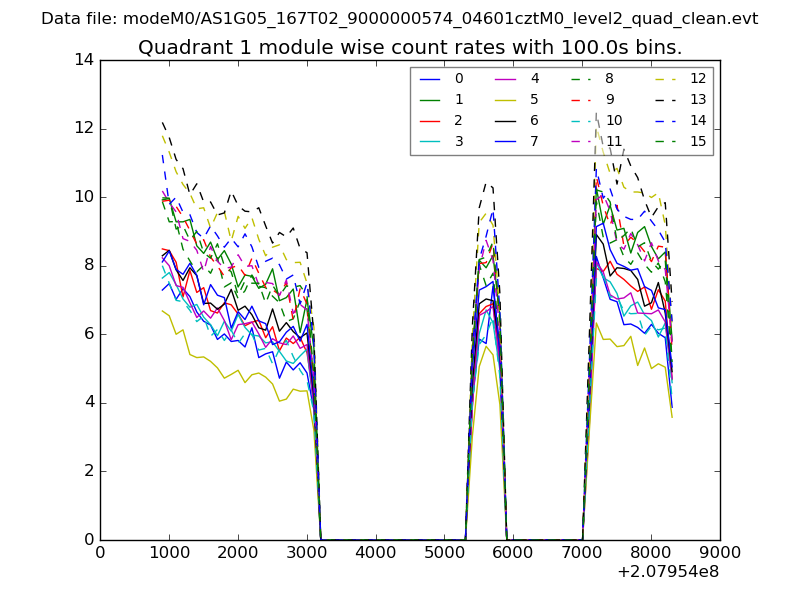 |
 |
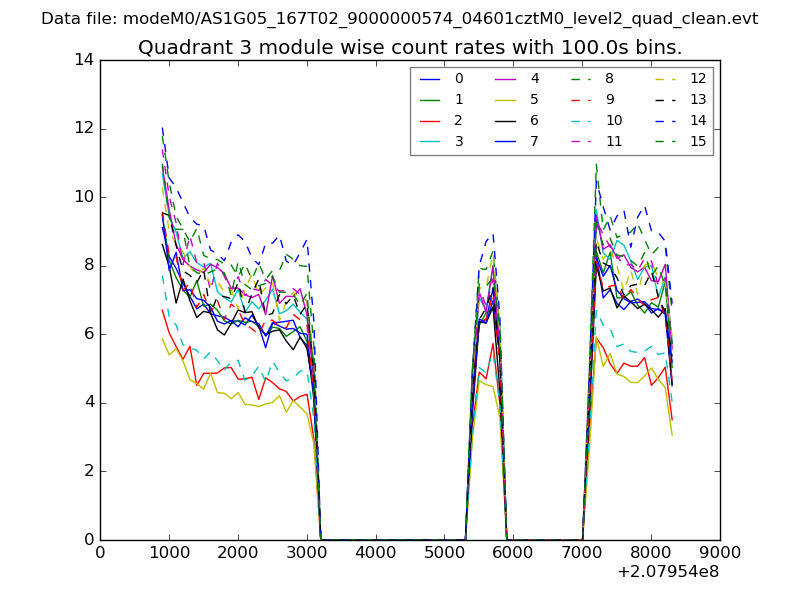
| Module-wise count rates for Quadrant C Data is divided into 100 sec bins |
 |
 |
| Module-wise count rates for Quadrant D Data is divided into 100 sec bins |
 |
 |
| Parameter | Plot |
|---|---|
| CZT HV Monitor | 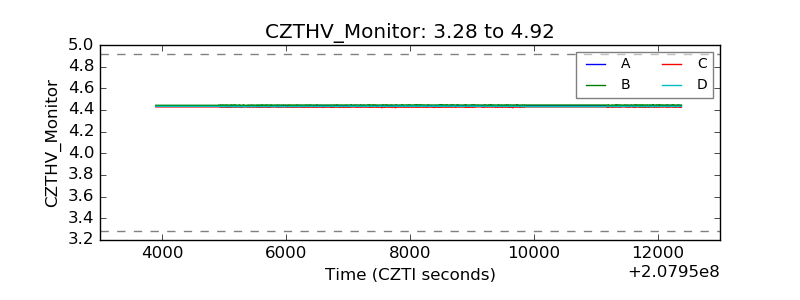 |
| D_VDD | 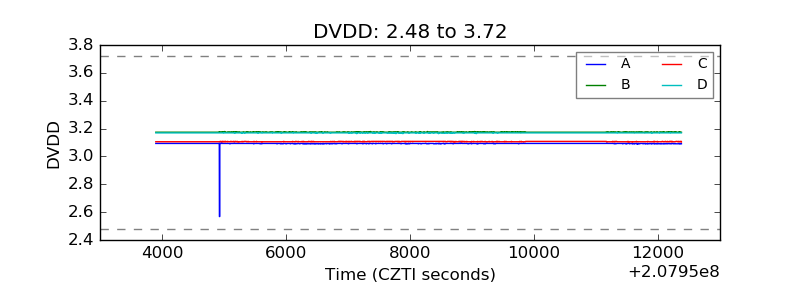 |
| Temperature 1 |  |
| Veto HV Monitor | 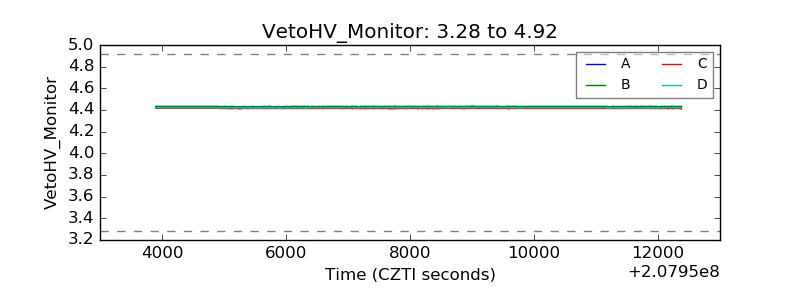 |
| Veto LLD |  |
| Alpha Counter | 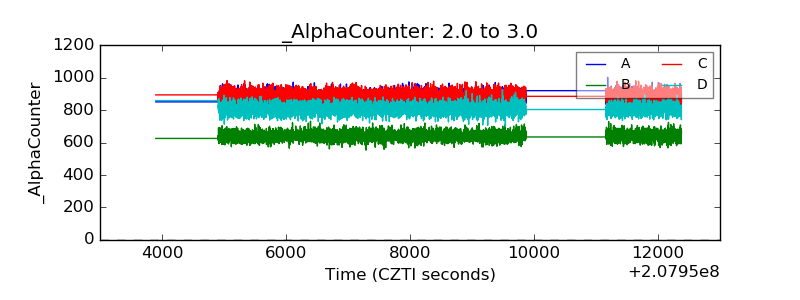 |
| _CPM_Rate | 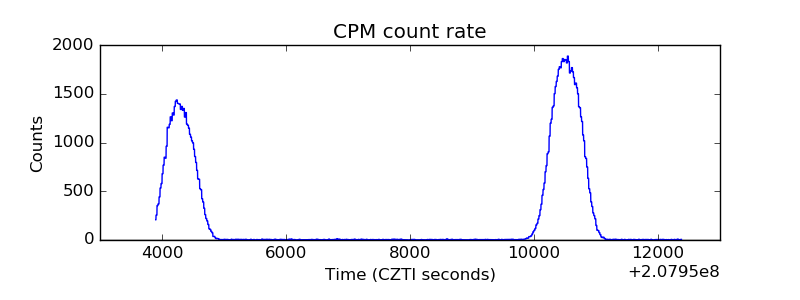 |
| CZT Counter | 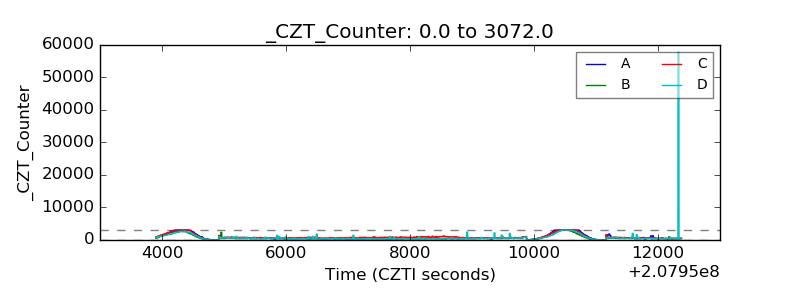 |
| +2.5 Volts monitor |  |
| +5 Volts monitor |  |
| _ROLL_ROT | 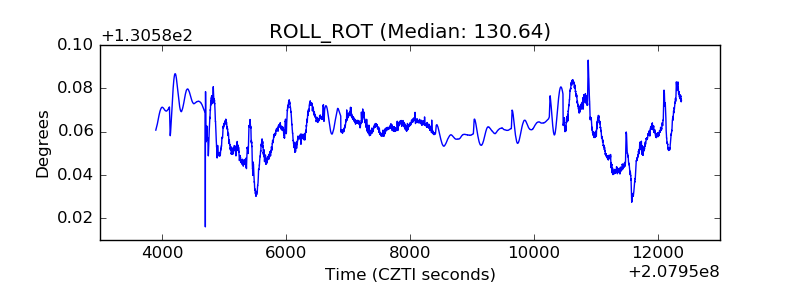 |
| _Roll_DEC | 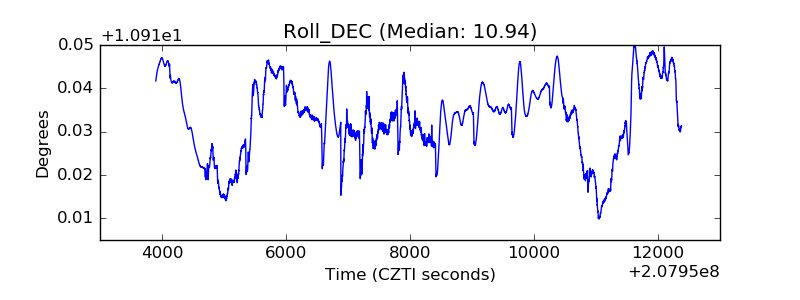 |
| _Roll_RA | 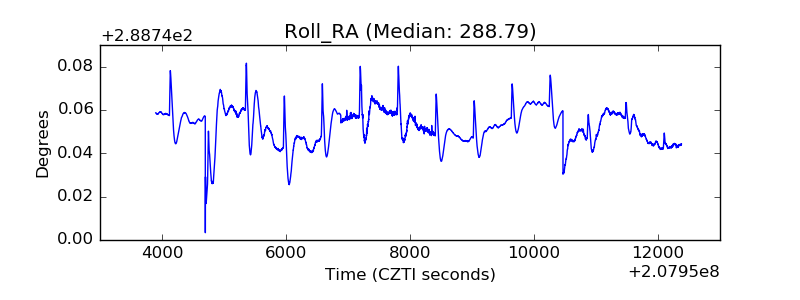 |
| Veto Counter | 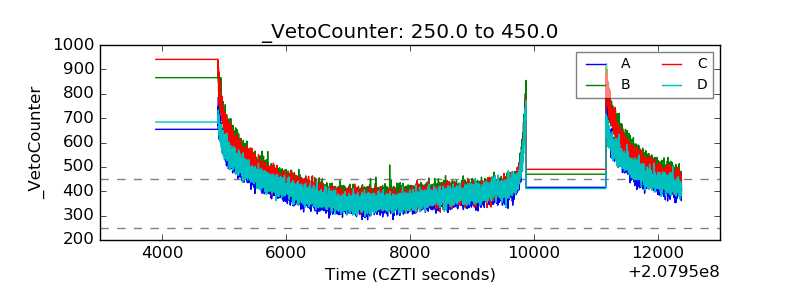 |