| Param | Original file | Final file |
|---|---|---|
| Filename | modeM0/AS1G05_167T02_9000000574_04602cztM0_level2.evt | modeM0/AS1G05_167T02_9000000574_04602cztM0_level2_quad_clean.evt |
| Size (bytes) | 455,224,320 | 76,515,840 |
| Size | 434.1 MB | 73.0 MB |
| Events in quadrant A | 2,997,943 | 474,430 |
| Events in quadrant B | 3,066,624 | 487,846 |
| Events in quadrant C | 4,196,495 | 476,184 |
| Events in quadrant D | 3,106,587 | 447,841 |
| Mode M0 | |||
|---|---|---|---|
| Quadrant | BADHDUFLAG | Total packets | Discarded packets |
| A | 0 | 13056 | 3 |
| B | 0 | 13039 | 2 |
| C | 0 | 16799 | 2 |
| D | 0 | 13719 | 2 |
| Mode SS | |||
|---|---|---|---|
| Quadrant | BADHDUFLAG | Total packets | Discarded packets |
| A | 0 | 126 | 0 |
| B | 0 | 126 | 0 |
| C | 0 | 126 | 0 |
| D | 0 | 126 | 0 |
| Mode M9 | |||
|---|---|---|---|
| Quadrant | BADHDUFLAG | Total packets | Discarded packets |
| A | 0 | 17 | 0 |
| B | 0 | 17 | 0 |
| C | 0 | 17 | 0 |
| D | 0 | 18 | 0 |
| Quadrant | Total seconds | Saturated seconds | Saturation percentage |
|---|---|---|---|
| A | 6166 | 46 | 0.746027% |
| B | 6166 | 53 | 0.859552% |
| C | 6166 | 39 | 0.632501% |
| D | 6166 | 71 | 1.151476% |
Noise dominated data is calculated using 1-second bins in cleaned event files. If a bin has >2000 counts, and if more than 50% of those come from <1% of pixels, then it is considered to be noise-dominated and hence unusable.
| Quadrant | # 1 sec bins | Bins with >0 counts | Bins with >2000 counts | High rate bins dominated by noise | Noise dominated (total time) | Noise dominated (detector-on time) | Marked lightcurve |
|---|---|---|---|---|---|---|---|
| A | 7466 | 6167 | 2 | 2 | 0.03% | 0.03% | 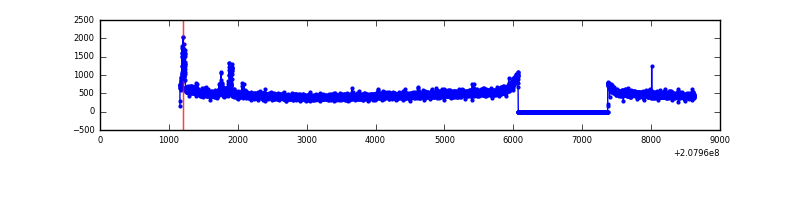 |
| B | 7466 | 6167 | 4 | 4 | 0.05% | 0.06% | 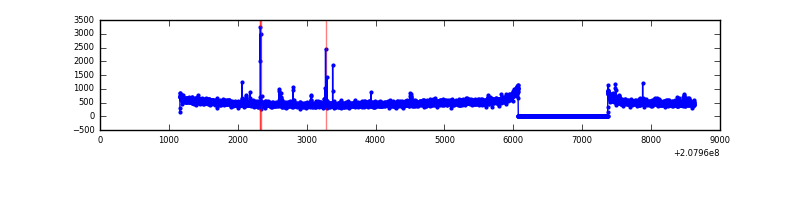 |
| C | 7466 | 6167 | 0 | 0 | 0.00% | 0.00% | 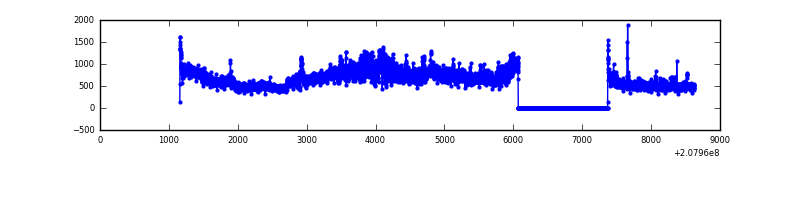 |
| D | 7466 | 6167 | 27 | 27 | 0.36% | 0.44% | 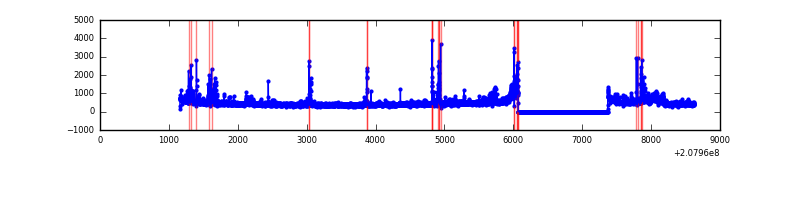 |
Top three noisy pixels from each quadrant. If the there are fewer than three noisy pixels in the level2.evt file, extra rows are filled as -1
| Pixel properties | Quadrant properties | ||||||
|---|---|---|---|---|---|---|---|
| Quadrant | DetID | PixID | Counts | Sigma | Mean | Median | Sigma |
| A | 15 | 174 | 105207 | 684.31 | 751 | 737 | 152.7 |
| A | 0 | 226 | 7618 | 45.07 | 751 | 737 | 152.7 |
| A | 12 | 194 | 7298 | 42.98 | 751 | 737 | 152.7 |
| B | 14 | 167 | 29165 | 196.57 | 766 | 750 | 144.6 |
| B | 4 | 48 | 17874 | 118.46 | 766 | 750 | 144.6 |
| B | 4 | 80 | 13867 | 90.74 | 766 | 750 | 144.6 |
| C | 14 | 48 | 1317104 | 7680.5 | 732 | 737 | 171.4 |
| C | 12 | 4 | 13003 | 71.57 | 732 | 737 | 171.4 |
| C | 13 | 61 | 5970 | 30.53 | 732 | 737 | 171.4 |
| D | 13 | 235 | 200694 | 1162.16 | 714 | 696 | 172.1 |
| D | 2 | 136 | 71176 | 409.55 | 714 | 696 | 172.1 |
| D | 13 | 239 | 39855 | 227.55 | 714 | 696 | 172.1 |
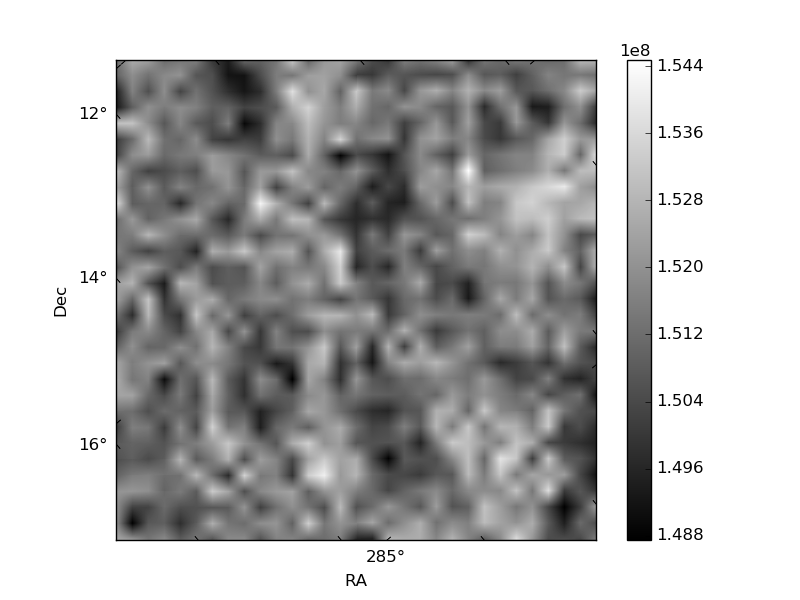
Histogram calculated using DETX and DETY for each event in the final _common_clean file
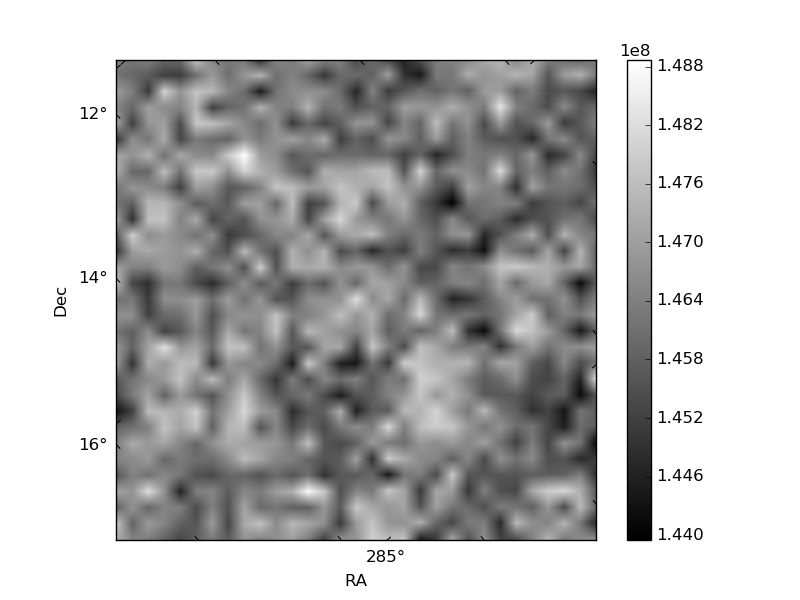
| Quadrant A | 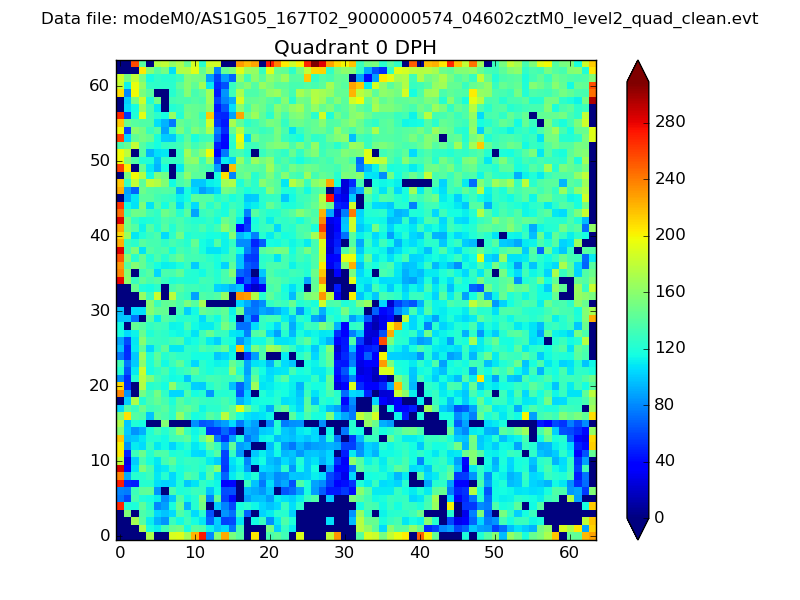 |
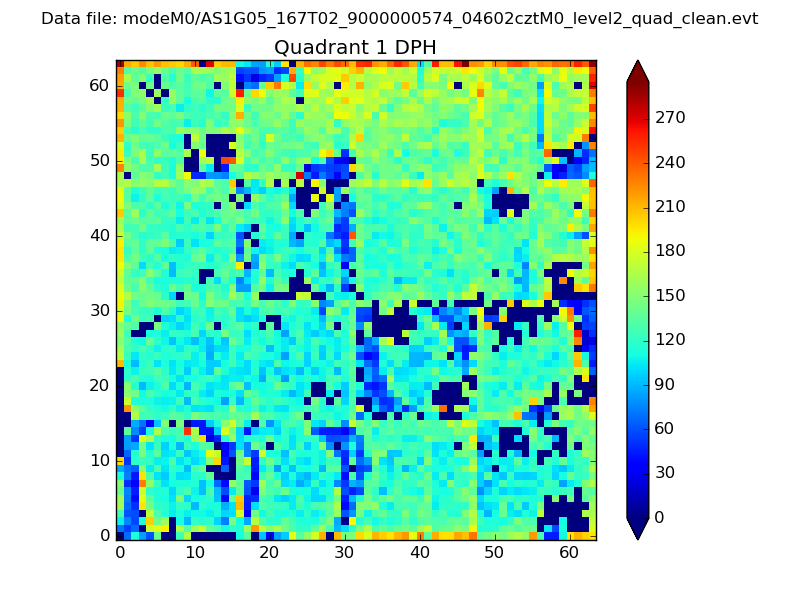 |
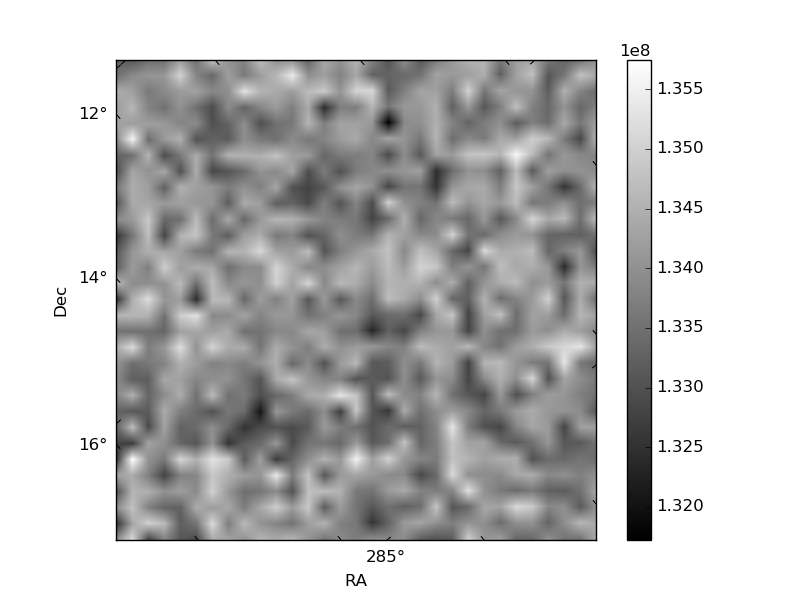
Quadrant B |
|---|---|---|---|
| Quadrant D | 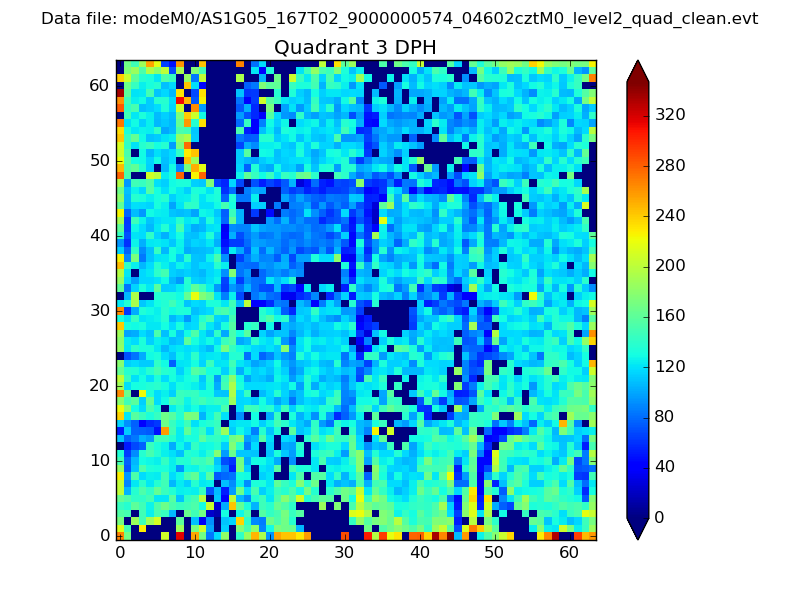 |
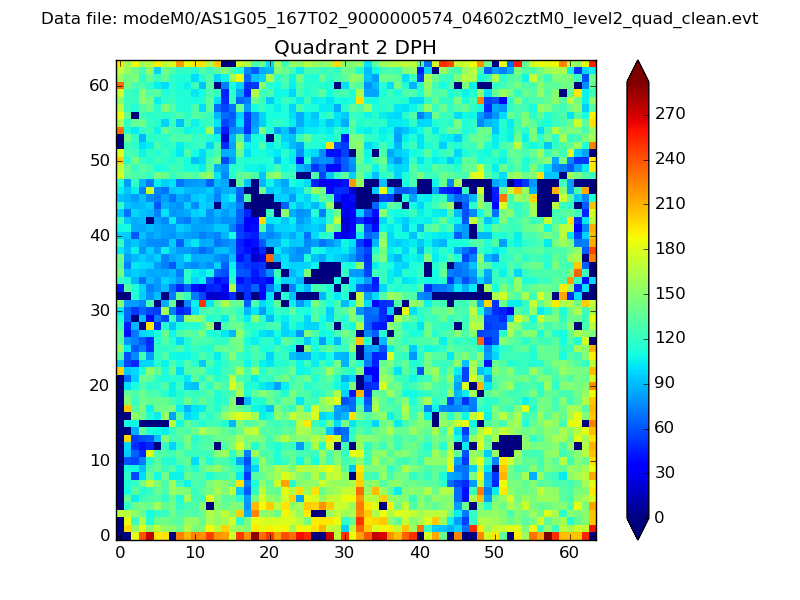 |
Quadrant C |
| Plot type | Count rate plots | Images |
|---|---|---|
| Comparison with Poisson distribution Blue bars denote a histogram of data divided into 1 sec bins. Red curve is a Poisson curve with rate = median count rate of data. |
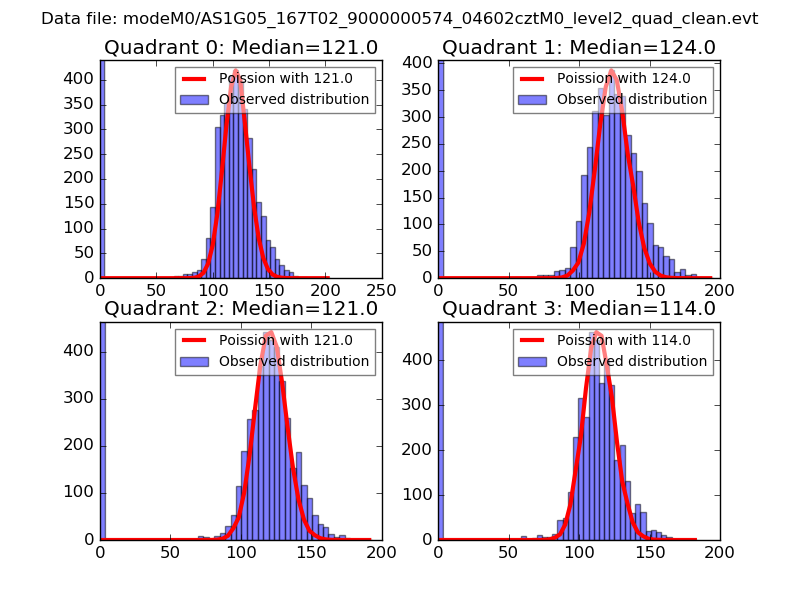 |
 |
| Quadrant-wise count rates Data is divided into 100 sec bins |
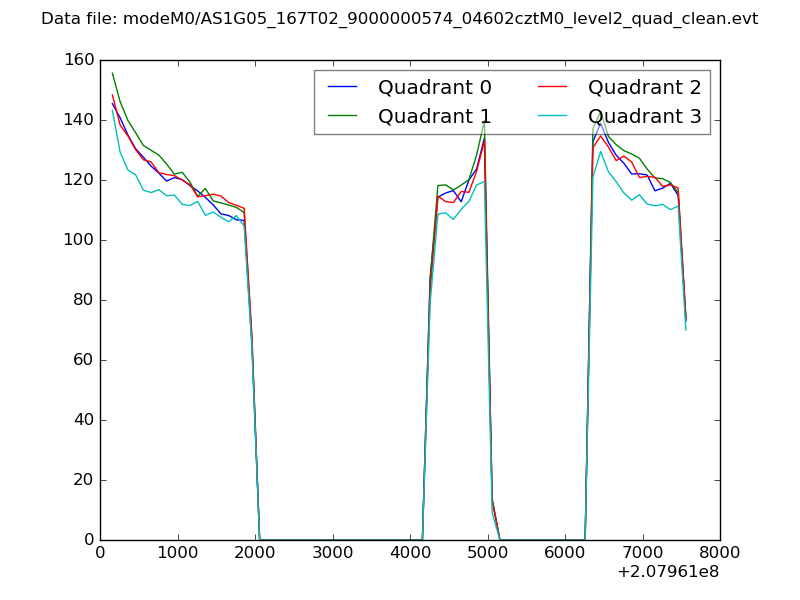 |
|
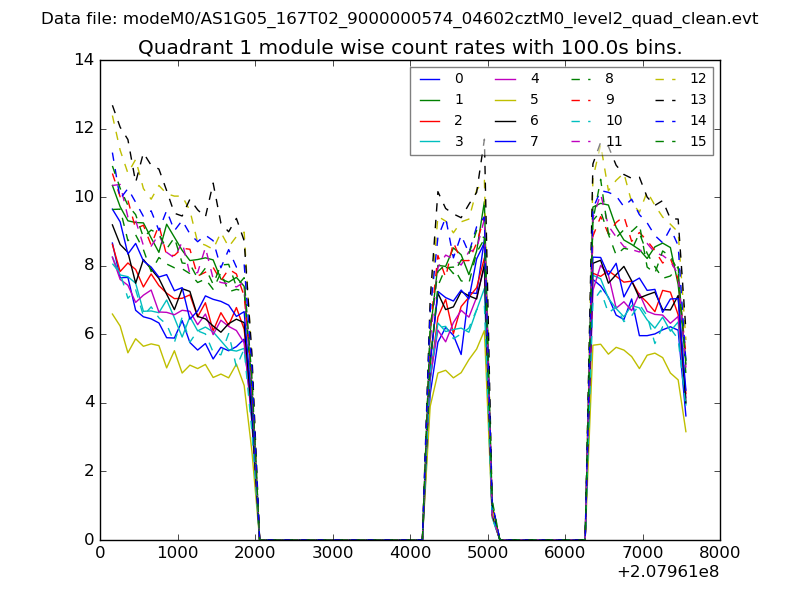
| Module-wise count rates for Quadrant A Data is divided into 100 sec bins |
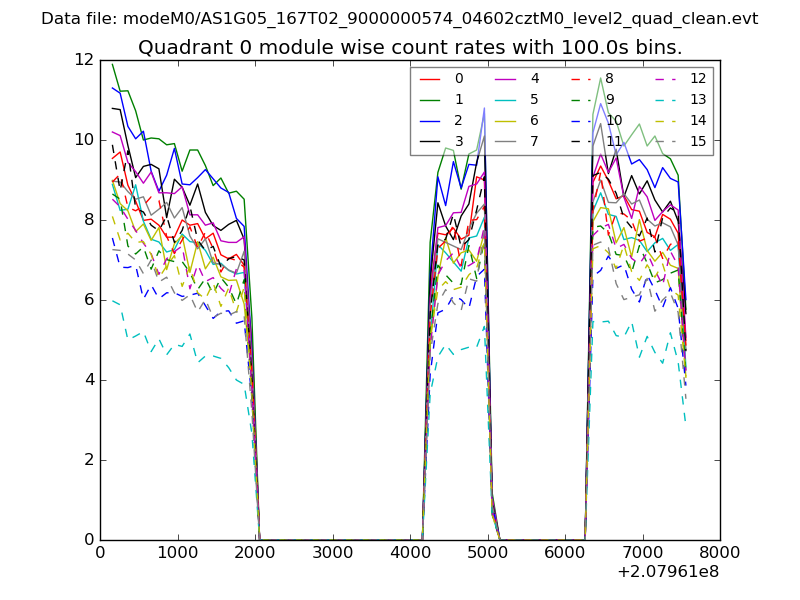 |
 |
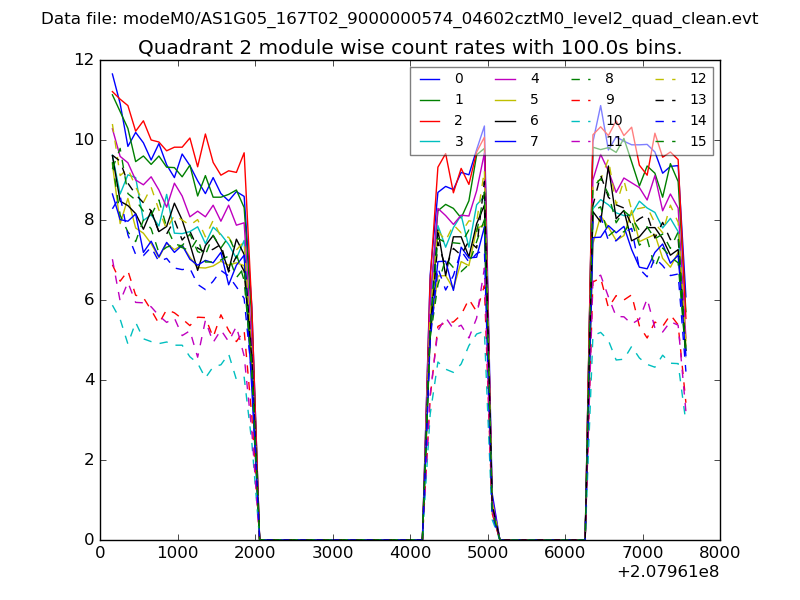
| Module-wise count rates for Quadrant B Data is divided into 100 sec bins |
 |
 |
| Module-wise count rates for Quadrant C Data is divided into 100 sec bins |
 |
 |
| Module-wise count rates for Quadrant D Data is divided into 100 sec bins |
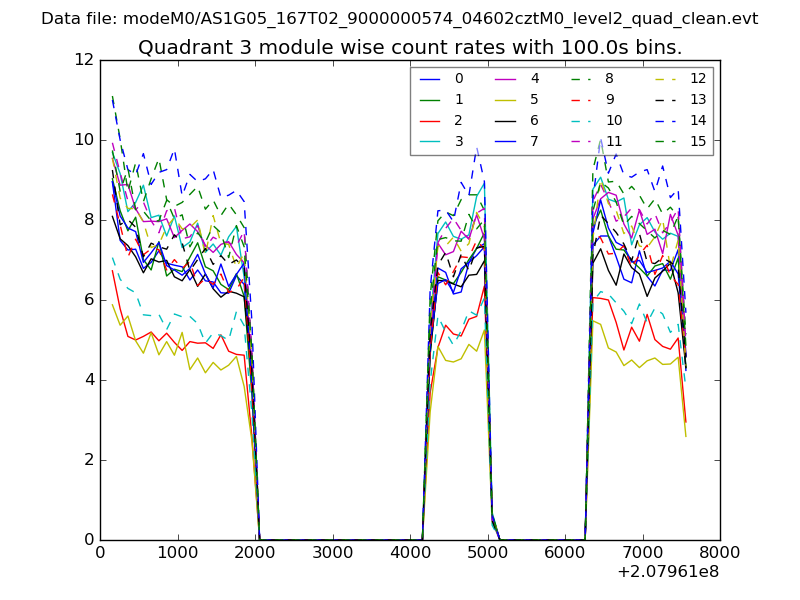 |
 |
| Parameter | Plot |
|---|---|
| CZT HV Monitor | 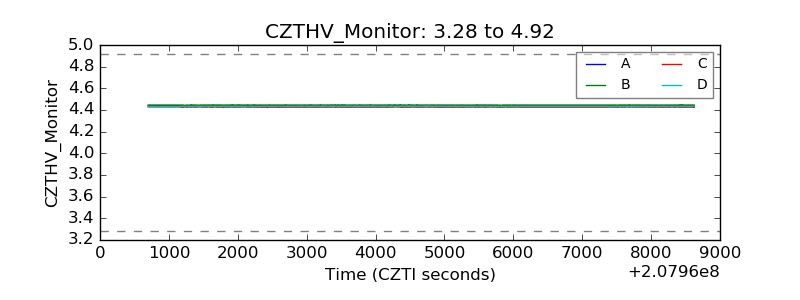 |
| D_VDD | 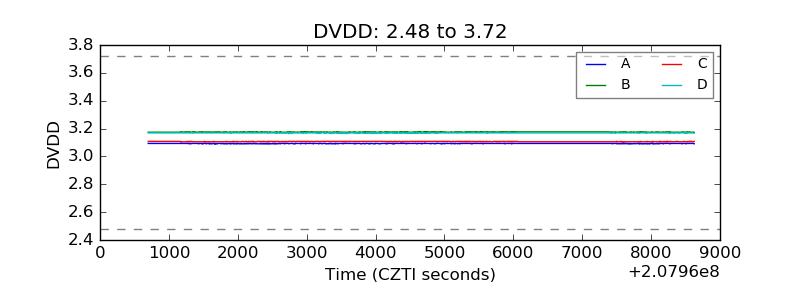 |
| Temperature 1 | 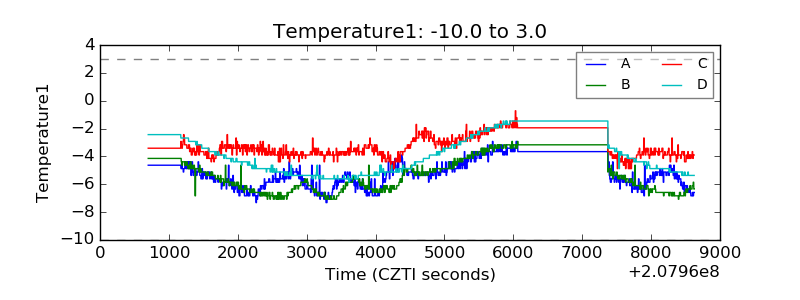 |
| Veto HV Monitor | 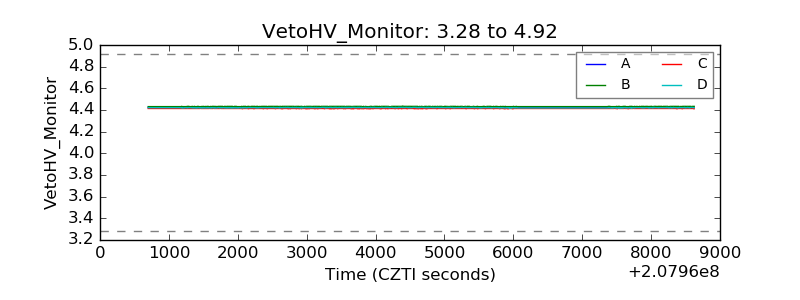 |
| Veto LLD | 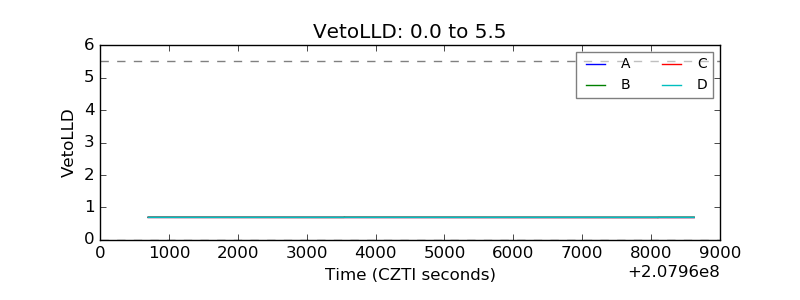 |
| Alpha Counter | 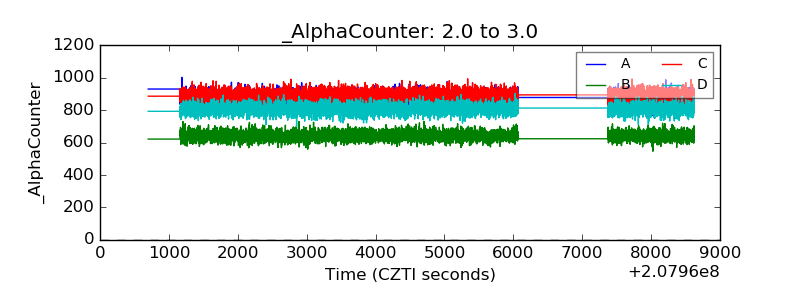 |
| _CPM_Rate | 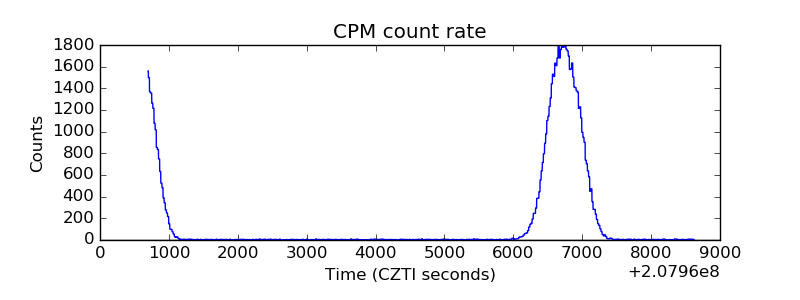 |
| CZT Counter | 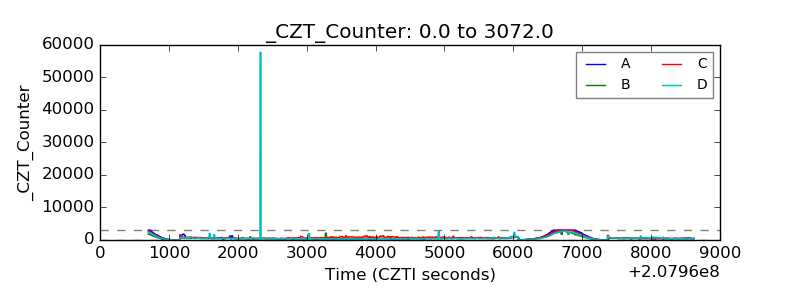 |
| +2.5 Volts monitor |  |
| +5 Volts monitor |  |
| _ROLL_ROT | 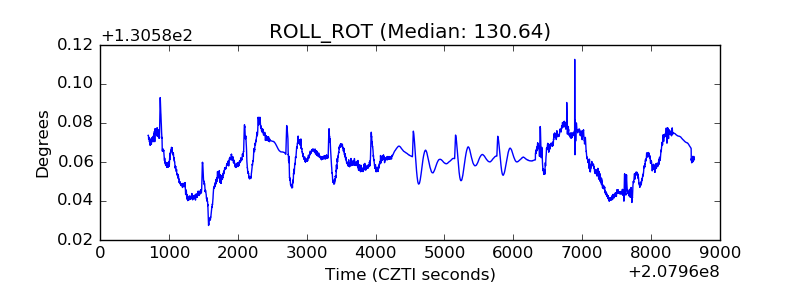 |
| _Roll_DEC | 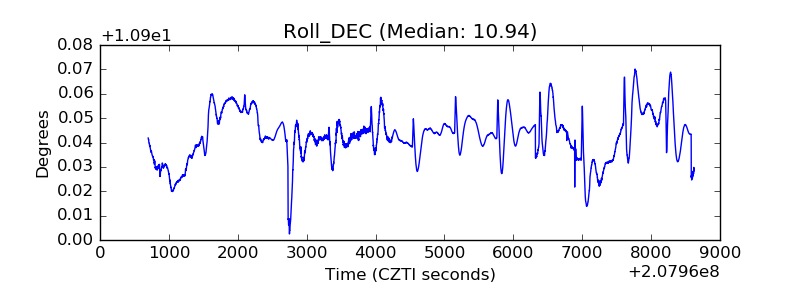 |
| _Roll_RA | 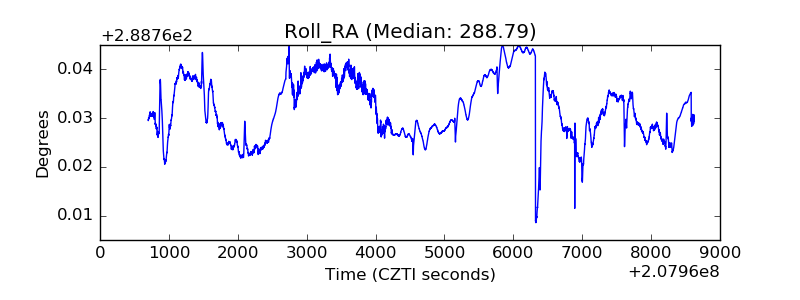 |
| Veto Counter | 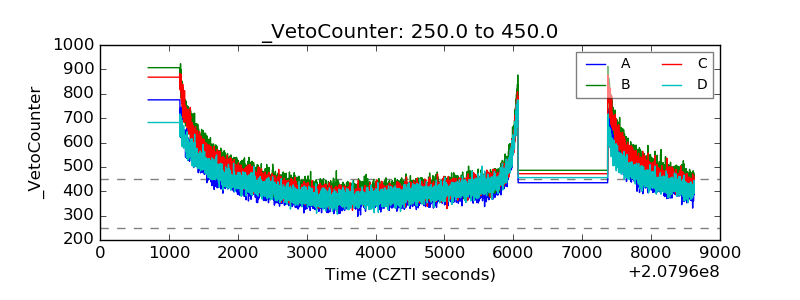 |