| Param | Original file | Final file |
|---|---|---|
| Filename | modeM0/AS1G05_167T02_9000000574_04603cztM0_level2.evt | modeM0/AS1G05_167T02_9000000574_04603cztM0_level2_quad_clean.evt |
| Size (bytes) | 427,818,240 | 72,973,440 |
| Size | 408.0 MB | 69.6 MB |
| Events in quadrant A | 2,902,009 | 445,228 |
| Events in quadrant B | 3,111,133 | 457,763 |
| Events in quadrant C | 3,433,635 | 451,307 |
| Events in quadrant D | 3,086,677 | 420,869 |
| Mode M0 | |||
|---|---|---|---|
| Quadrant | BADHDUFLAG | Total packets | Discarded packets |
| A | 0 | 12826 | 3 |
| B | 0 | 13136 | 2 |
| C | 0 | 13994 | 2 |
| D | 0 | 13708 | 2 |
| Mode SS | |||
|---|---|---|---|
| Quadrant | BADHDUFLAG | Total packets | Discarded packets |
| A | 0 | 128 | 0 |
| B | 0 | 128 | 0 |
| C | 0 | 128 | 0 |
| D | 0 | 128 | 0 |
| Mode M9 | |||
|---|---|---|---|
| Quadrant | BADHDUFLAG | Total packets | Discarded packets |
| A | 0 | 27 | 0 |
| B | 0 | 27 | 0 |
| C | 0 | 27 | 0 |
| D | 0 | 27 | 0 |
| Quadrant | Total seconds | Saturated seconds | Saturation percentage |
|---|---|---|---|
| A | 6225 | 31 | 0.497992% |
| B | 6225 | 36 | 0.578313% |
| C | 6225 | 24 | 0.385542% |
| D | 6225 | 48 | 0.771084% |
Noise dominated data is calculated using 1-second bins in cleaned event files. If a bin has >2000 counts, and if more than 50% of those come from <1% of pixels, then it is considered to be noise-dominated and hence unusable.
| Quadrant | # 1 sec bins | Bins with >0 counts | Bins with >2000 counts | High rate bins dominated by noise | Noise dominated (total time) | Noise dominated (detector-on time) | Marked lightcurve |
|---|---|---|---|---|---|---|---|
| A | 8895 | 6227 | 0 | 0 | 0.00% | 0.00% | 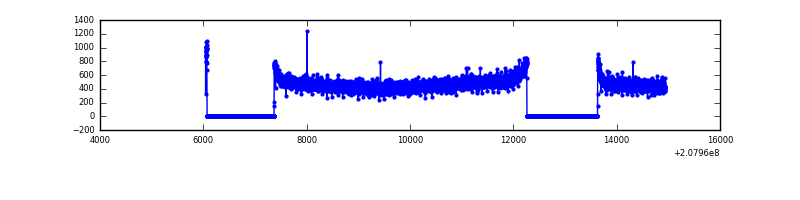 |
| B | 8895 | 6227 | 0 | 0 | 0.00% | 0.00% | 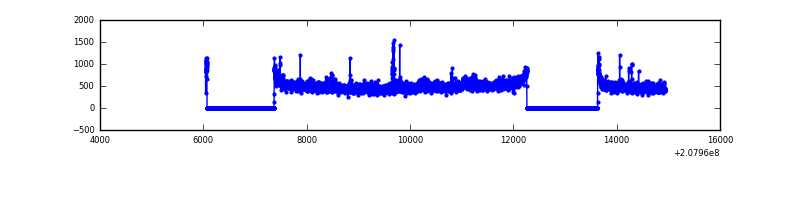 |
| C | 8895 | 6227 | 0 | 0 | 0.00% | 0.00% | 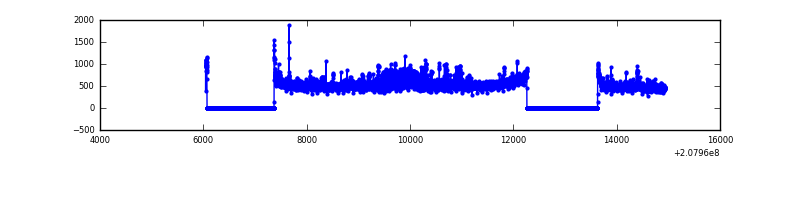 |
| D | 8895 | 6227 | 23 | 23 | 0.26% | 0.37% | 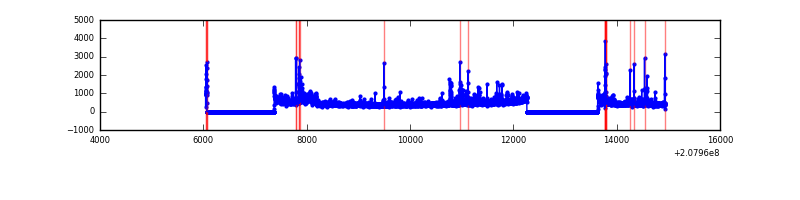 |
Top three noisy pixels from each quadrant. If the there are fewer than three noisy pixels in the level2.evt file, extra rows are filled as -1
| Pixel properties | Quadrant properties | ||||||
|---|---|---|---|---|---|---|---|
| Quadrant | DetID | PixID | Counts | Sigma | Mean | Median | Sigma |
| A | 0 | 226 | 7928 | 46.78 | 751 | 737 | 153.7 |
| A | 12 | 194 | 7333 | 42.91 | 751 | 737 | 153.7 |
| A | 0 | 247 | 6825 | 39.6 | 751 | 737 | 153.7 |
| B | 15 | 204 | 42012 | 284.36 | 765 | 747 | 145.1 |
| B | 0 | 228 | 38693 | 261.49 | 765 | 747 | 145.1 |
| B | 4 | 172 | 21604 | 143.73 | 765 | 747 | 145.1 |
| C | 14 | 48 | 552461 | 3199.05 | 733 | 738 | 172.5 |
| C | 12 | 4 | 12186 | 66.38 | 733 | 738 | 172.5 |
| C | 9 | 54 | 6371 | 32.66 | 733 | 738 | 172.5 |
| D | 13 | 235 | 184275 | 1060.92 | 716 | 697 | 173.0 |
| D | 2 | 136 | 90744 | 520.39 | 716 | 697 | 173.0 |
| D | 10 | 15 | 50712 | 289.04 | 716 | 697 | 173.0 |
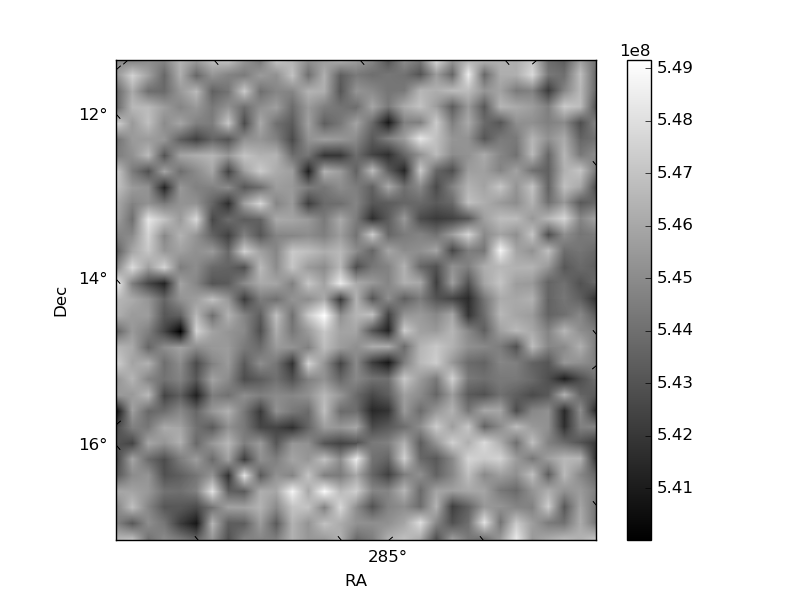
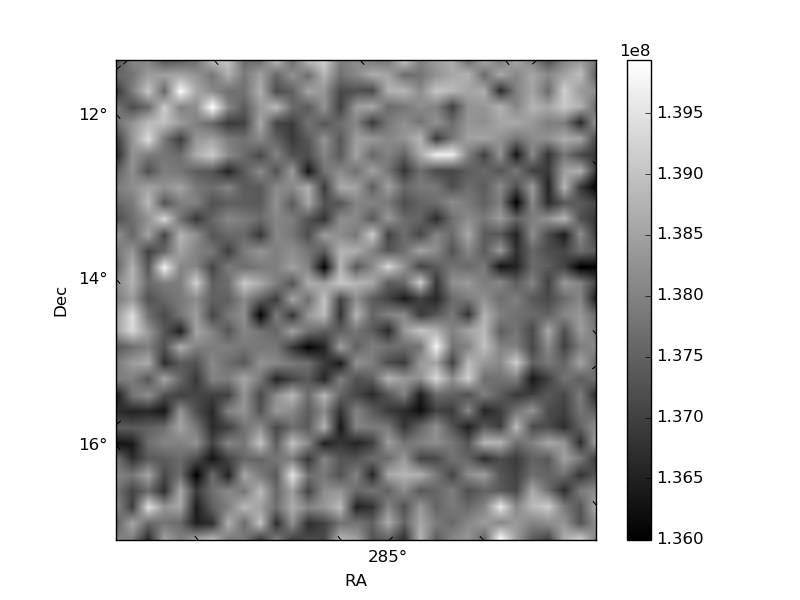
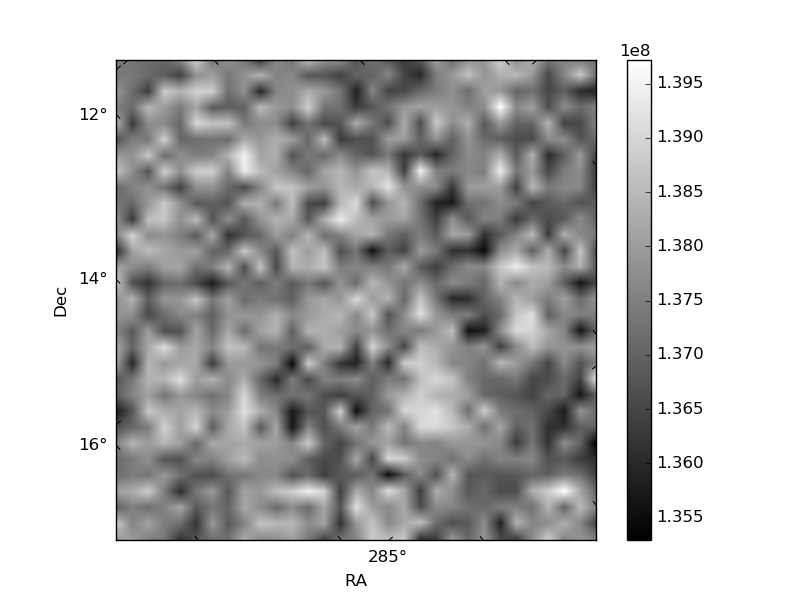
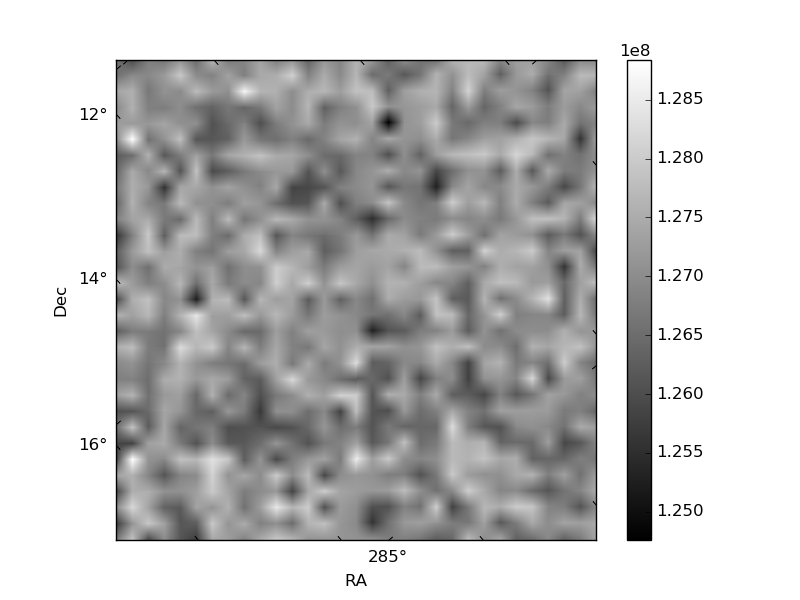
Histogram calculated using DETX and DETY for each event in the final _common_clean file
| Quadrant A | 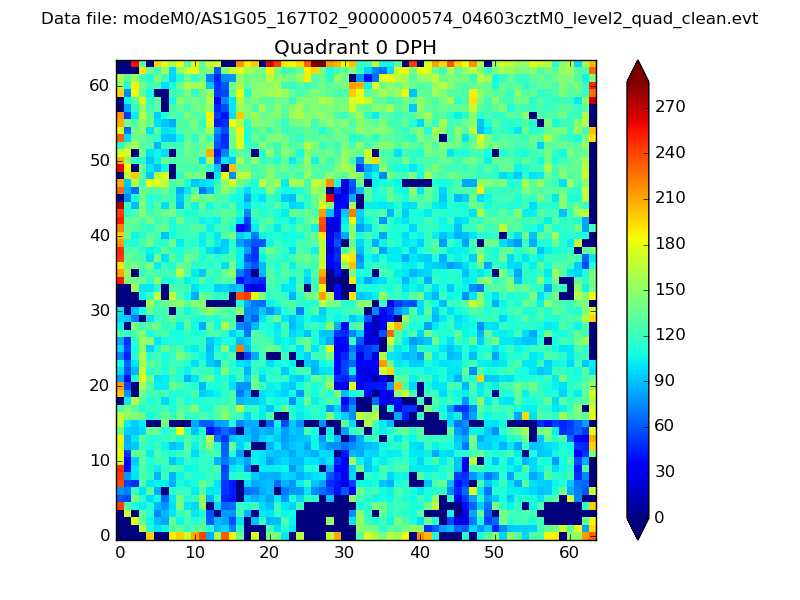 |
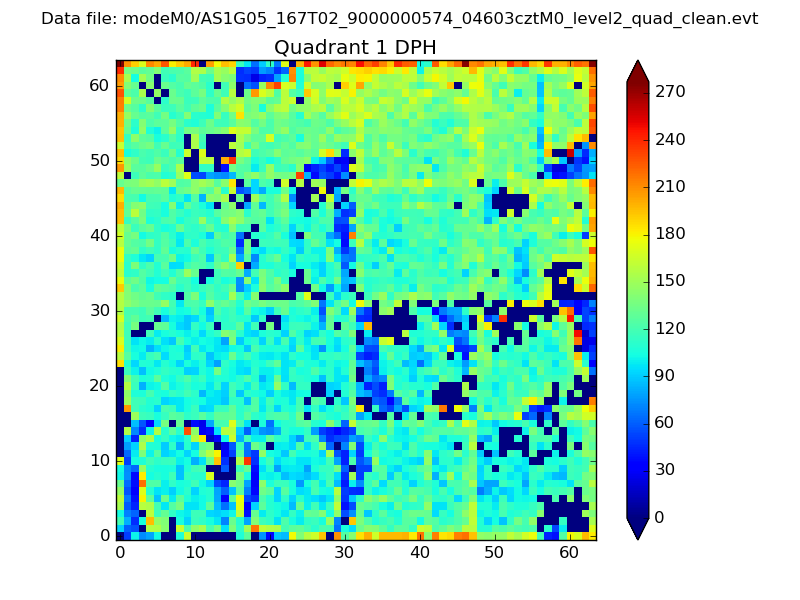 |
Quadrant B |
|---|---|---|---|
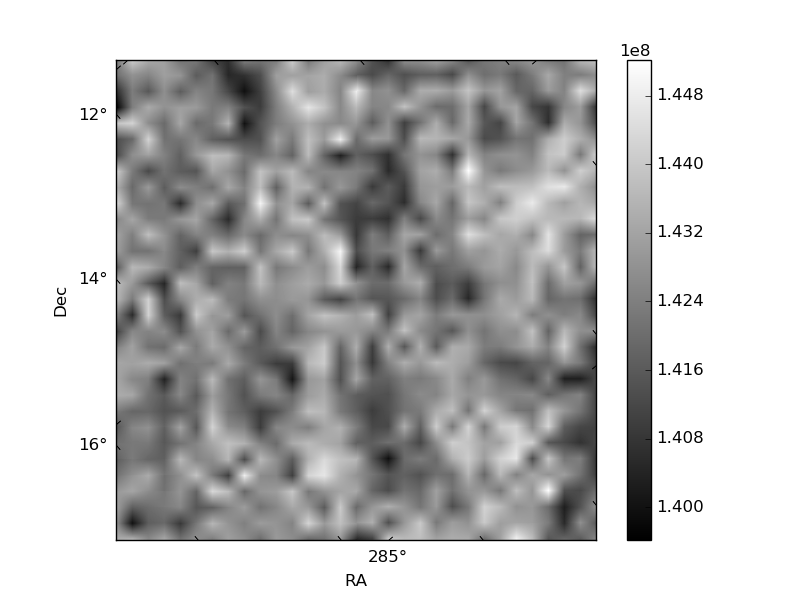
| Quadrant D | 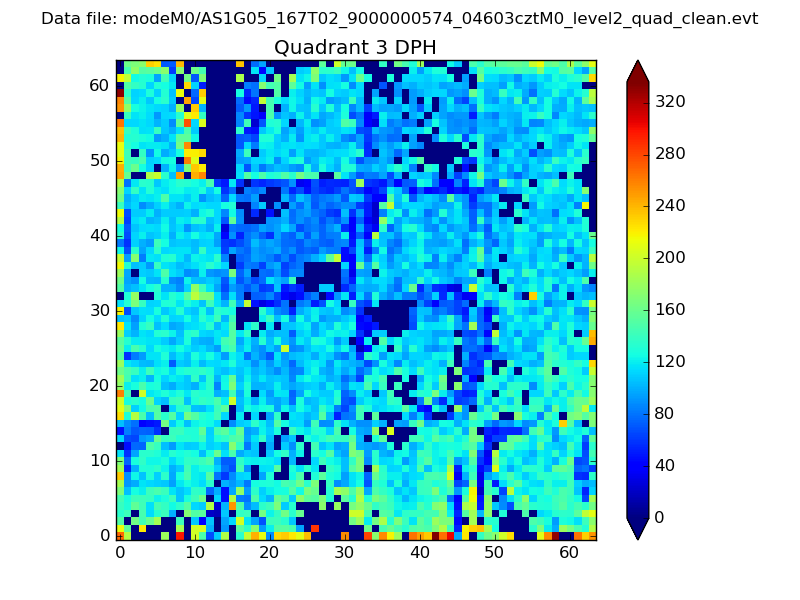 |
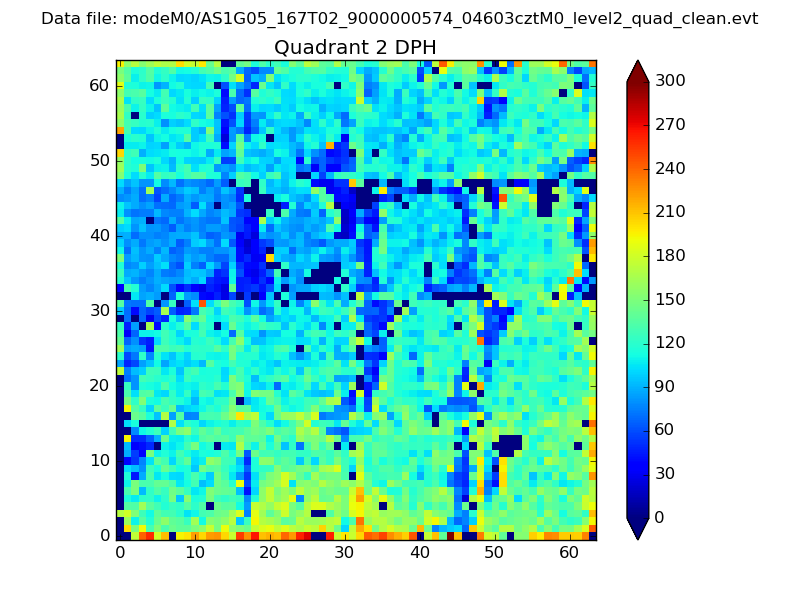 |
Quadrant C |
| Plot type | Count rate plots | Images |
|---|---|---|
| Comparison with Poisson distribution Blue bars denote a histogram of data divided into 1 sec bins. Red curve is a Poisson curve with rate = median count rate of data. |
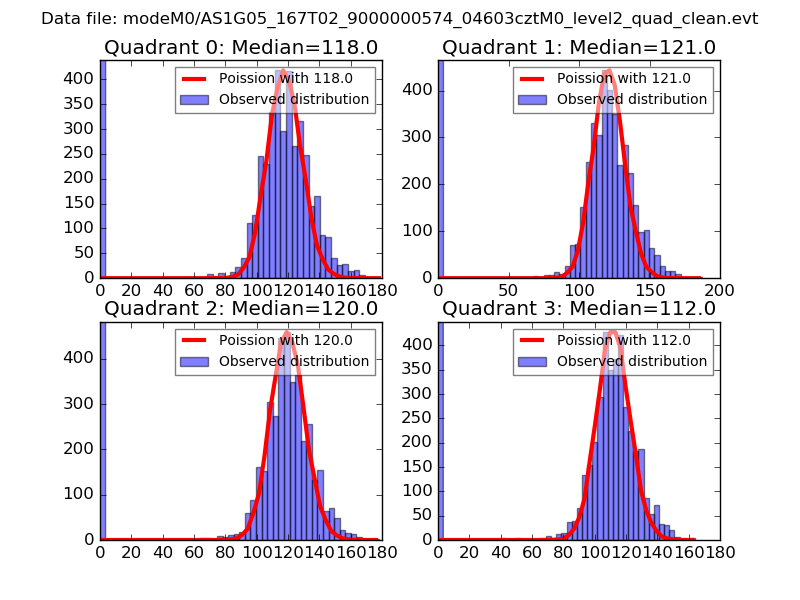 |
 |
| Quadrant-wise count rates Data is divided into 100 sec bins |
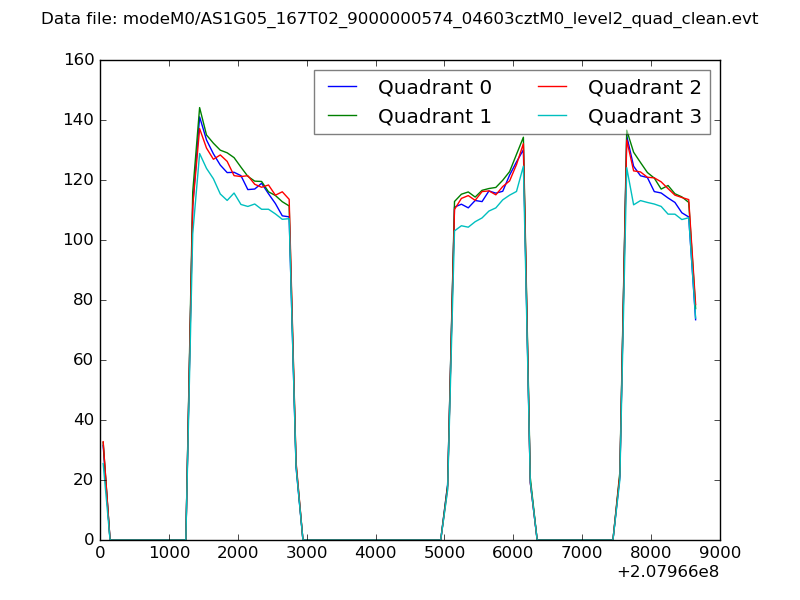 |
|
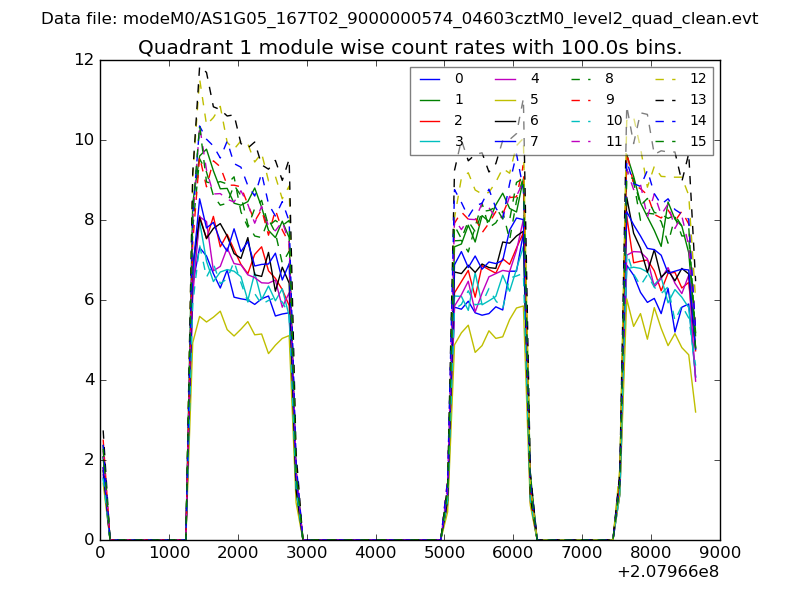
| Module-wise count rates for Quadrant A Data is divided into 100 sec bins |
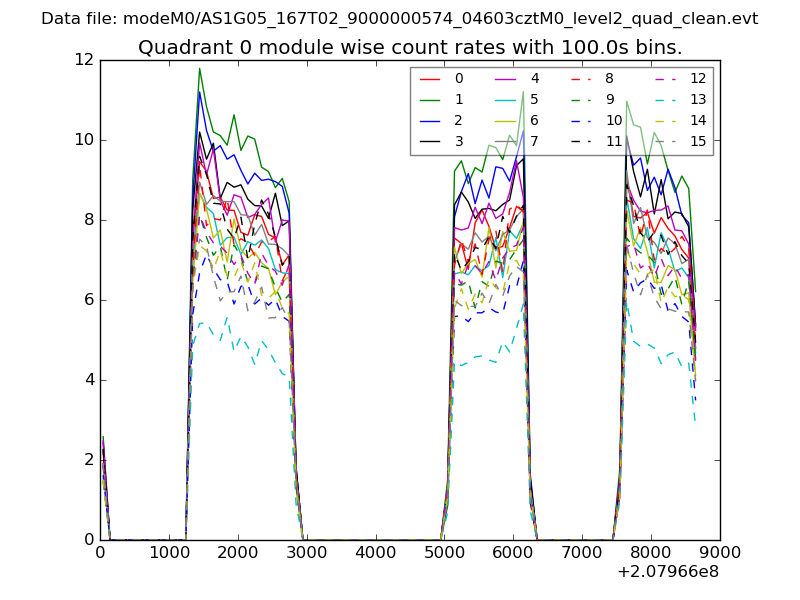 |
 |
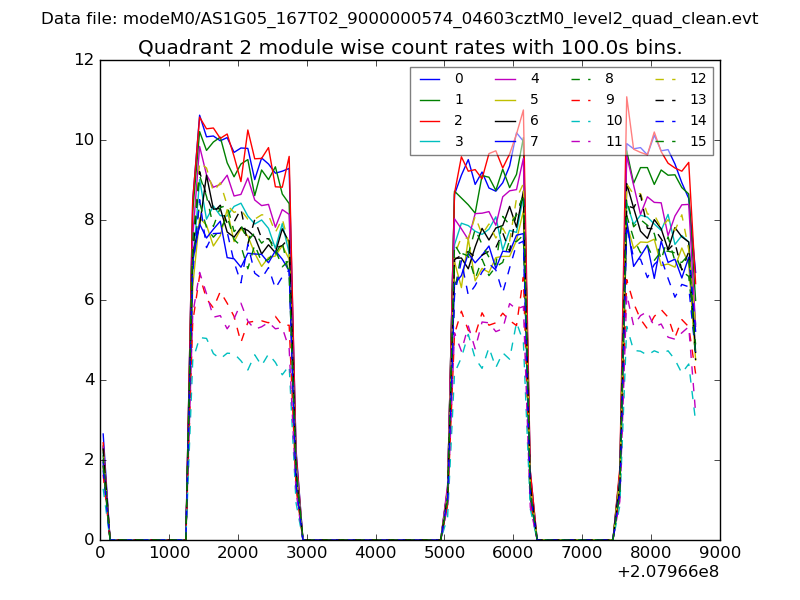
| Module-wise count rates for Quadrant B Data is divided into 100 sec bins |
 |
 |
| Module-wise count rates for Quadrant C Data is divided into 100 sec bins |
 |
 |
| Module-wise count rates for Quadrant D Data is divided into 100 sec bins |
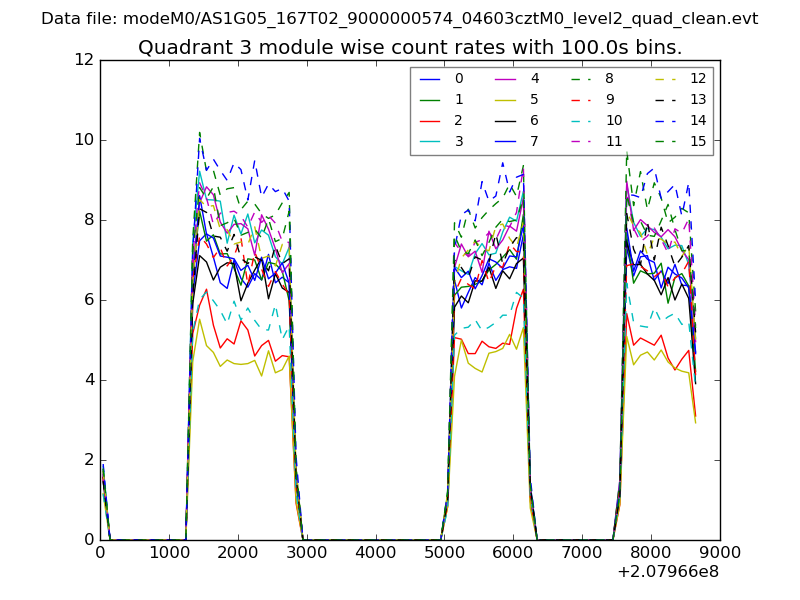 |
 |
| Parameter | Plot |
|---|---|
| CZT HV Monitor | 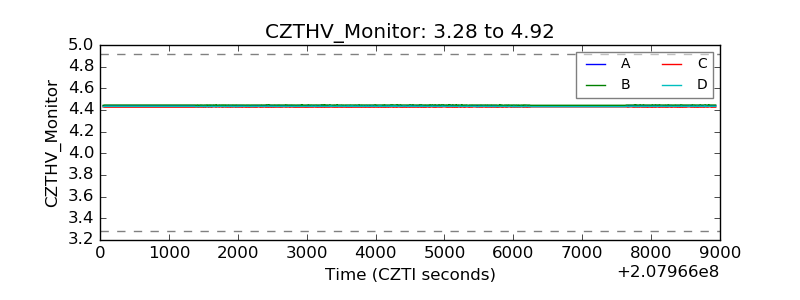 |
| D_VDD | 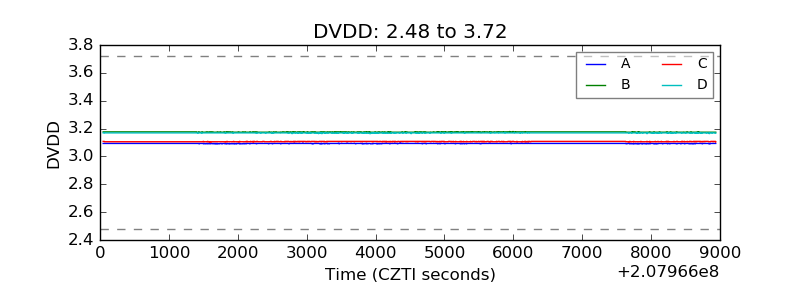 |
| Temperature 1 | 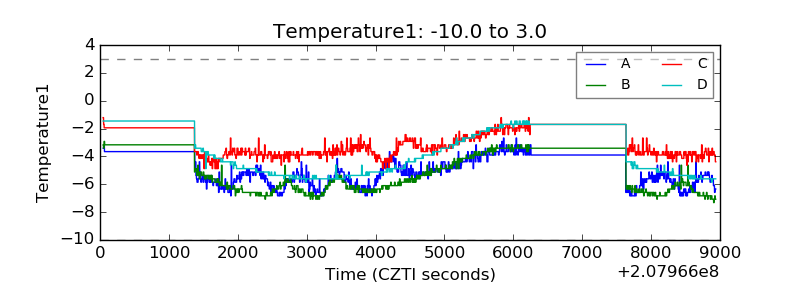 |
| Veto HV Monitor | 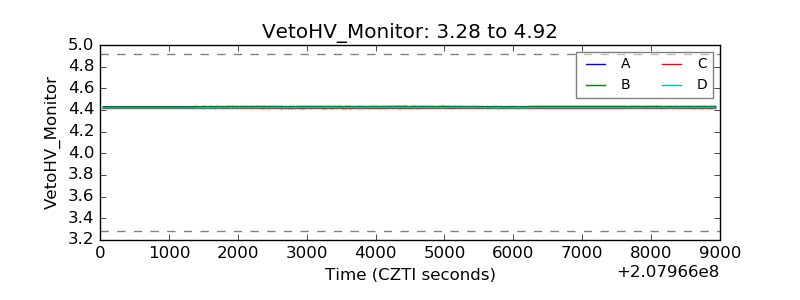 |
| Veto LLD | 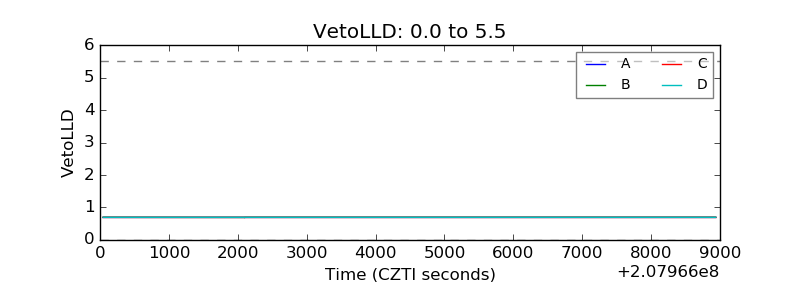 |
| Alpha Counter | 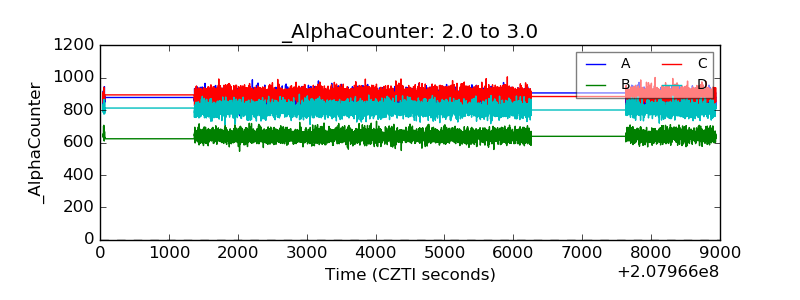 |
| _CPM_Rate | 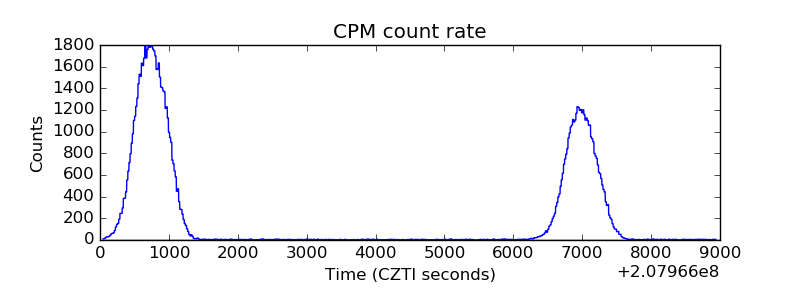 |
| CZT Counter | 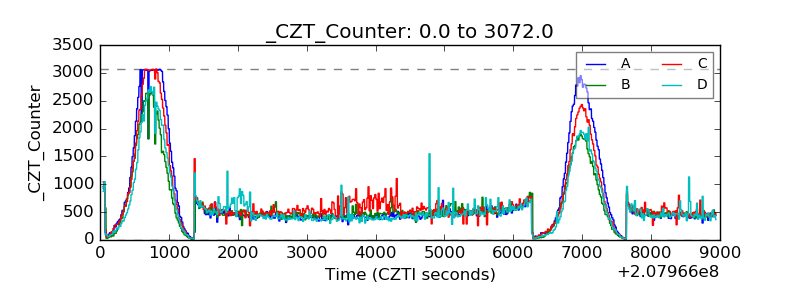 |
| +2.5 Volts monitor |  |
| +5 Volts monitor | 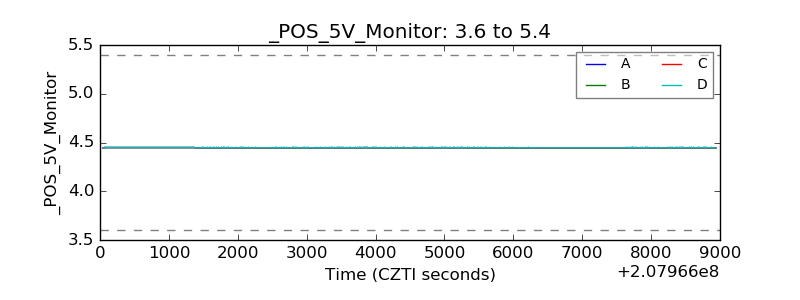 |
| _ROLL_ROT | 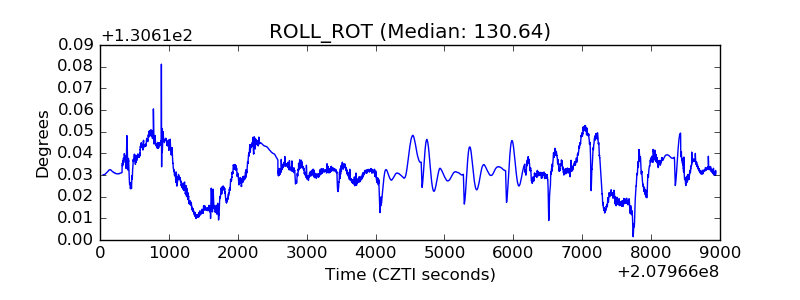 |
| _Roll_DEC | 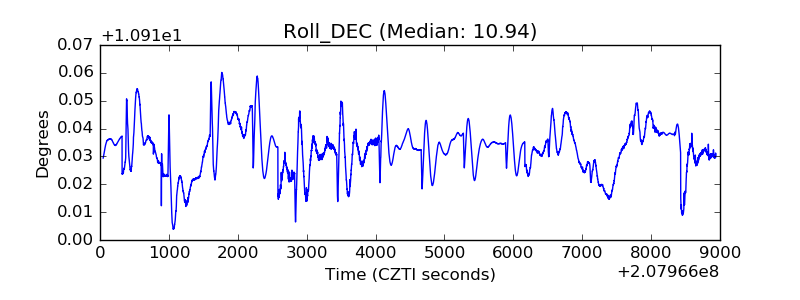 |
| _Roll_RA | 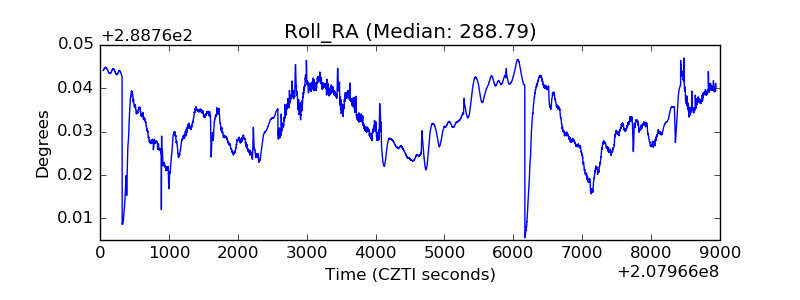 |
| Veto Counter | 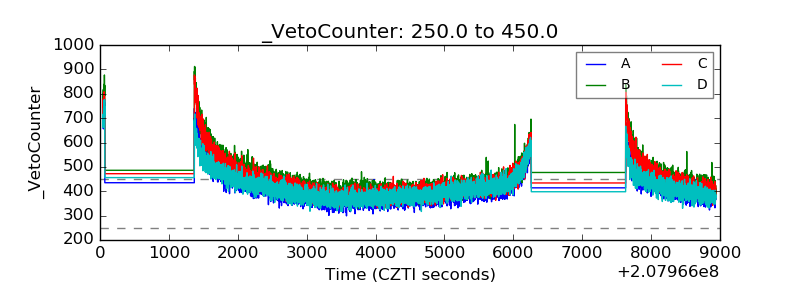 |