| Param | Original file | Final file |
|---|---|---|
| Filename | modeM0/AS1G05_167T02_9000000574_04604cztM0_level2.evt | modeM0/AS1G05_167T02_9000000574_04604cztM0_level2_quad_clean.evt |
| Size (bytes) | 425,782,080 | 67,625,280 |
| Size | 406.1 MB | 64.5 MB |
| Events in quadrant A | 2,949,161 | 400,937 |
| Events in quadrant B | 3,088,963 | 411,706 |
| Events in quadrant C | 3,162,875 | 405,623 |
| Events in quadrant D | 3,258,021 | 382,102 |
| Mode M0 | |||
|---|---|---|---|
| Quadrant | BADHDUFLAG | Total packets | Discarded packets |
| A | 0 | 13161 | 3 |
| B | 0 | 13347 | 2 |
| C | 0 | 13465 | 2 |
| D | 0 | 14265 | 2 |
| Mode SS | |||
|---|---|---|---|
| Quadrant | BADHDUFLAG | Total packets | Discarded packets |
| A | 0 | 130 | 0 |
| B | 0 | 130 | 0 |
| C | 0 | 130 | 0 |
| D | 0 | 130 | 0 |
| Mode M9 | |||
|---|---|---|---|
| Quadrant | BADHDUFLAG | Total packets | Discarded packets |
| A | 0 | 15 | 0 |
| B | 0 | 15 | 0 |
| C | 0 | 15 | 0 |
| D | 0 | 16 | 0 |
| Quadrant | Total seconds | Saturated seconds | Saturation percentage |
|---|---|---|---|
| A | 6408 | 28 | 0.436954% |
| B | 6408 | 41 | 0.639825% |
| C | 6408 | 18 | 0.280899% |
| D | 6408 | 51 | 0.795880% |
Noise dominated data is calculated using 1-second bins in cleaned event files. If a bin has >2000 counts, and if more than 50% of those come from <1% of pixels, then it is considered to be noise-dominated and hence unusable.
| Quadrant | # 1 sec bins | Bins with >0 counts | Bins with >2000 counts | High rate bins dominated by noise | Noise dominated (total time) | Noise dominated (detector-on time) | Marked lightcurve |
|---|---|---|---|---|---|---|---|
| A | 7588 | 6409 | 0 | 0 | 0.00% | 0.00% | 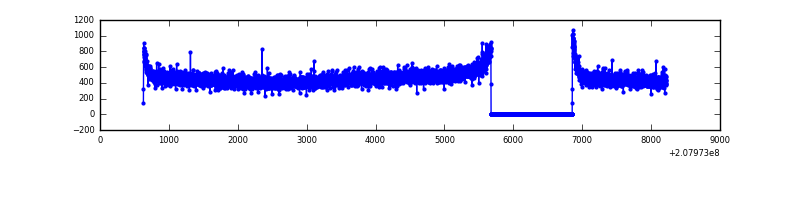 |
| B | 7588 | 6409 | 0 | 0 | 0.00% | 0.00% |  |
| C | 7588 | 6409 | 1 | 1 | 0.01% | 0.02% | 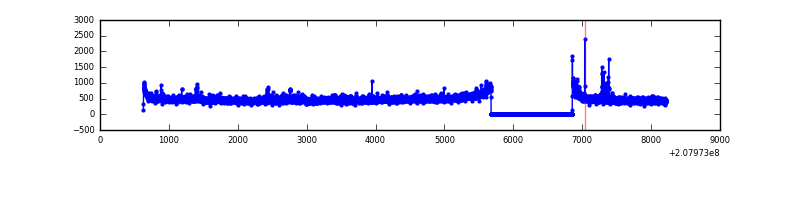 |
| D | 7588 | 6409 | 30 | 30 | 0.40% | 0.47% |  |
Top three noisy pixels from each quadrant. If the there are fewer than three noisy pixels in the level2.evt file, extra rows are filled as -1
| Pixel properties | Quadrant properties | ||||||
|---|---|---|---|---|---|---|---|
| Quadrant | DetID | PixID | Counts | Sigma | Mean | Median | Sigma |
| A | 0 | 226 | 8037 | 46.67 | 762 | 747 | 156.2 |
| A | 3 | 1 | 7819 | 45.27 | 762 | 747 | 156.2 |
| A | 12 | 194 | 7340 | 42.21 | 762 | 747 | 156.2 |
| B | 15 | 204 | 33375 | 217.97 | 775 | 754 | 149.7 |
| B | 14 | 167 | 23872 | 154.47 | 775 | 754 | 149.7 |
| B | 12 | 111 | 13836 | 87.41 | 775 | 754 | 149.7 |
| C | 14 | 48 | 226180 | 1295.82 | 742 | 747 | 174.0 |
| C | 9 | 247 | 31642 | 177.59 | 742 | 747 | 174.0 |
| C | 9 | 54 | 6526 | 33.22 | 742 | 747 | 174.0 |
| D | 13 | 235 | 198394 | 1108.12 | 728 | 707 | 178.4 |
| D | 2 | 136 | 147118 | 820.69 | 728 | 707 | 178.4 |
| D | 2 | 63 | 48719 | 269.13 | 728 | 707 | 178.4 |
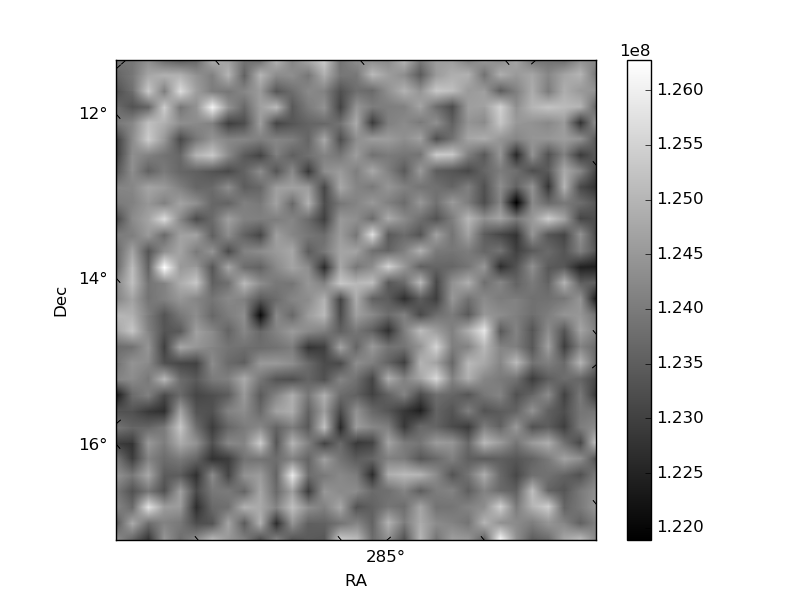
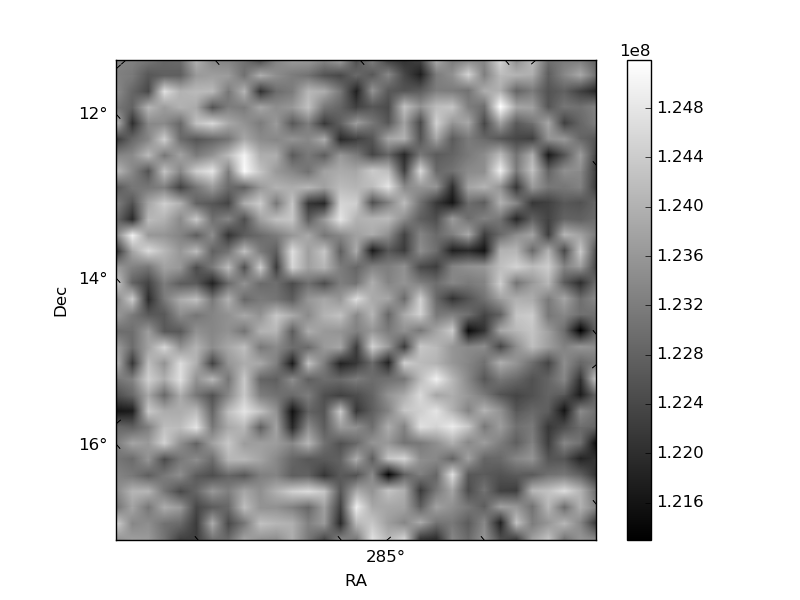
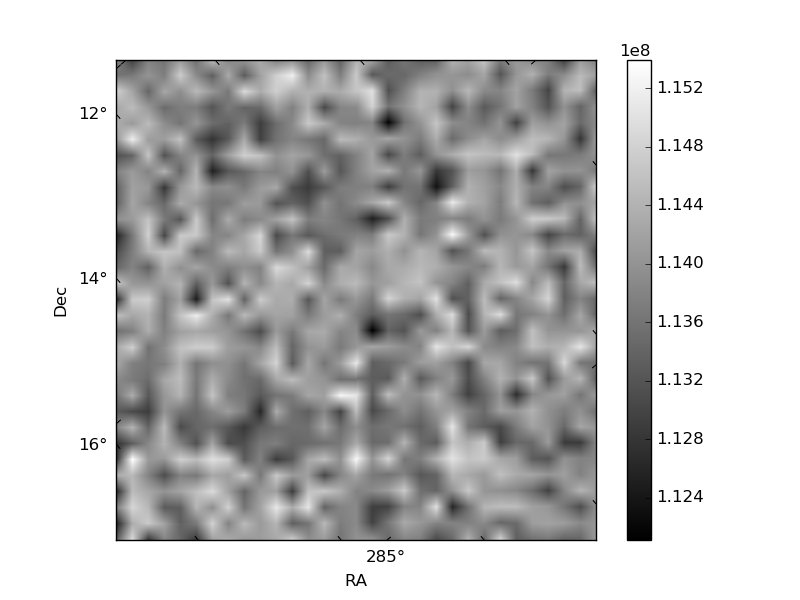
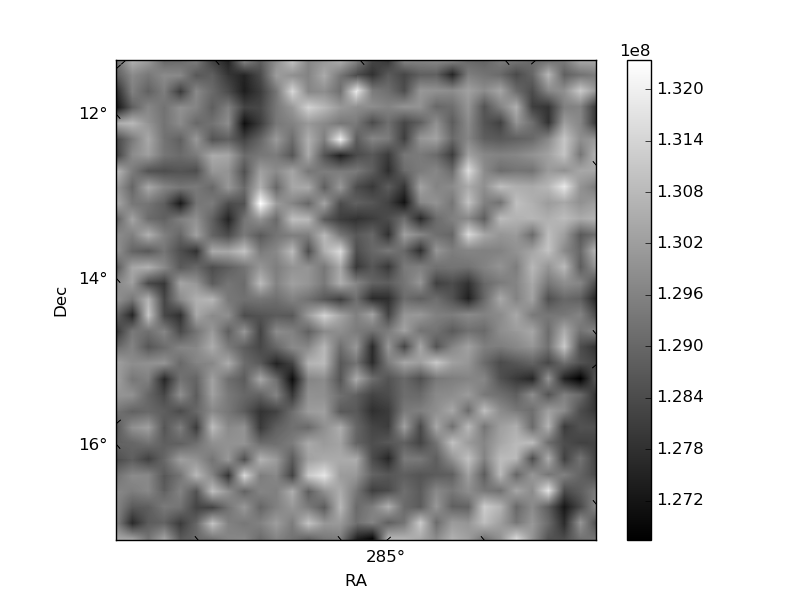
Histogram calculated using DETX and DETY for each event in the final _common_clean file
| Quadrant A | 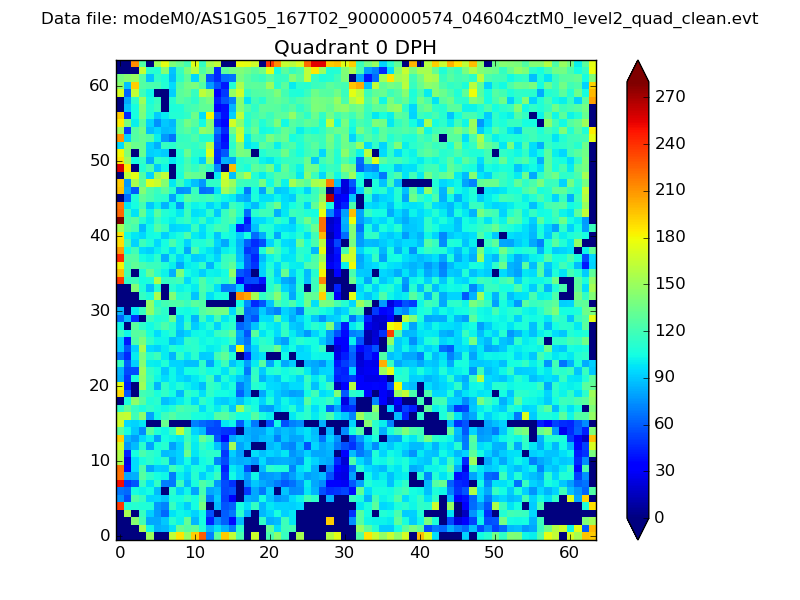 |
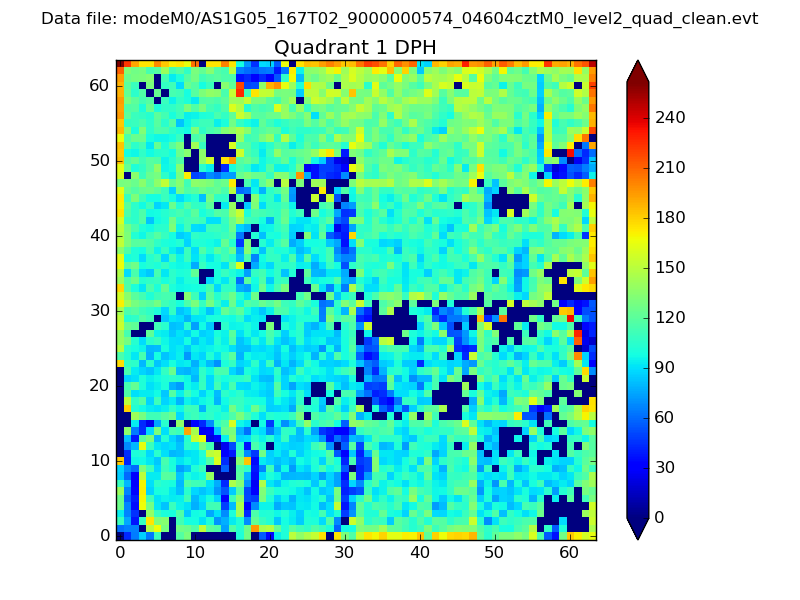 |
Quadrant B |
|---|---|---|---|
| Quadrant D |  |
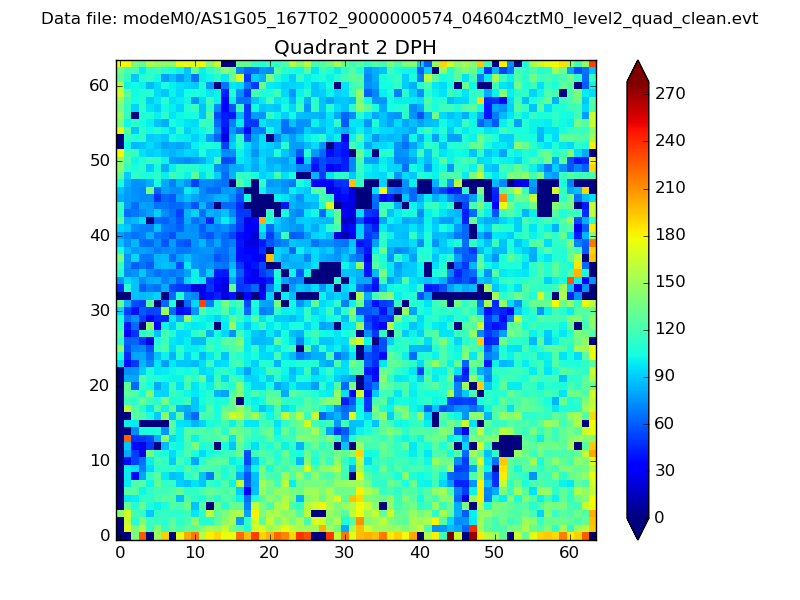 |
Quadrant C |
| Plot type | Count rate plots | Images |
|---|---|---|
| Comparison with Poisson distribution Blue bars denote a histogram of data divided into 1 sec bins. Red curve is a Poisson curve with rate = median count rate of data. |
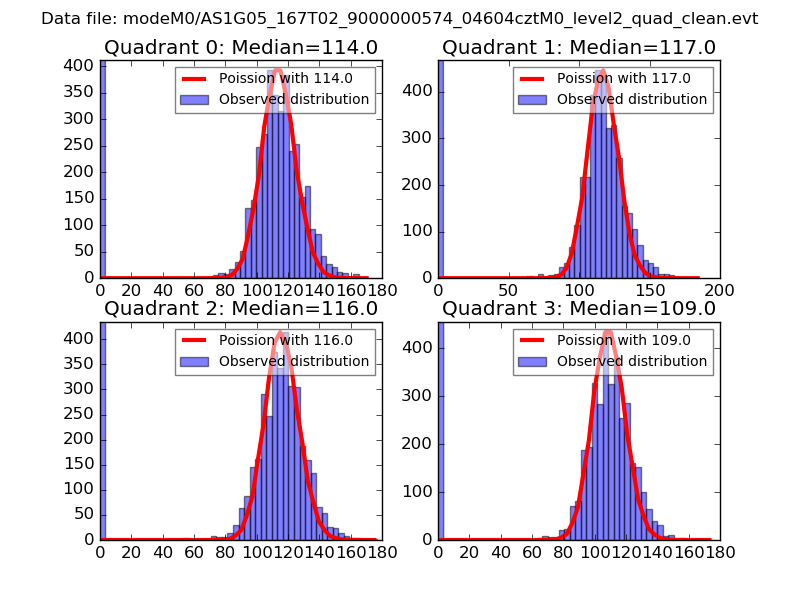 |
 |
| Quadrant-wise count rates Data is divided into 100 sec bins |
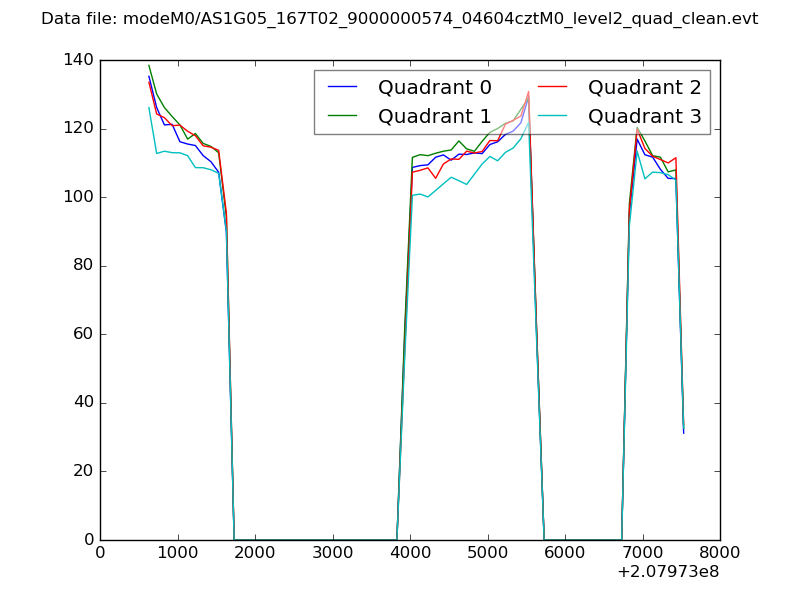 |
|
| Module-wise count rates for Quadrant A Data is divided into 100 sec bins |
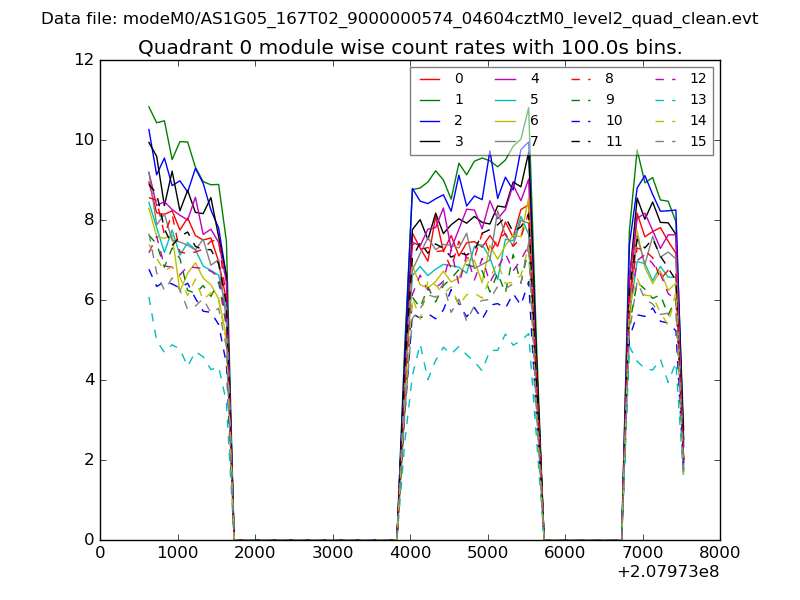 |
 |
| Module-wise count rates for Quadrant B Data is divided into 100 sec bins |
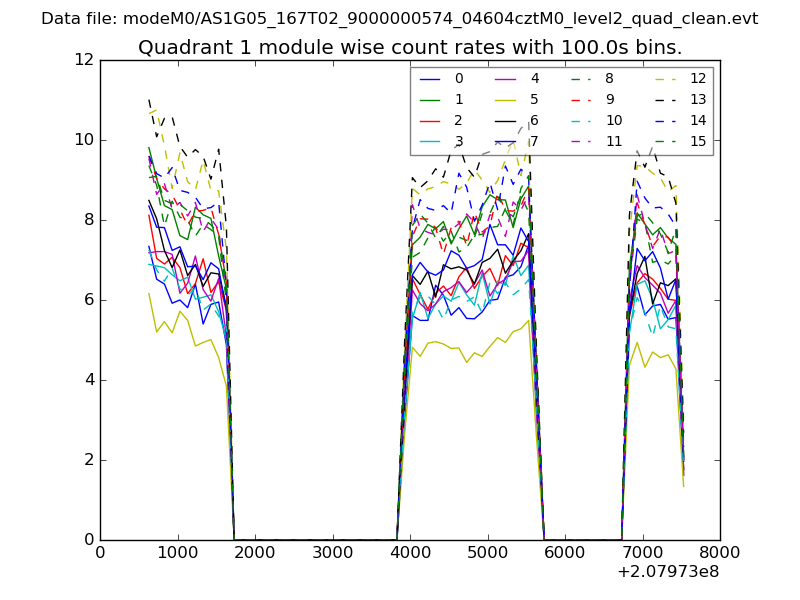 |
 |
| Module-wise count rates for Quadrant C Data is divided into 100 sec bins |
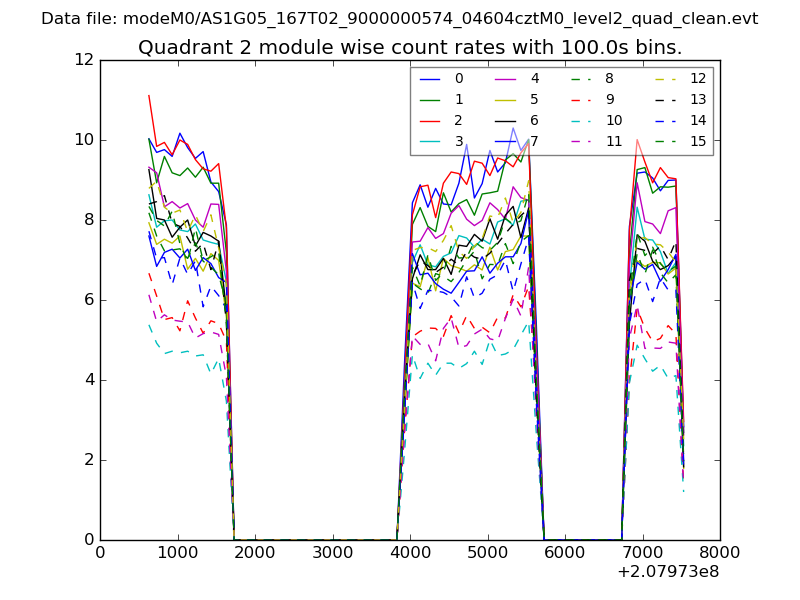 |
 |
| Module-wise count rates for Quadrant D Data is divided into 100 sec bins |
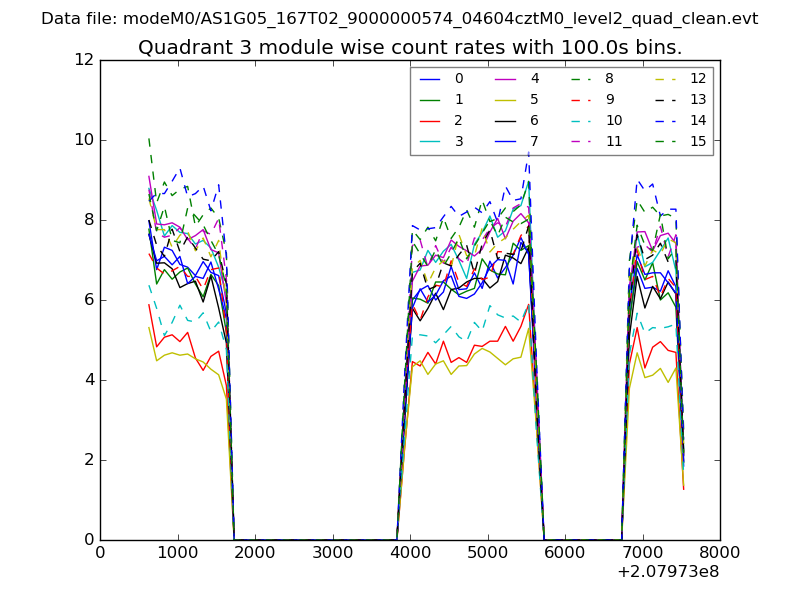 |
 |
| Parameter | Plot |
|---|---|
| CZT HV Monitor | 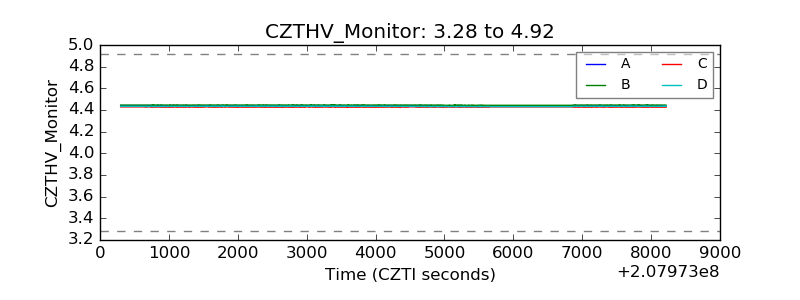 |
| D_VDD | 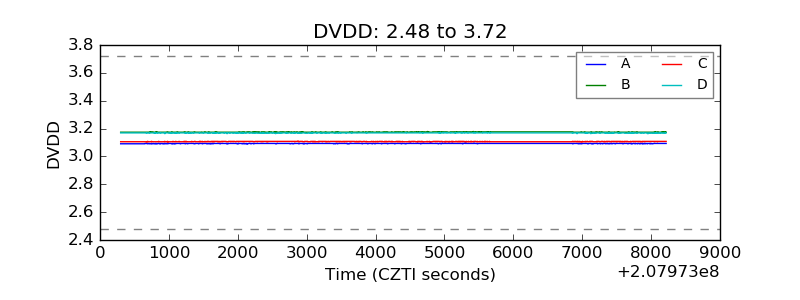 |
| Temperature 1 |  |
| Veto HV Monitor | 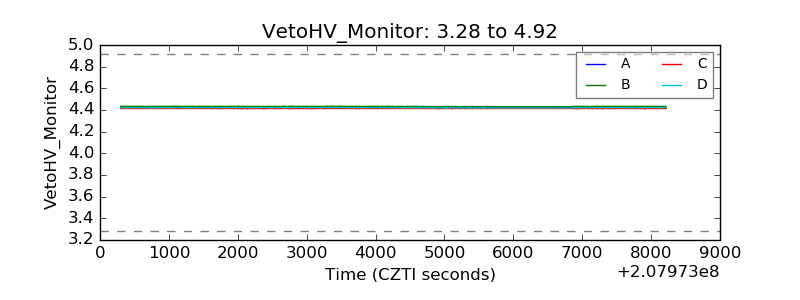 |
| Veto LLD |  |
| Alpha Counter | 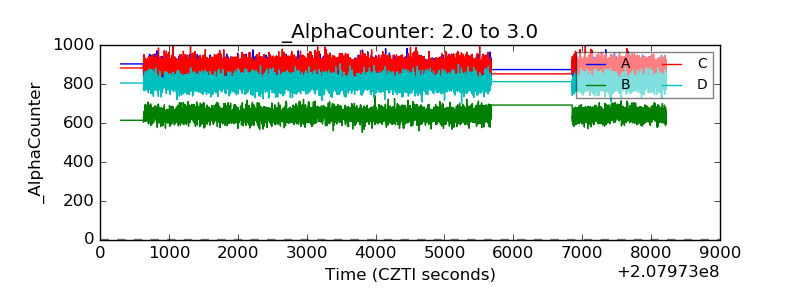 |
| _CPM_Rate | 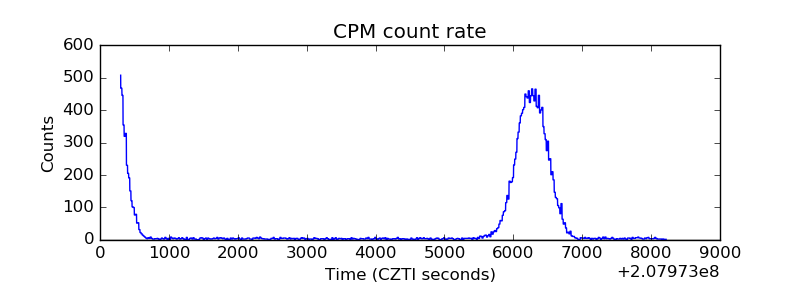 |
| CZT Counter | 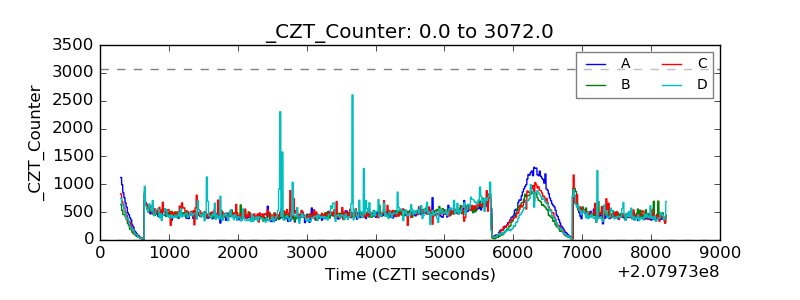 |
| +2.5 Volts monitor |  |
| +5 Volts monitor |  |
| _ROLL_ROT | 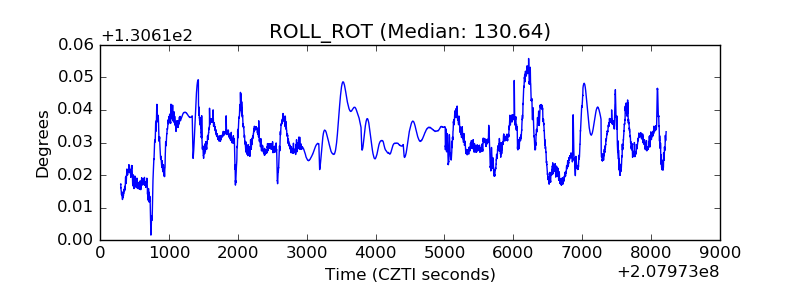 |
| _Roll_DEC | 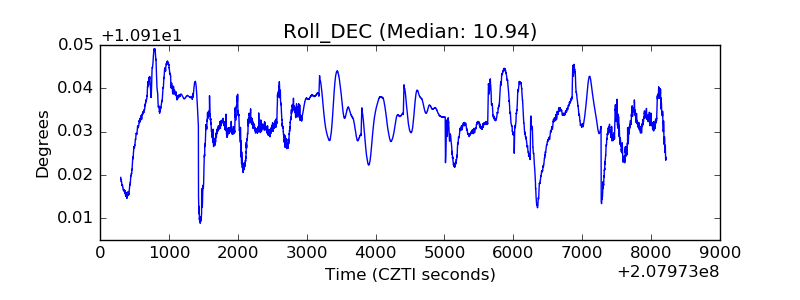 |
| _Roll_RA | 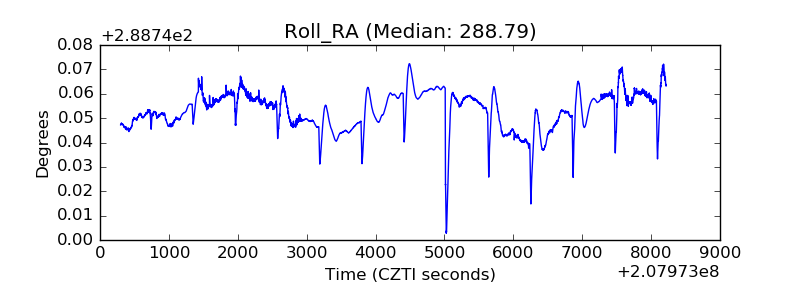 |
| Veto Counter | 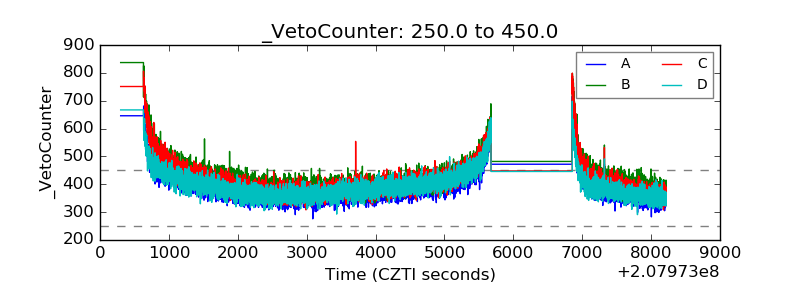 |