| Param | Original file | Final file |
|---|---|---|
| Filename | modeM0/AS1G05_167T02_9000000574_04605cztM0_level2.evt | modeM0/AS1G05_167T02_9000000574_04605cztM0_level2_quad_clean.evt |
| Size (bytes) | 286,718,400 | 43,174,080 |
| Size | 273.4 MB | 41.2 MB |
| Events in quadrant A | 2,022,058 | 247,938 |
| Events in quadrant B | 2,109,807 | 252,221 |
| Events in quadrant C | 2,084,926 | 249,995 |
| Events in quadrant D | 2,156,491 | 237,531 |
| Mode M0 | |||
|---|---|---|---|
| Quadrant | BADHDUFLAG | Total packets | Discarded packets |
| A | 0 | 9194 | 1 |
| B | 0 | 9238 | 1 |
| C | 0 | 9282 | 1 |
| D | 0 | 9731 | 1 |
| Mode SS | |||
|---|---|---|---|
| Quadrant | BADHDUFLAG | Total packets | Discarded packets |
| A | 0 | 90 | 0 |
| B | 0 | 90 | 0 |
| C | 0 | 90 | 0 |
| D | 0 | 90 | 0 |
| Mode M9 | |||
|---|---|---|---|
| Quadrant | BADHDUFLAG | Total packets | Discarded packets |
| A | 0 | 3 | 0 |
| B | 0 | 3 | 0 |
| C | 0 | 3 | 0 |
| D | 0 | 4 | 0 |
| Quadrant | Total seconds | Saturated seconds | Saturation percentage |
|---|---|---|---|
| A | 4541 | 10 | 0.220216% |
| B | 4541 | 19 | 0.418410% |
| C | 4541 | 7 | 0.154151% |
| D | 4541 | 21 | 0.462453% |
Noise dominated data is calculated using 1-second bins in cleaned event files. If a bin has >2000 counts, and if more than 50% of those come from <1% of pixels, then it is considered to be noise-dominated and hence unusable.
| Quadrant | # 1 sec bins | Bins with >0 counts | Bins with >2000 counts | High rate bins dominated by noise | Noise dominated (total time) | Noise dominated (detector-on time) | Marked lightcurve |
|---|---|---|---|---|---|---|---|
| A | 4541 | 4541 | 0 | 0 | 0.00% | 0.00% | 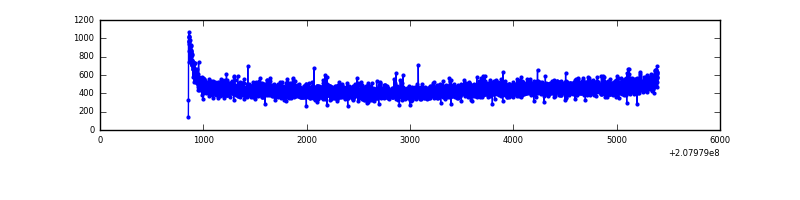 |
| B | 4541 | 4541 | 0 | 0 | 0.00% | 0.00% | 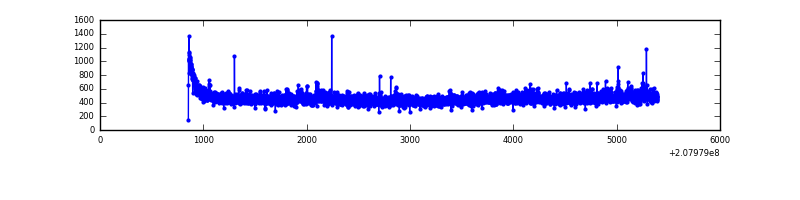 |
| C | 4541 | 4541 | 1 | 1 | 0.02% | 0.02% | 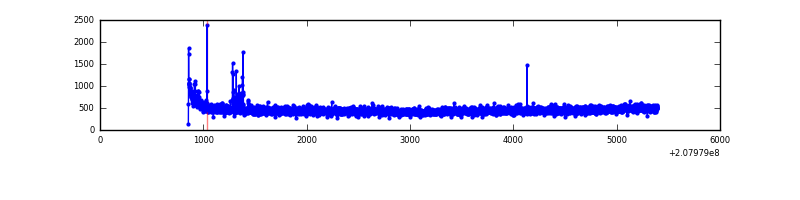 |
| D | 4541 | 4541 | 11 | 11 | 0.24% | 0.24% | 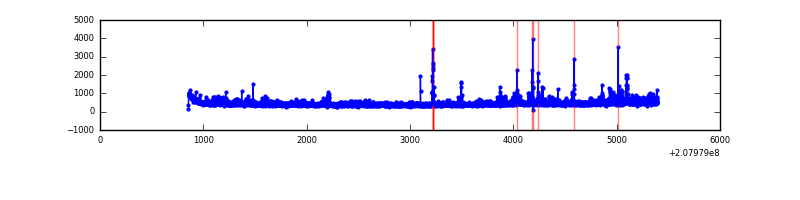 |
Top three noisy pixels from each quadrant. If the there are fewer than three noisy pixels in the level2.evt file, extra rows are filled as -1
| Pixel properties | Quadrant properties | ||||||
|---|---|---|---|---|---|---|---|
| Quadrant | DetID | PixID | Counts | Sigma | Mean | Median | Sigma |
| A | 3 | 1 | 10528 | 93.72 | 519 | 509 | 106.9 |
| A | 15 | 174 | 7709 | 67.35 | 519 | 509 | 106.9 |
| A | 13 | 14 | 5217 | 44.04 | 519 | 509 | 106.9 |
| B | 15 | 204 | 45092 | 438.87 | 526 | 514 | 101.6 |
| B | 0 | 219 | 10657 | 99.86 | 526 | 514 | 101.6 |
| B | 12 | 111 | 9649 | 89.93 | 526 | 514 | 101.6 |
| C | 14 | 48 | 84067 | 698.62 | 503 | 505 | 119.6 |
| C | 9 | 247 | 31717 | 260.95 | 503 | 505 | 119.6 |
| C | 13 | 61 | 4117 | 30.2 | 503 | 505 | 119.6 |
| D | 13 | 235 | 174875 | 1429.48 | 498 | 483 | 122.0 |
| D | 2 | 136 | 38594 | 312.39 | 498 | 483 | 122.0 |
| D | 13 | 239 | 22804 | 182.96 | 498 | 483 | 122.0 |
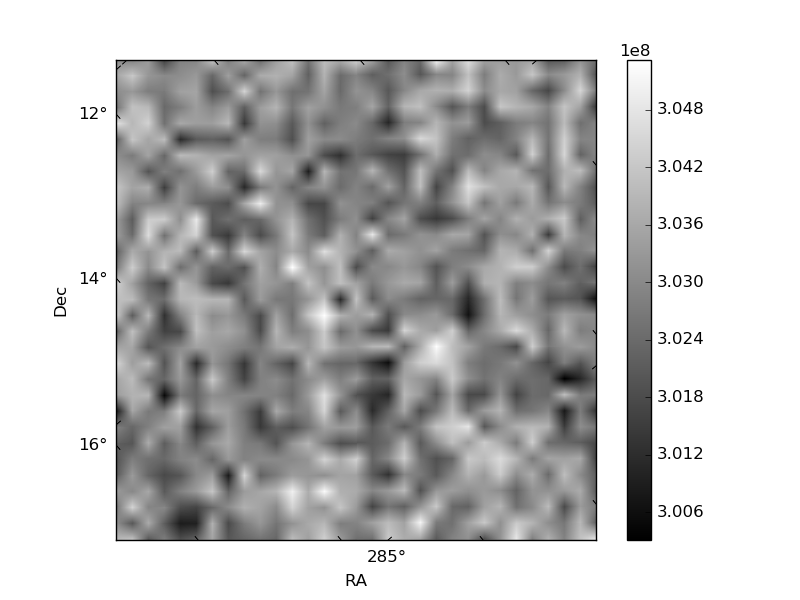
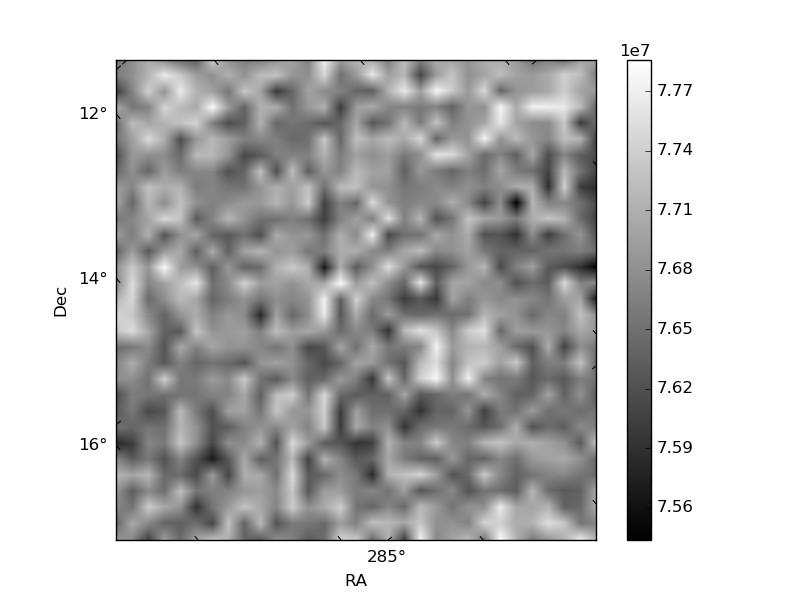
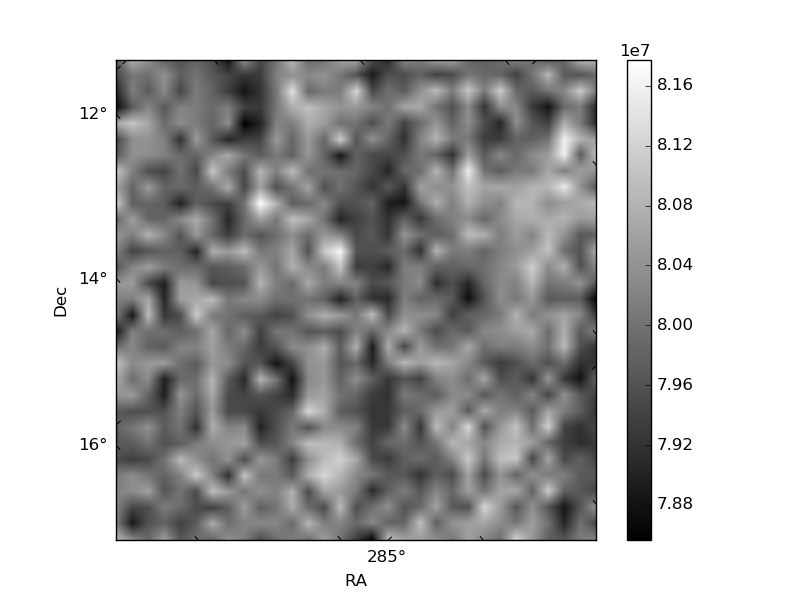
Histogram calculated using DETX and DETY for each event in the final _common_clean file
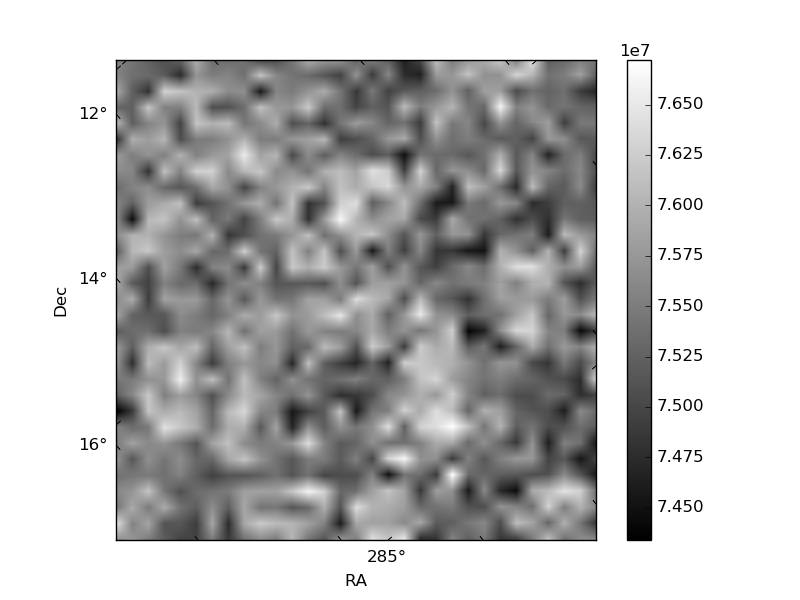
| Quadrant A | 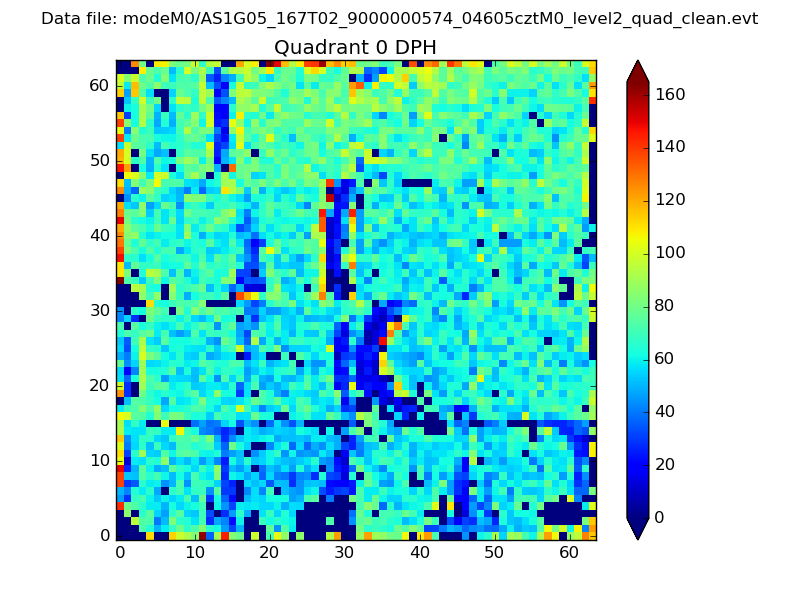 |
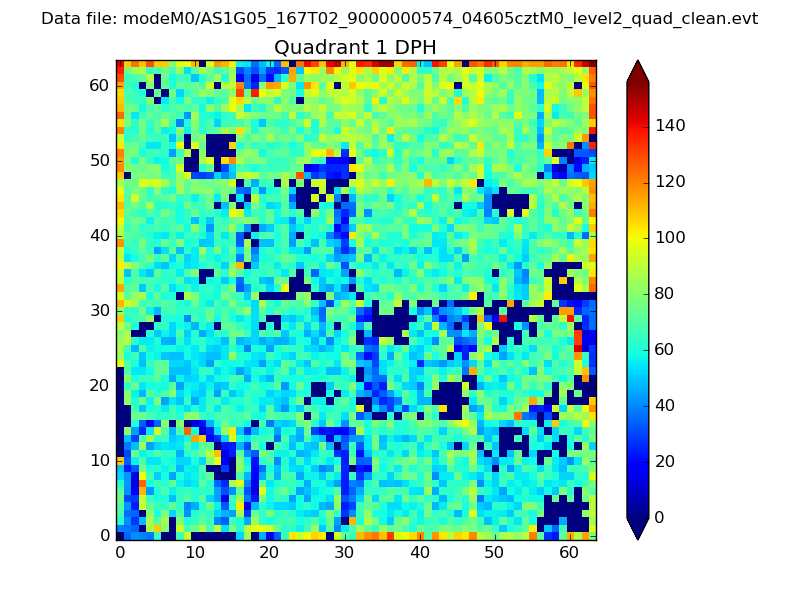 |
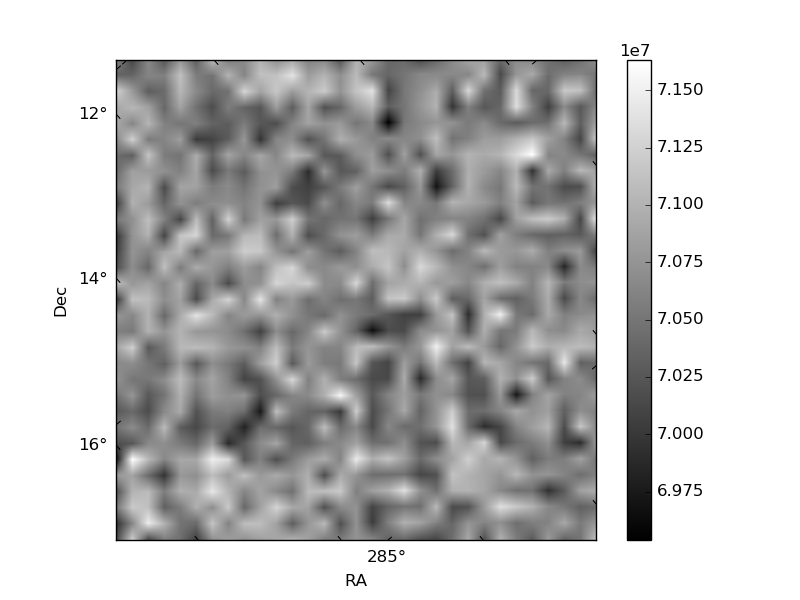
Quadrant B |
|---|---|---|---|
| Quadrant D | 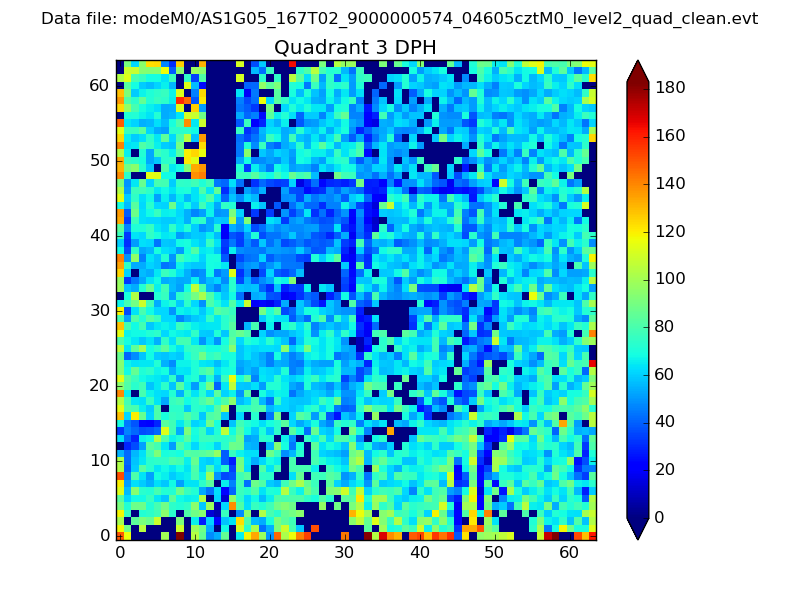 |
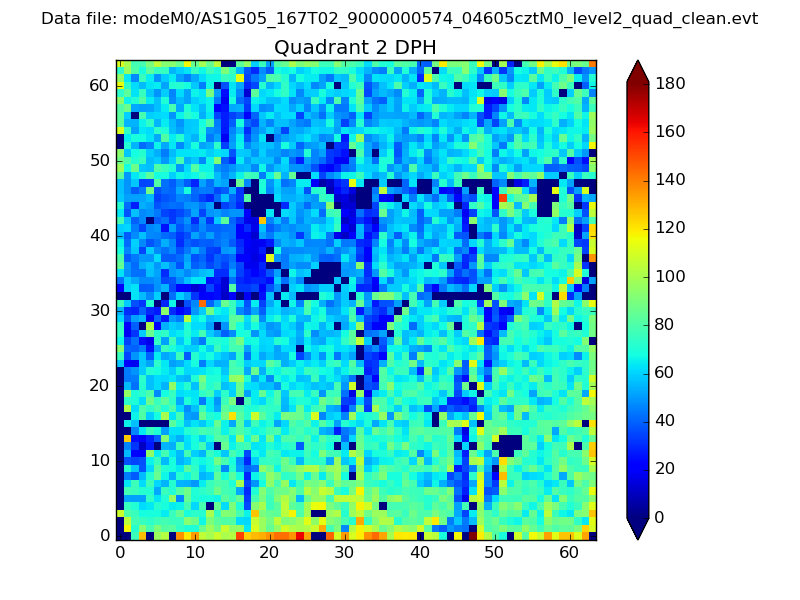 |
Quadrant C |
| Plot type | Count rate plots | Images |
|---|---|---|
| Comparison with Poisson distribution Blue bars denote a histogram of data divided into 1 sec bins. Red curve is a Poisson curve with rate = median count rate of data. |
 |
 |
| Quadrant-wise count rates Data is divided into 100 sec bins |
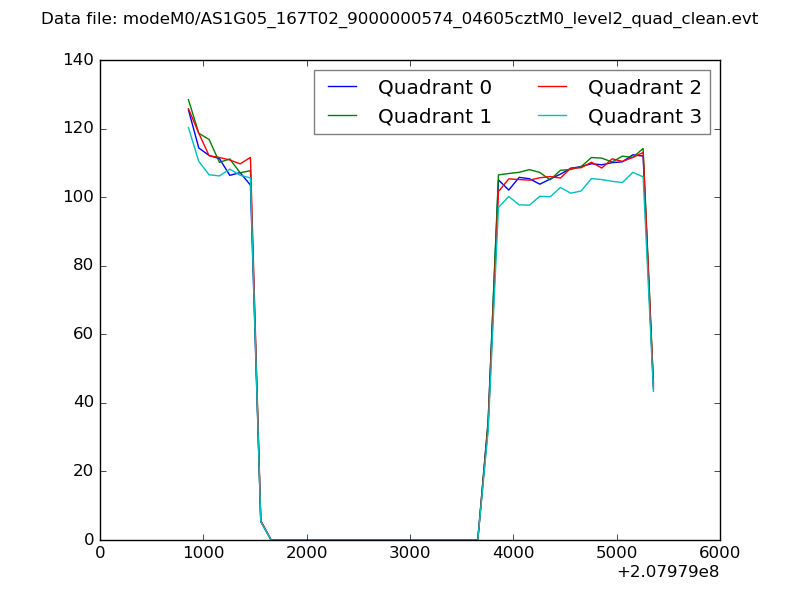 |
|
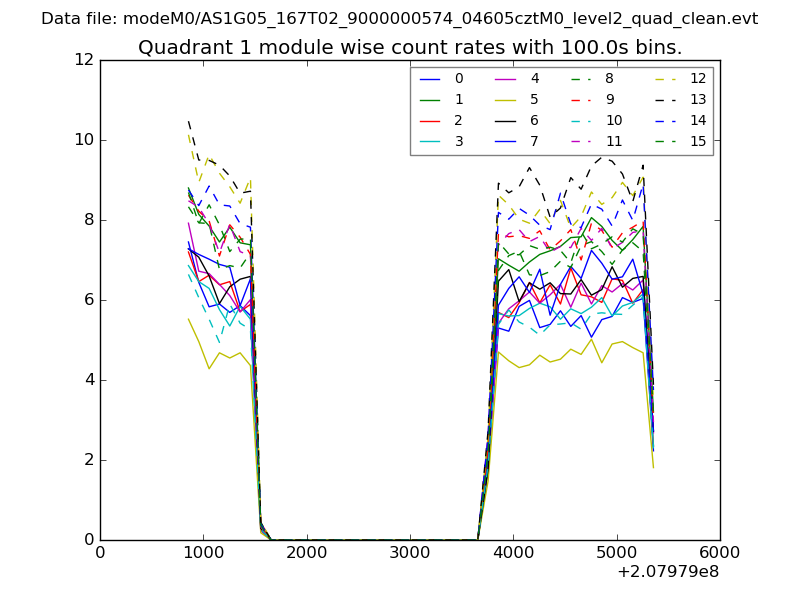
| Module-wise count rates for Quadrant A Data is divided into 100 sec bins |
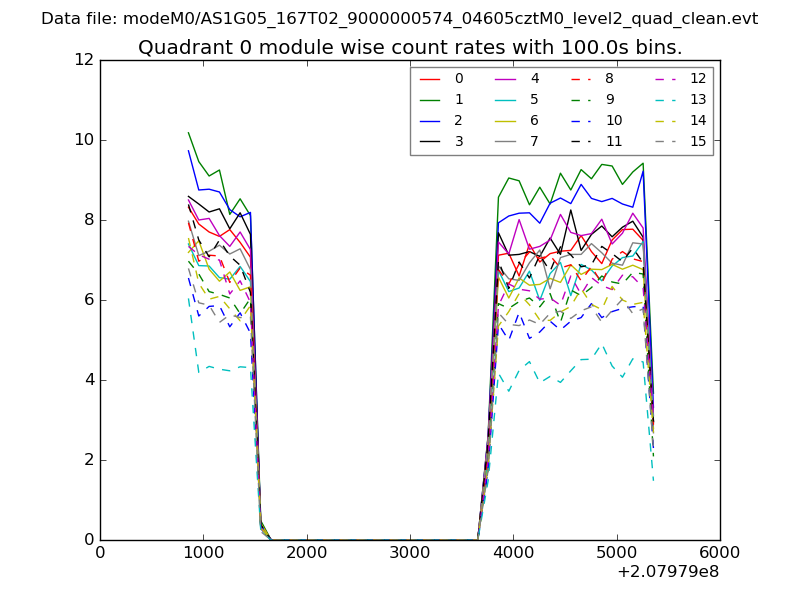 |
 |
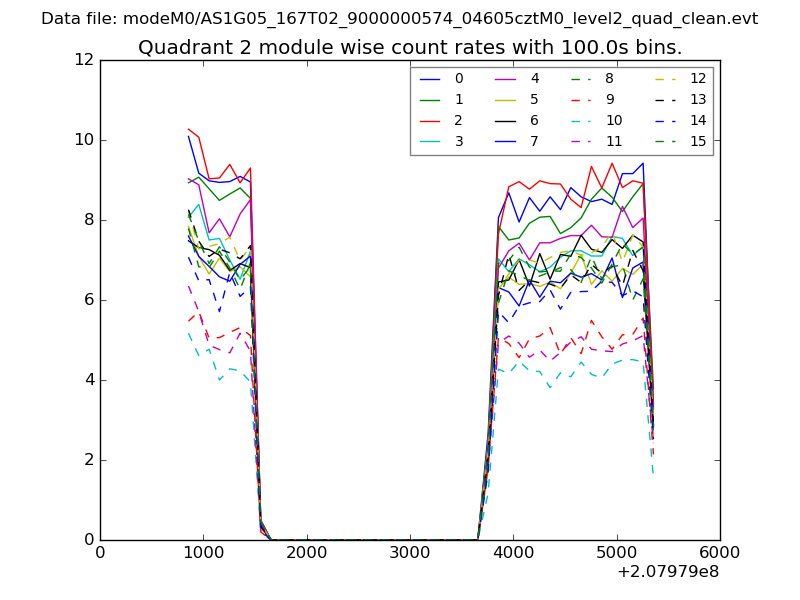
| Module-wise count rates for Quadrant B Data is divided into 100 sec bins |
 |
 |
| Module-wise count rates for Quadrant C Data is divided into 100 sec bins |
 |
 |
| Module-wise count rates for Quadrant D Data is divided into 100 sec bins |
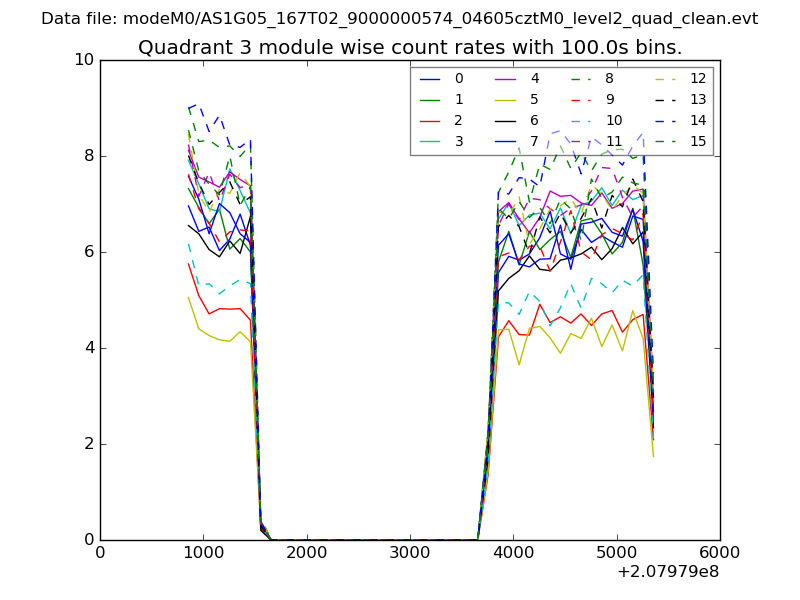 |
 |
| Parameter | Plot |
|---|---|
| CZT HV Monitor | 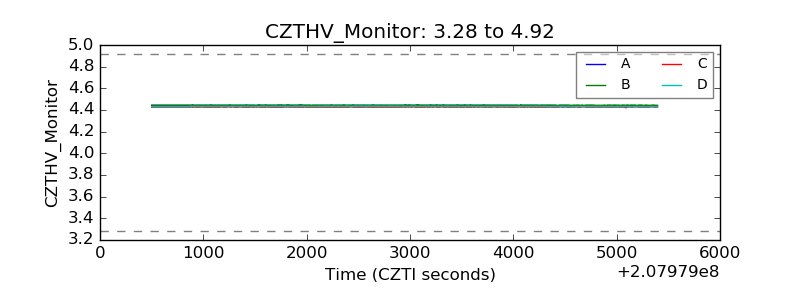 |
| D_VDD | 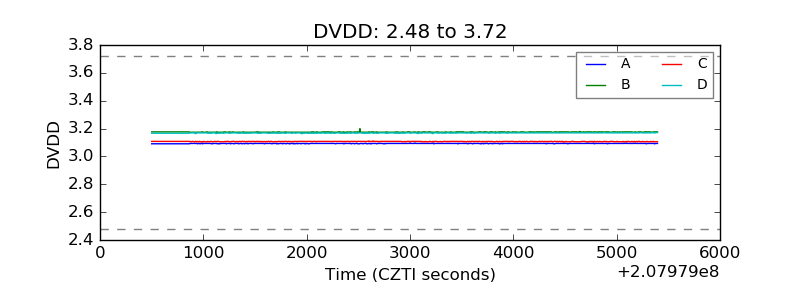 |
| Temperature 1 | 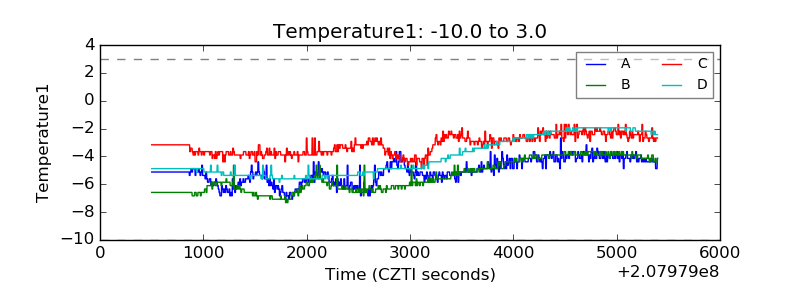 |
| Veto HV Monitor | 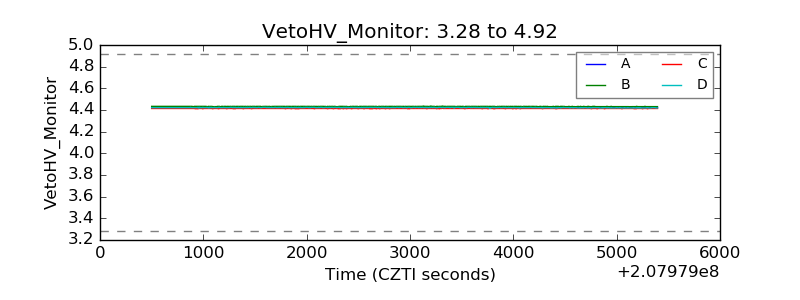 |
| Veto LLD | 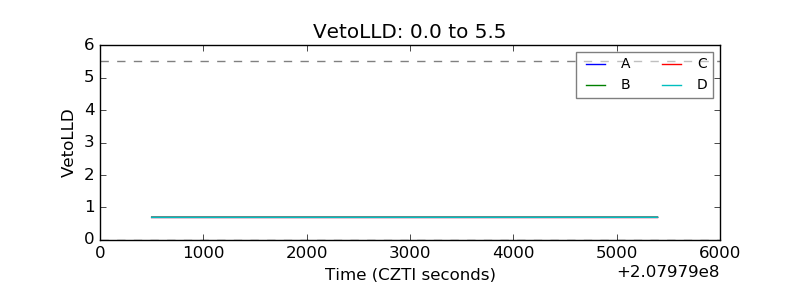 |
| Alpha Counter | 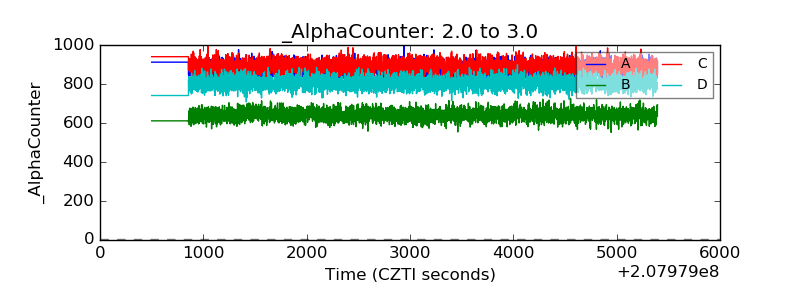 |
| _CPM_Rate | 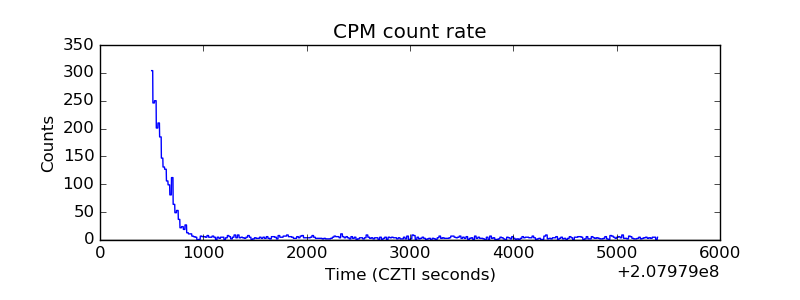 |
| CZT Counter | 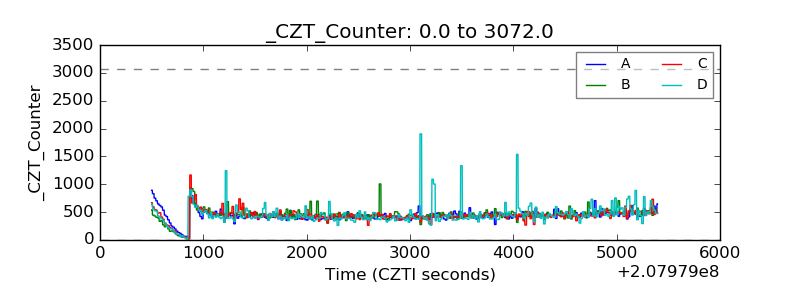 |
| +2.5 Volts monitor |  |
| +5 Volts monitor |  |
| _ROLL_ROT | 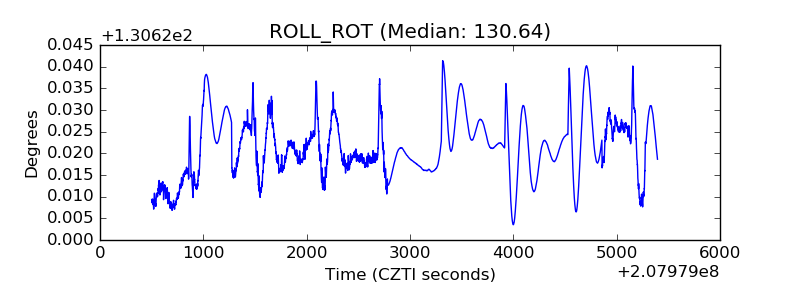 |
| _Roll_DEC | 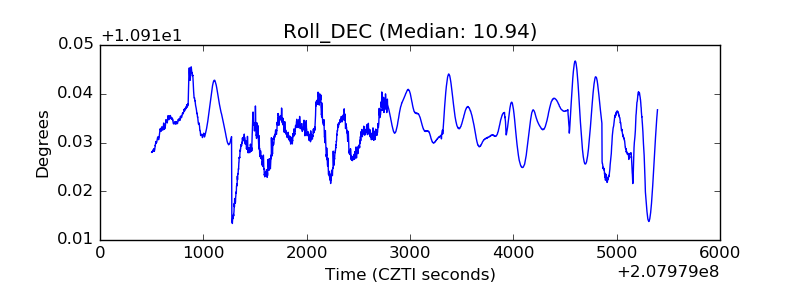 |
| _Roll_RA | 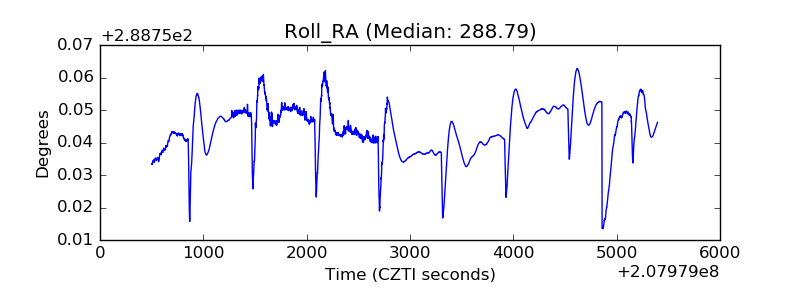 |
| Veto Counter | 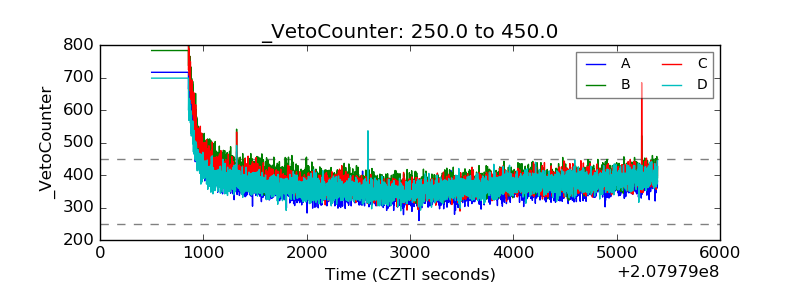 |