| Param | Original file | Final file |
|---|---|---|
| Filename | modeM0/AS1G05_191T01_9000000572cztM0_level2.fits | modeM0/AS1G05_191T01_9000000572cztM0_level2_quad_clean.evt |
| Size (bytes) | 494,832,960 | 577,756,800 |
| Size | 471.9 MB | 551.0 MB |
| Events in quadrant A | 3,018,926 | 3,758,421 |
| Events in quadrant B | 2,911,970 | 3,733,458 |
| Events in quadrant C | 2,982,912 | 3,554,804 |
| Events in quadrant D | 2,303,876 | 2,688,005 |
| Mode M9 | |||
|---|---|---|---|
| Quadrant | BADHDUFLAG | Total packets | Discarded packets |
| A | 0 | 69 | 0 |
| B | 0 | 69 | 0 |
| C | 0 | 69 | 0 |
| D | 0 | 69 | 0 |
| Mode M0 | |||
|---|---|---|---|
| Quadrant | BADHDUFLAG | Total packets | Discarded packets |
| A | 0 | 115571 | 0 |
| B | 0 | 119698 | 0 |
| C | 0 | 115170 | 0 |
| D | 0 | 176666 | 0 |
| Mode SS | |||
|---|---|---|---|
| Quadrant | BADHDUFLAG | Total packets | Discarded packets |
| A | 0 | 1112 | 0 |
| B | 0 | 1114 | 0 |
| C | 0 | 1114 | 0 |
| D | 0 | 1114 | 0 |
| Quadrant | Total seconds | Saturated seconds | Saturation percentage |
|---|---|---|---|
| A | 54879 | 953 | 1.736548% |
| B | 54877 | 1139 | 2.075551% |
| C | 54902 | 620 | 1.129285% |
| D | 54806 | 8621 | 15.730030% |
Noise dominated data is calculated using 1-second bins in cleaned event files. If a bin has >2000 counts, and if more than 50% of those come from <1% of pixels, then it is considered to be noise-dominated and hence unusable.
| Quadrant | # 1 sec bins | Bins with >0 counts | Bins with >2000 counts | High rate bins dominated by noise | Noise dominated (total time) | Noise dominated (detector-on time) | Marked lightcurve |
|---|---|---|---|---|---|---|---|
| A | 61753 | 54973 | 0 | 0 | 0.00% | 0.00% |  |
| B | 61753 | 54965 | 0 | 0 | 0.00% | 0.00% |  |
| C | 61753 | 54978 | 0 | 0 | 0.00% | 0.00% |  |
| D | 61753 | 54225 | 0 | 0 | 0.00% | 0.00% |  |
Top three noisy pixels from each quadrant. If the there are fewer than three noisy pixels in the level2.evt file, extra rows are filled as -1
| Pixel properties | Quadrant properties | ||||||
|---|---|---|---|---|---|---|---|
| Quadrant | DetID | PixID | Counts | Sigma | Mean | Median | Sigma |
| A | 0 | 29 | 3058 | 11.6 | 781 | 729 | 200.8 |
| A | 14 | 188 | 2968 | 11.15 | 781 | 729 | 200.8 |
| A | 7 | 110 | 2711 | 9.87 | 781 | 729 | 200.8 |
| B | 2 | 9 | 2480 | 11.19 | 767 | 728 | 156.6 |
| B | 12 | 226 | 2171 | 9.22 | 767 | 728 | 156.6 |
| B | 5 | 128 | 2002 | 8.14 | 767 | 728 | 156.6 |
| C | 1 | 81 | 2349 | 7.56 | 786 | 726 | 214.6 |
| C | 1 | 80 | 2327 | 7.46 | 786 | 726 | 214.6 |
| C | 12 | 250 | 2262 | 7.16 | 786 | 726 | 214.6 |
| D | 11 | 82 | 1975 | 7.7 | 656 | 595 | 179.3 |
| D | 1 | 19 | 1743 | 6.4 | 656 | 595 | 179.3 |
| D | 3 | 14 | 1721 | 6.28 | 656 | 595 | 179.3 |
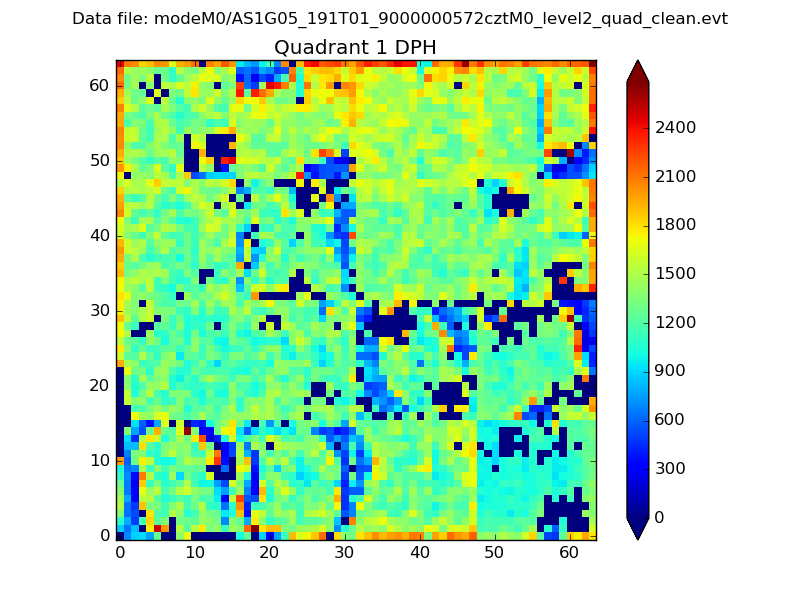
Histogram calculated using DETX and DETY for each event in the final _common_clean file
| Quadrant A |  |
 |
Quadrant B |
|---|---|---|---|
| Quadrant D |  |
 |
Quadrant C |
| Plot type | Count rate plots | Images |
|---|---|---|
| Comparison with Poisson distribution Blue bars denote a histogram of data divided into 1 sec bins. Red curve is a Poisson curve with rate = median count rate of data. |
 |
 |
| Quadrant-wise count rates Data is divided into 100 sec bins |
 |
|
| Module-wise count rates for Quadrant A Data is divided into 100 sec bins |
 |
 |
| Module-wise count rates for Quadrant B Data is divided into 100 sec bins |
 |
 |
| Module-wise count rates for Quadrant C Data is divided into 100 sec bins |
 |
 |
| Module-wise count rates for Quadrant D Data is divided into 100 sec bins |
 |
 |
| Parameter | Plot |
|---|---|
| CZT HV Monitor |  |
| D_VDD | 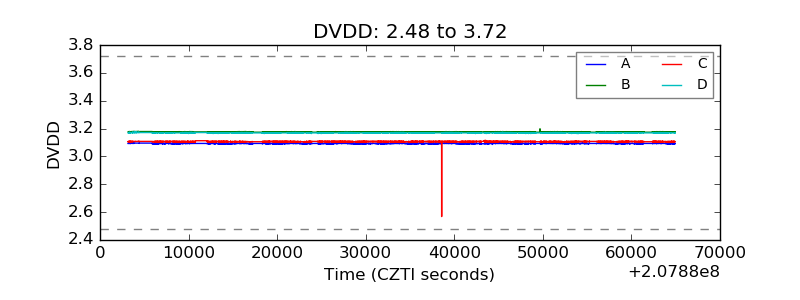 |
| Temperature 1 |  |
| Veto HV Monitor |  |
| Veto LLD |  |
| Alpha Counter |  |
| _CPM_Rate |  |
| CZT Counter |  |
| +2.5 Volts monitor |  |
| +5 Volts monitor |  |
| _ROLL_ROT |  |
| _Roll_DEC |  |
| _Roll_RA |  |
| Veto Counter |  |