| Param | Original file | Final file |
|---|---|---|
| Filename | modeM0/AS1G05_191T01_9000000572_04588cztM0_level2.evt | modeM0/AS1G05_191T01_9000000572_04588cztM0_level2_quad_clean.evt |
| Size (bytes) | 199,866,240 | 46,114,560 |
| Size | 190.6 MB | 44.0 MB |
| Events in quadrant A | 1,347,053 | 309,407 |
| Events in quadrant B | 1,613,761 | 311,958 |
| Events in quadrant C | 1,364,818 | 302,541 |
| Events in quadrant D | 1,546,749 | 283,971 |
| Mode M9 | |||
|---|---|---|---|
| Quadrant | BADHDUFLAG | Total packets | Discarded packets |
| A | 0 | 14 | 0 |
| B | 0 | 14 | 0 |
| C | 0 | 14 | 0 |
| D | 0 | 14 | 0 |
| Mode M0 | |||
|---|---|---|---|
| Quadrant | BADHDUFLAG | Total packets | Discarded packets |
| A | 0 | 5567 | 2 |
| B | 0 | 6393 | 1 |
| C | 0 | 5665 | 1 |
| D | 0 | 6258 | 1 |
| Mode SS | |||
|---|---|---|---|
| Quadrant | BADHDUFLAG | Total packets | Discarded packets |
| A | 0 | 54 | 0 |
| B | 0 | 54 | 0 |
| C | 0 | 54 | 0 |
| D | 0 | 54 | 0 |
| Quadrant | Total seconds | Saturated seconds | Saturation percentage |
|---|---|---|---|
| A | 2630 | 10 | 0.380228% |
| B | 2630 | 77 | 2.927757% |
| C | 2630 | 9 | 0.342205% |
| D | 2630 | 31 | 1.178707% |
Noise dominated data is calculated using 1-second bins in cleaned event files. If a bin has >2000 counts, and if more than 50% of those come from <1% of pixels, then it is considered to be noise-dominated and hence unusable.
| Quadrant | # 1 sec bins | Bins with >0 counts | Bins with >2000 counts | High rate bins dominated by noise | Noise dominated (total time) | Noise dominated (detector-on time) | Marked lightcurve |
|---|---|---|---|---|---|---|---|
| A | 4010 | 2631 | 0 | 0 | 0.00% | 0.00% | 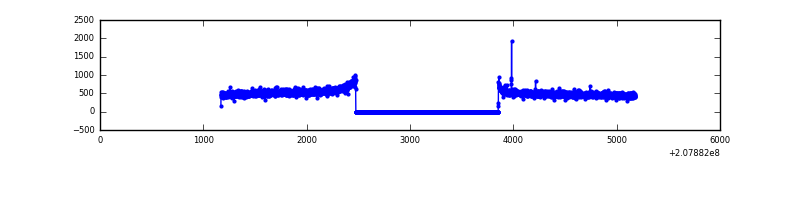 |
| B | 4010 | 2631 | 35 | 35 | 0.87% | 1.33% | 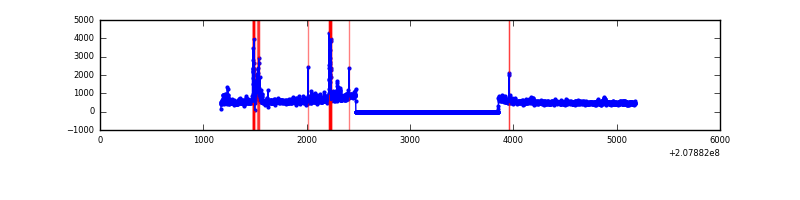 |
| C | 4010 | 2631 | 0 | 0 | 0.00% | 0.00% | 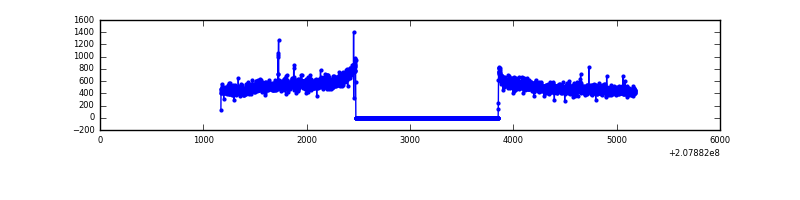 |
| D | 4010 | 2631 | 22 | 22 | 0.55% | 0.84% | 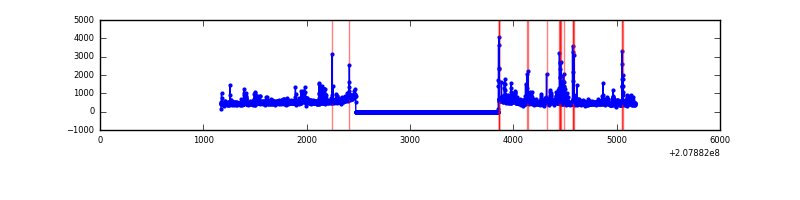 |
Top three noisy pixels from each quadrant. If the there are fewer than three noisy pixels in the level2.evt file, extra rows are filled as -1
| Pixel properties | Quadrant properties | ||||||
|---|---|---|---|---|---|---|---|
| Quadrant | DetID | PixID | Counts | Sigma | Mean | Median | Sigma |
| A | 8 | 15 | 4547 | 58.97 | 348 | 341 | 71.3 |
| A | 12 | 194 | 3604 | 45.75 | 348 | 341 | 71.3 |
| A | 0 | 226 | 3467 | 43.82 | 348 | 341 | 71.3 |
| B | 14 | 167 | 81622 | 1189.68 | 350 | 345 | 68.3 |
| B | 5 | 70 | 63638 | 926.45 | 350 | 345 | 68.3 |
| B | 15 | 204 | 49271 | 716.15 | 350 | 345 | 68.3 |
| C | 14 | 48 | 39790 | 489.36 | 337 | 340 | 80.6 |
| C | 9 | 247 | 5300 | 61.53 | 337 | 340 | 80.6 |
| C | 13 | 61 | 2815 | 30.7 | 337 | 340 | 80.6 |
| D | 13 | 235 | 144395 | 1740.21 | 332 | 321 | 82.8 |
| D | 12 | 110 | 67112 | 806.74 | 332 | 321 | 82.8 |
| D | 2 | 136 | 26194 | 312.51 | 332 | 321 | 82.8 |
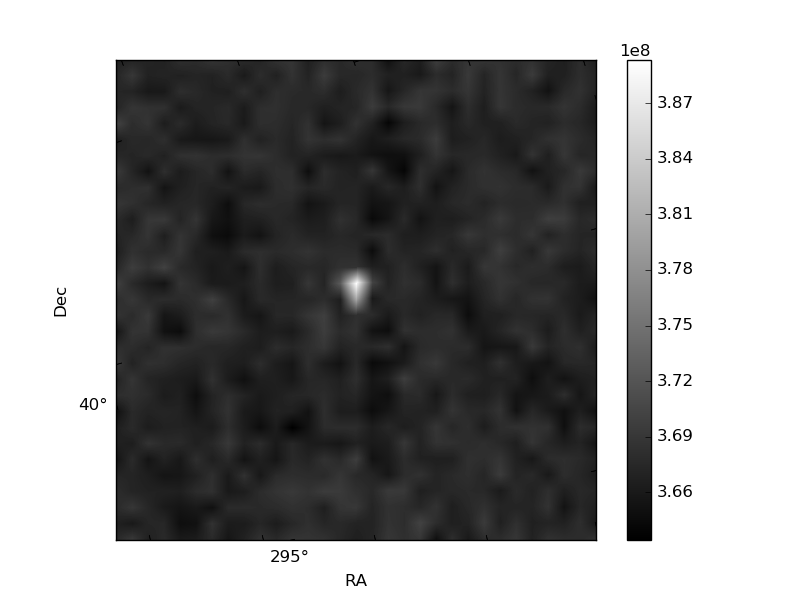
Histogram calculated using DETX and DETY for each event in the final _common_clean file
| Quadrant A | 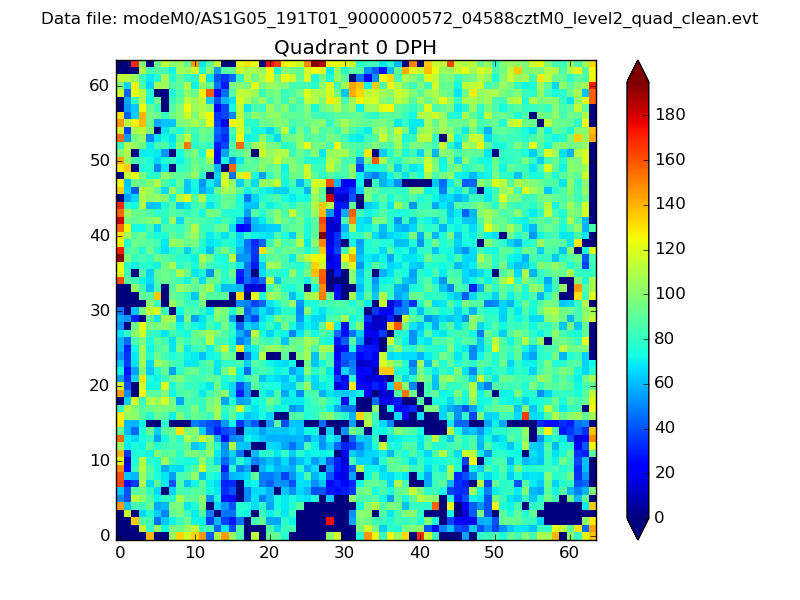 |
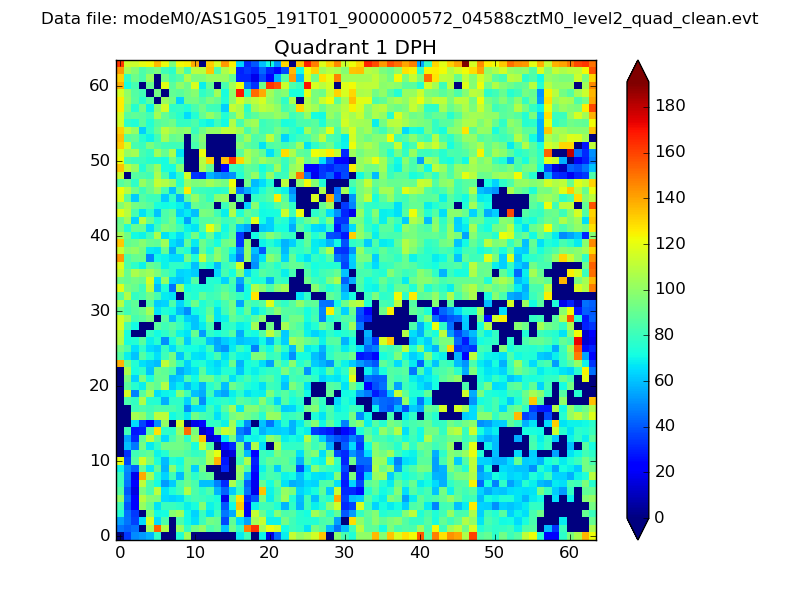 |
Quadrant B |
|---|---|---|---|
| Quadrant D | 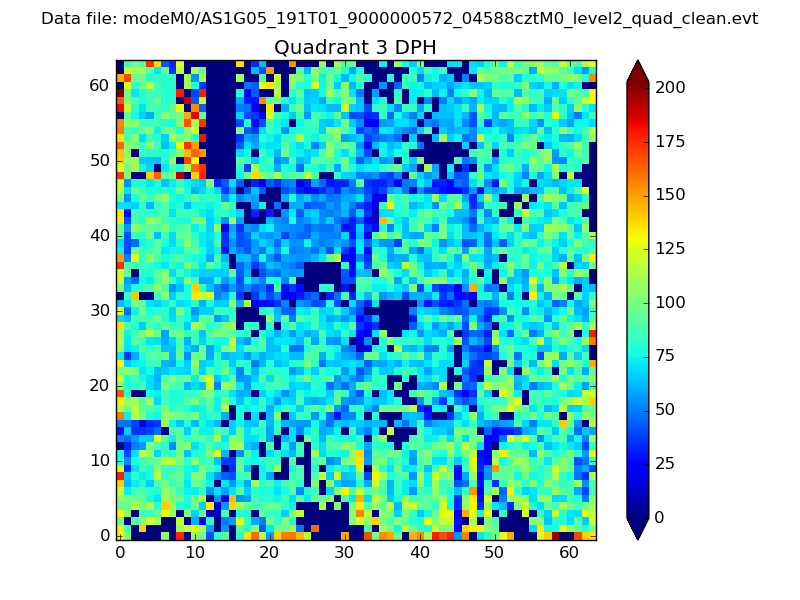 |
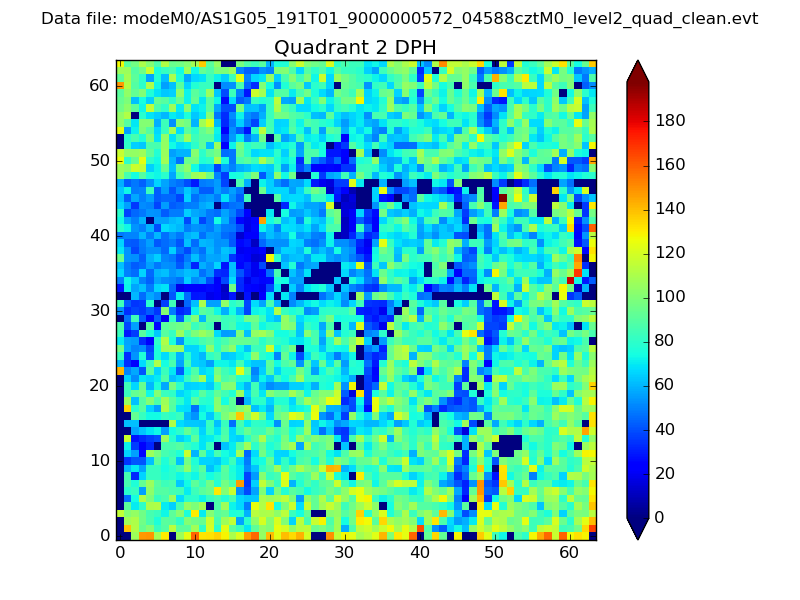 |
Quadrant C |
| Plot type | Count rate plots | Images |
|---|---|---|
| Comparison with Poisson distribution Blue bars denote a histogram of data divided into 1 sec bins. Red curve is a Poisson curve with rate = median count rate of data. |
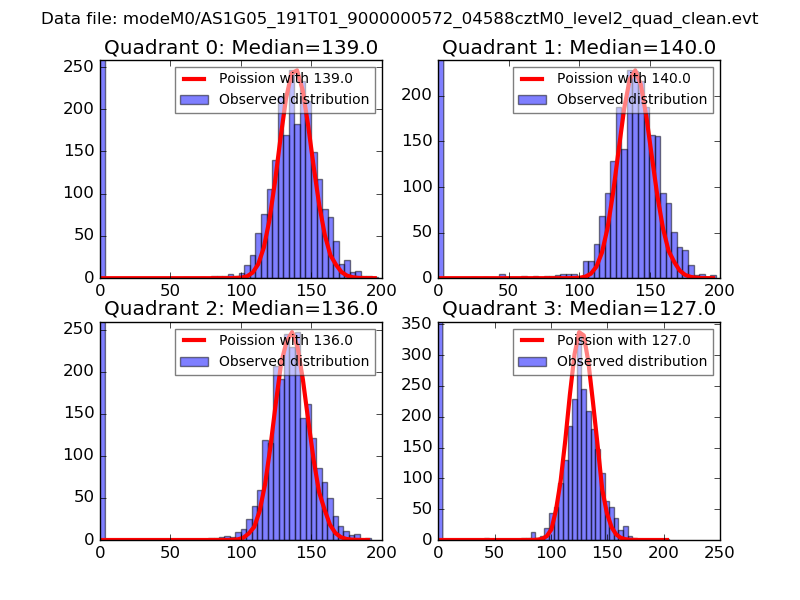 |
 |
| Quadrant-wise count rates Data is divided into 100 sec bins |
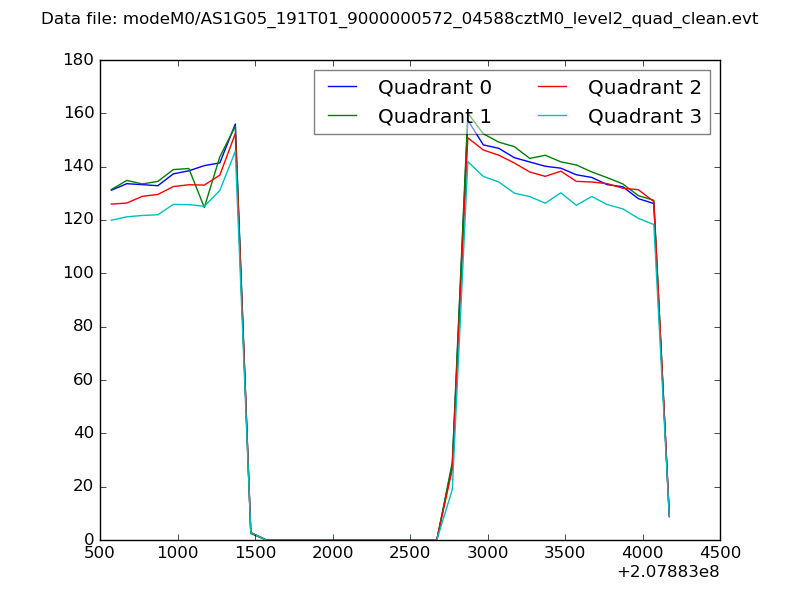 |
|
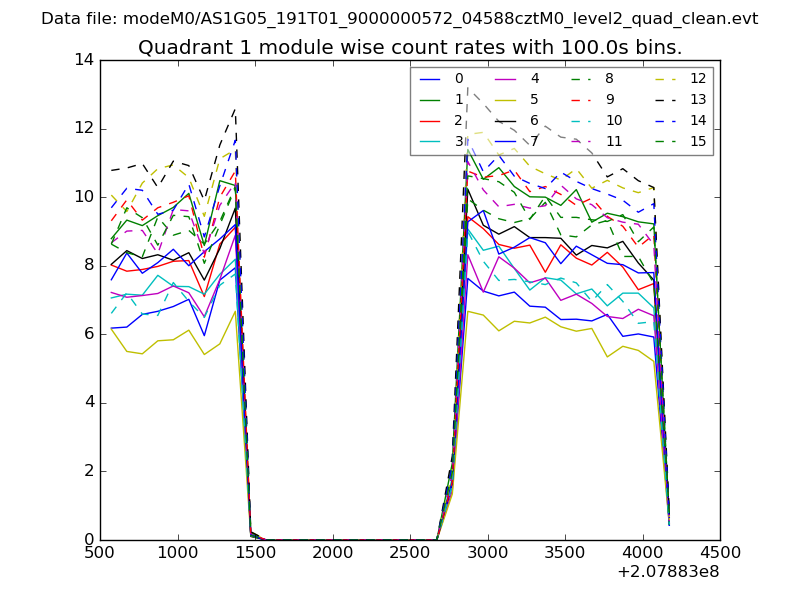
| Module-wise count rates for Quadrant A Data is divided into 100 sec bins |
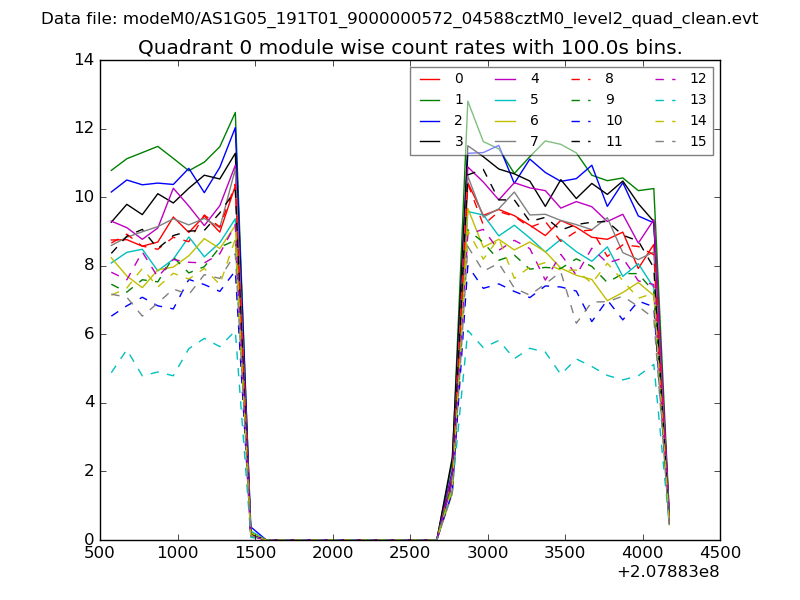 |
 |
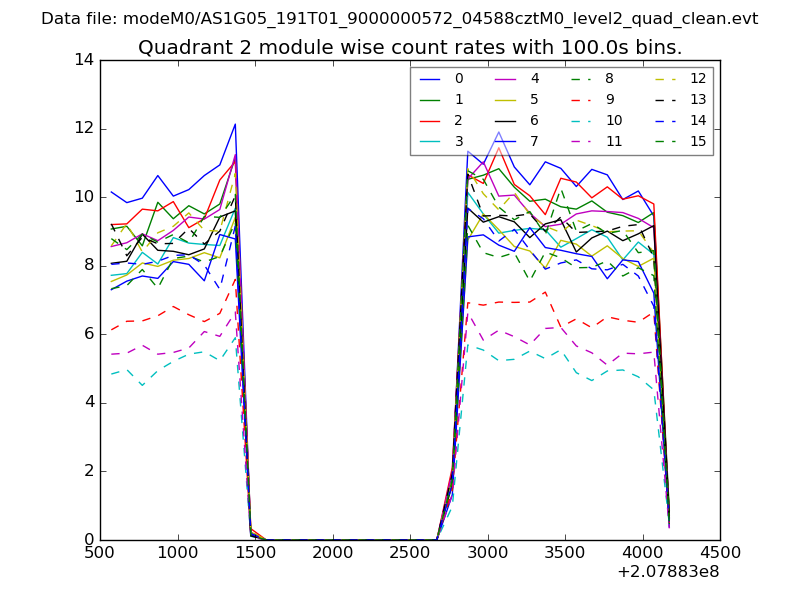
| Module-wise count rates for Quadrant B Data is divided into 100 sec bins |
 |
 |
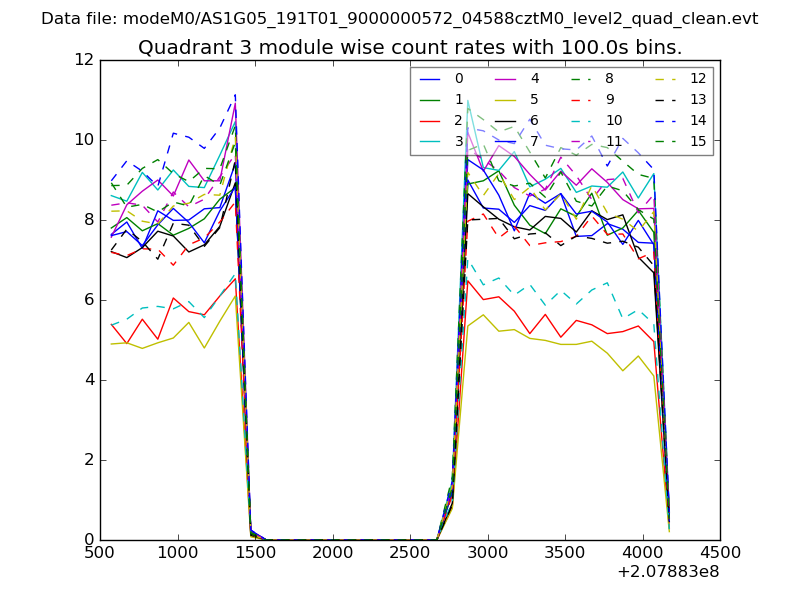
| Module-wise count rates for Quadrant C Data is divided into 100 sec bins |
 |
 |
| Module-wise count rates for Quadrant D Data is divided into 100 sec bins |
 |
 |
| Parameter | Plot |
|---|---|
| CZT HV Monitor | 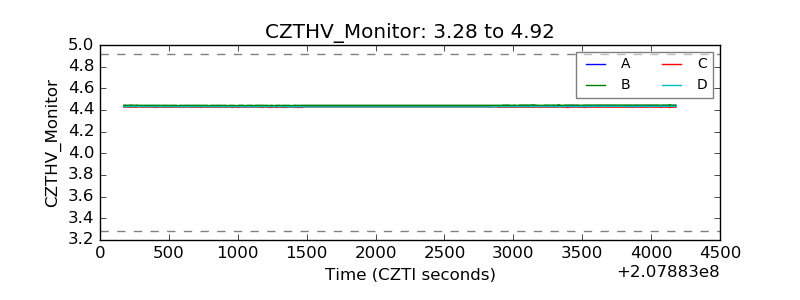 |
| D_VDD | 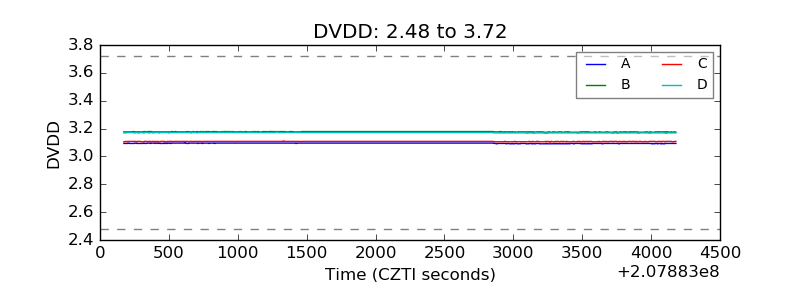 |
| Temperature 1 | 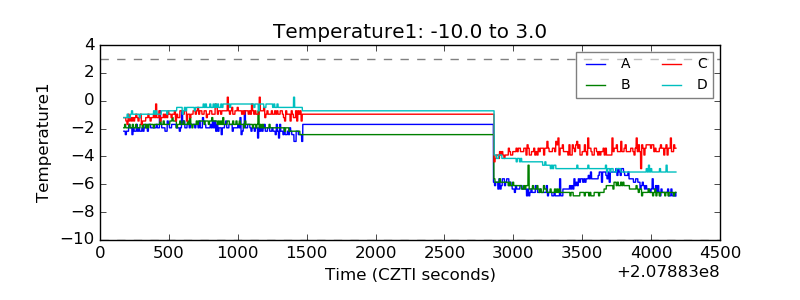 |
| Veto HV Monitor | 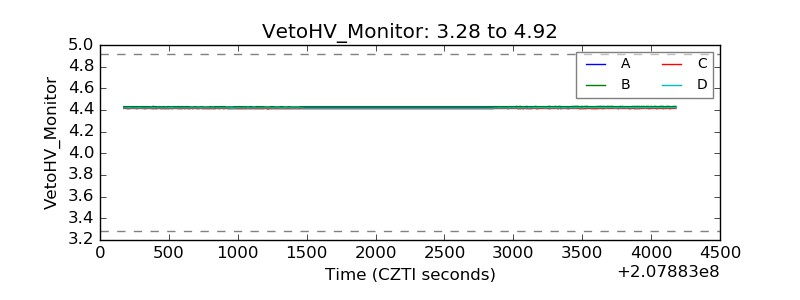 |
| Veto LLD | 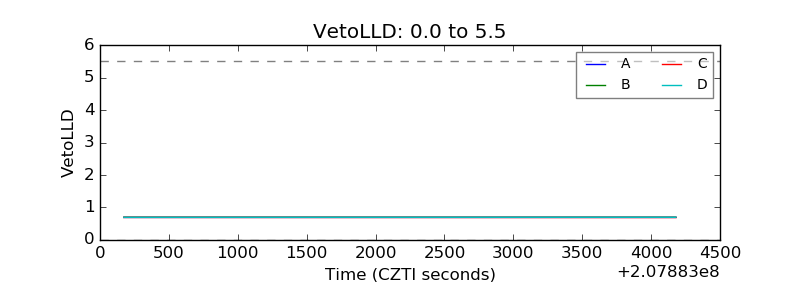 |
| Alpha Counter | 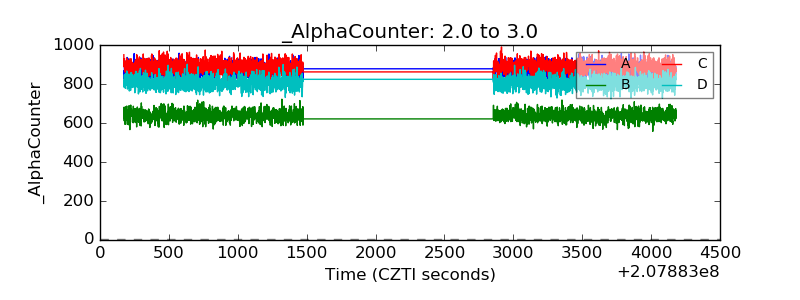 |
| _CPM_Rate | 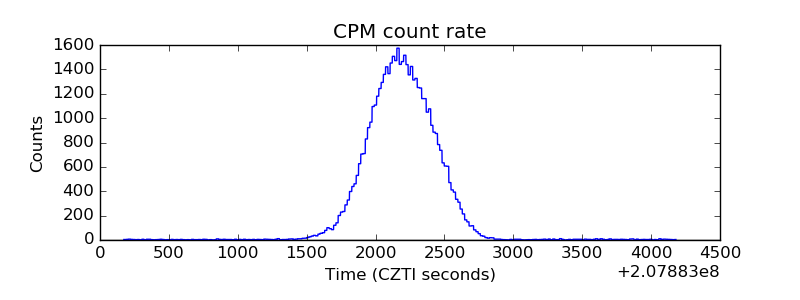 |
| CZT Counter | 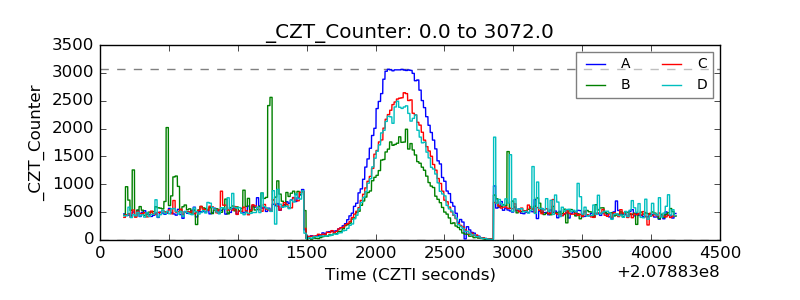 |
| +2.5 Volts monitor |  |
| +5 Volts monitor |  |
| _ROLL_ROT | 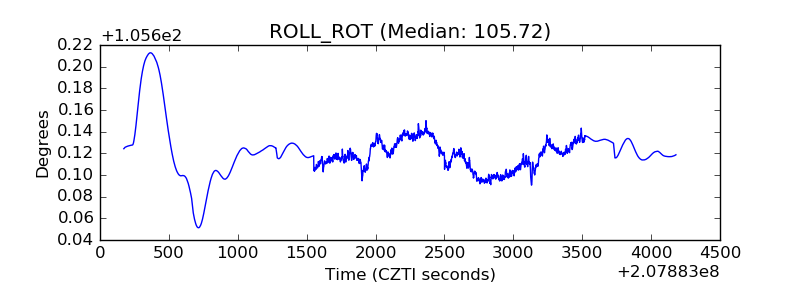 |
| _Roll_DEC | 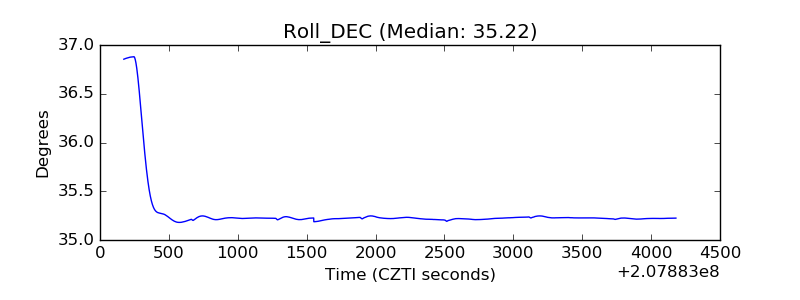 |
| _Roll_RA | 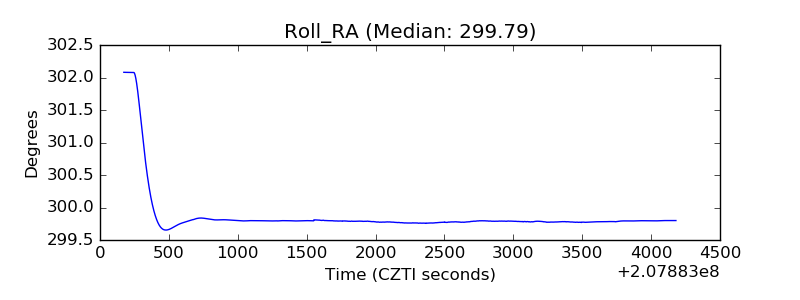 |
| Veto Counter | 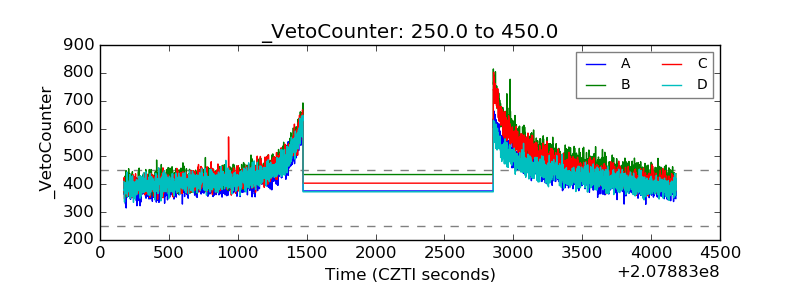 |