| Param | Original file | Final file |
|---|---|---|
| Filename | modeM0/AS1G05_191T01_9000000572_04590cztM0_level2.evt | modeM0/AS1G05_191T01_9000000572_04590cztM0_level2_quad_clean.evt |
| Size (bytes) | 425,943,360 | 80,182,080 |
| Size | 406.2 MB | 76.5 MB |
| Events in quadrant A | 3,012,892 | 505,406 |
| Events in quadrant B | 3,180,591 | 505,370 |
| Events in quadrant C | 2,958,139 | 493,855 |
| Events in quadrant D | 3,308,730 | 472,819 |
| Mode M9 | |||
|---|---|---|---|
| Quadrant | BADHDUFLAG | Total packets | Discarded packets |
| A | 0 | 11 | 0 |
| B | 0 | 11 | 0 |
| C | 0 | 11 | 0 |
| D | 0 | 11 | 0 |
| Mode M0 | |||
|---|---|---|---|
| Quadrant | BADHDUFLAG | Total packets | Discarded packets |
| A | 0 | 13311 | 2 |
| B | 0 | 13560 | 1 |
| C | 0 | 13327 | 1 |
| D | 0 | 14492 | 1 |
| Mode SS | |||
|---|---|---|---|
| Quadrant | BADHDUFLAG | Total packets | Discarded packets |
| A | 0 | 130 | 0 |
| B | 0 | 130 | 0 |
| C | 0 | 130 | 0 |
| D | 0 | 130 | 0 |
| Quadrant | Total seconds | Saturated seconds | Saturation percentage |
|---|---|---|---|
| A | 6463 | 44 | 0.680798% |
| B | 6463 | 52 | 0.804580% |
| C | 6463 | 24 | 0.371345% |
| D | 6463 | 76 | 1.175924% |
Noise dominated data is calculated using 1-second bins in cleaned event files. If a bin has >2000 counts, and if more than 50% of those come from <1% of pixels, then it is considered to be noise-dominated and hence unusable.
| Quadrant | # 1 sec bins | Bins with >0 counts | Bins with >2000 counts | High rate bins dominated by noise | Noise dominated (total time) | Noise dominated (detector-on time) | Marked lightcurve |
|---|---|---|---|---|---|---|---|
| A | 7498 | 6464 | 0 | 0 | 0.00% | 0.00% | 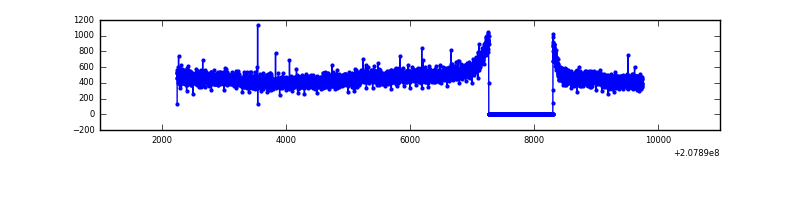 |
| B | 7498 | 6464 | 0 | 0 | 0.00% | 0.00% | 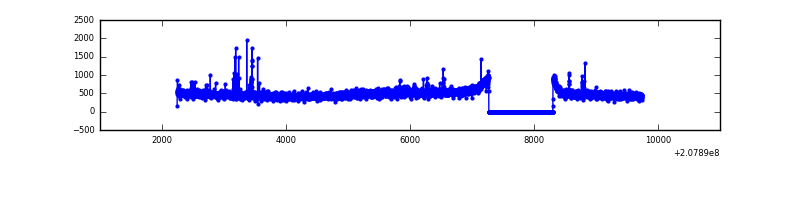 |
| C | 7498 | 6464 | 0 | 0 | 0.00% | 0.00% | 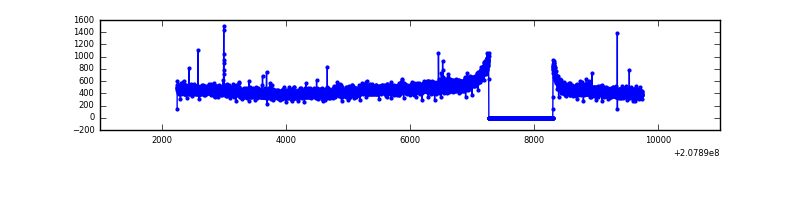 |
| D | 7498 | 6464 | 45 | 45 | 0.60% | 0.70% | 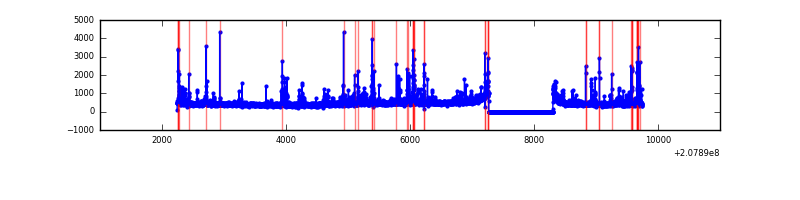 |
Top three noisy pixels from each quadrant. If the there are fewer than three noisy pixels in the level2.evt file, extra rows are filled as -1
| Pixel properties | Quadrant properties | ||||||
|---|---|---|---|---|---|---|---|
| Quadrant | DetID | PixID | Counts | Sigma | Mean | Median | Sigma |
| A | 12 | 194 | 7638 | 43.66 | 781 | 767 | 157.4 |
| A | 0 | 226 | 7638 | 43.66 | 781 | 767 | 157.4 |
| A | 15 | 174 | 6466 | 36.21 | 781 | 767 | 157.4 |
| B | 15 | 204 | 40727 | 264.04 | 790 | 774 | 151.3 |
| B | 4 | 172 | 20894 | 132.97 | 790 | 774 | 151.3 |
| B | 14 | 167 | 17092 | 107.84 | 790 | 774 | 151.3 |
| C | 9 | 54 | 7686 | 39.28 | 754 | 759 | 176.4 |
| C | 13 | 61 | 6111 | 30.35 | 754 | 759 | 176.4 |
| C | 7 | 247 | 4858 | 23.24 | 754 | 759 | 176.4 |
| D | 13 | 235 | 173501 | 957.4 | 742 | 724 | 180.5 |
| D | 10 | 15 | 119404 | 657.63 | 742 | 724 | 180.5 |
| D | 12 | 110 | 59928 | 328.06 | 742 | 724 | 180.5 |
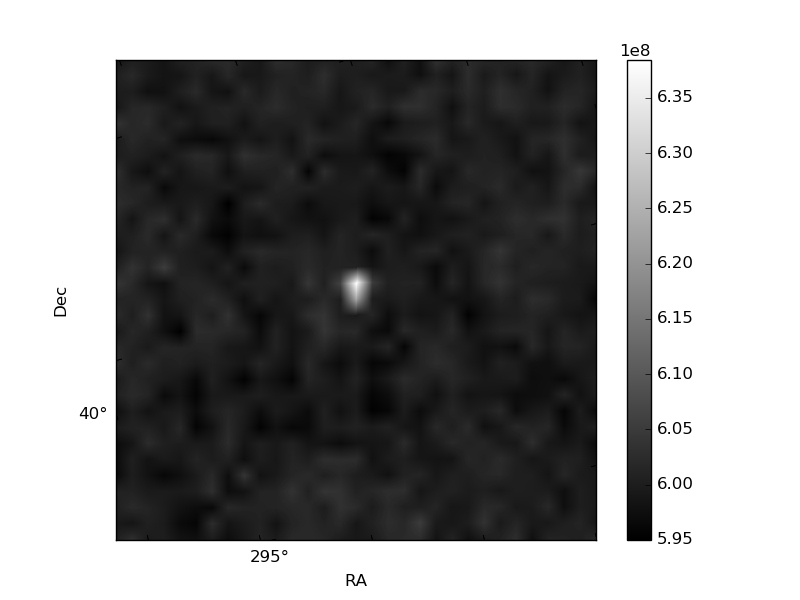
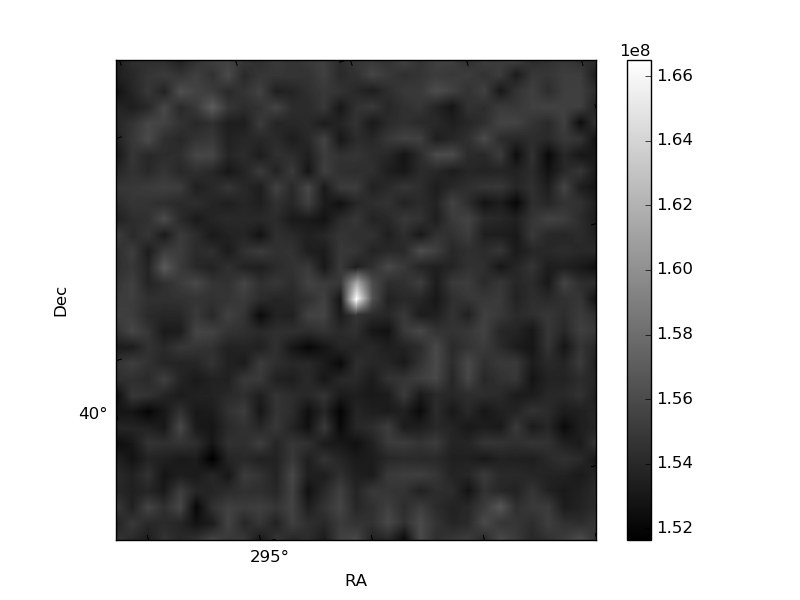
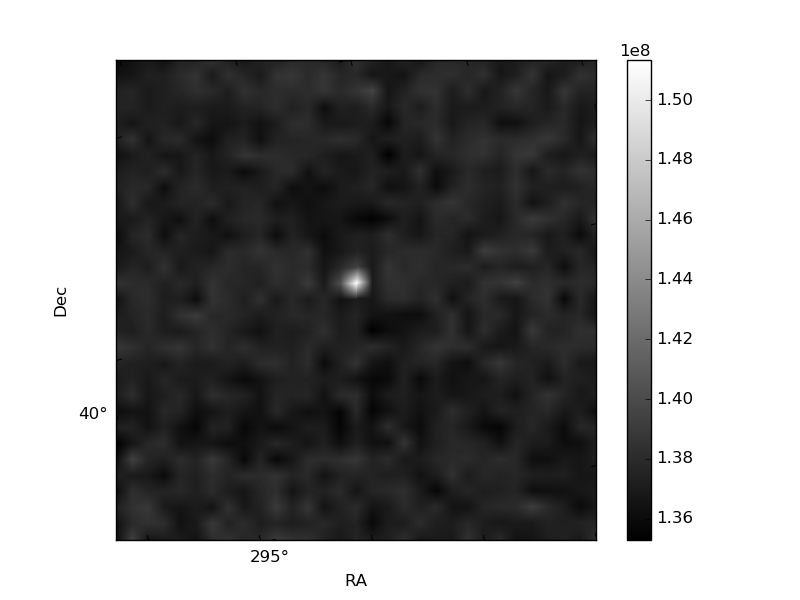
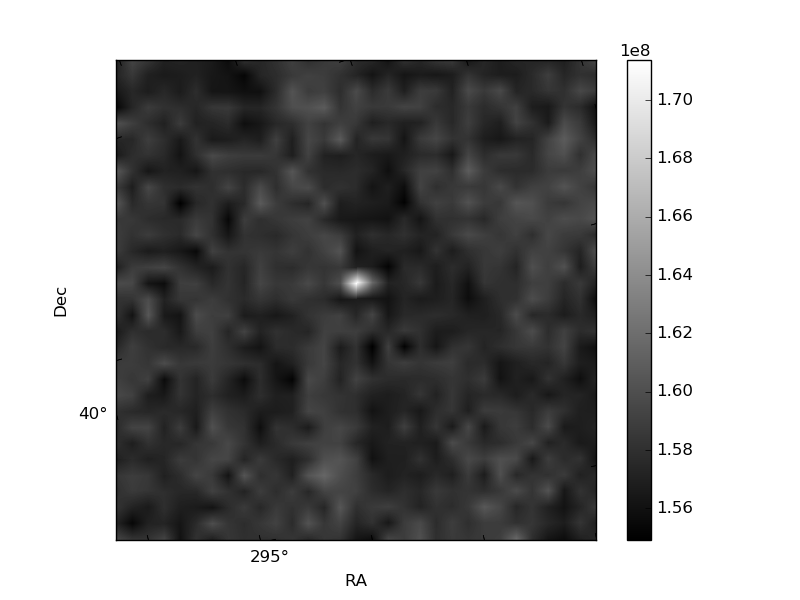
Histogram calculated using DETX and DETY for each event in the final _common_clean file
| Quadrant A | 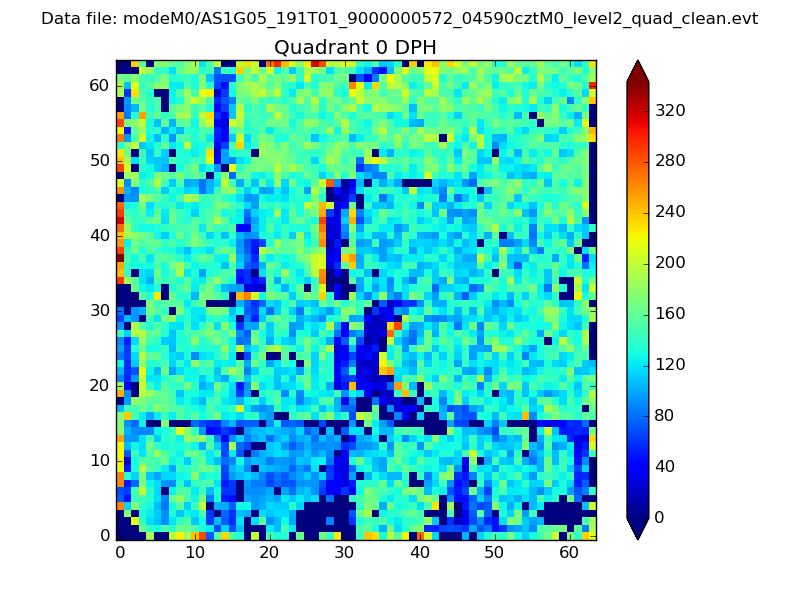 |
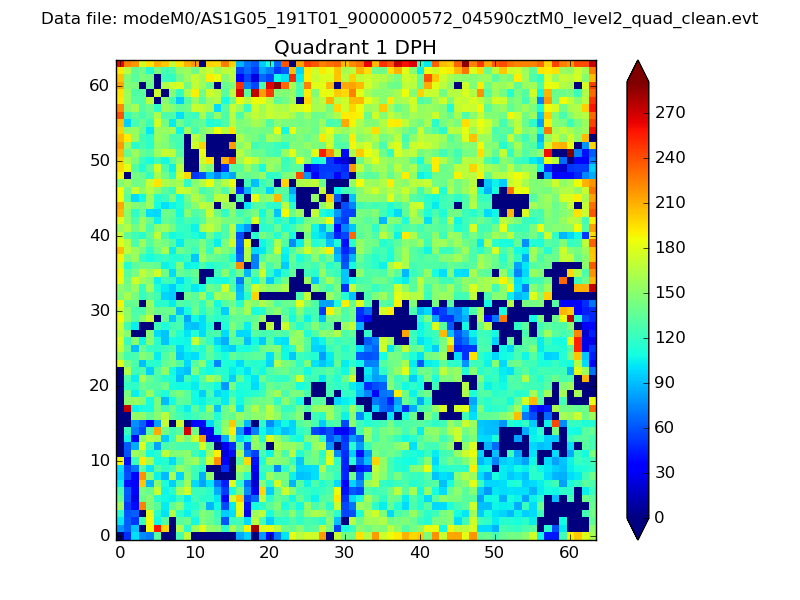 |
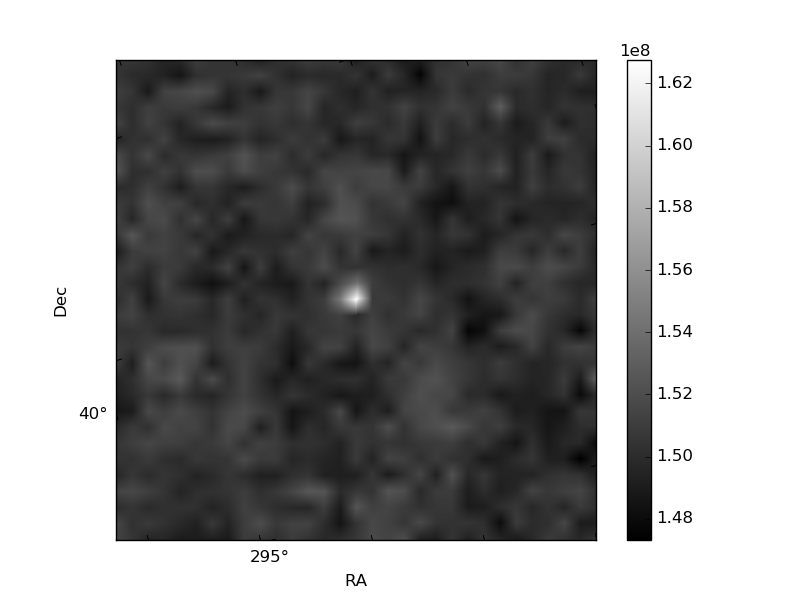
Quadrant B |
|---|---|---|---|
| Quadrant D | 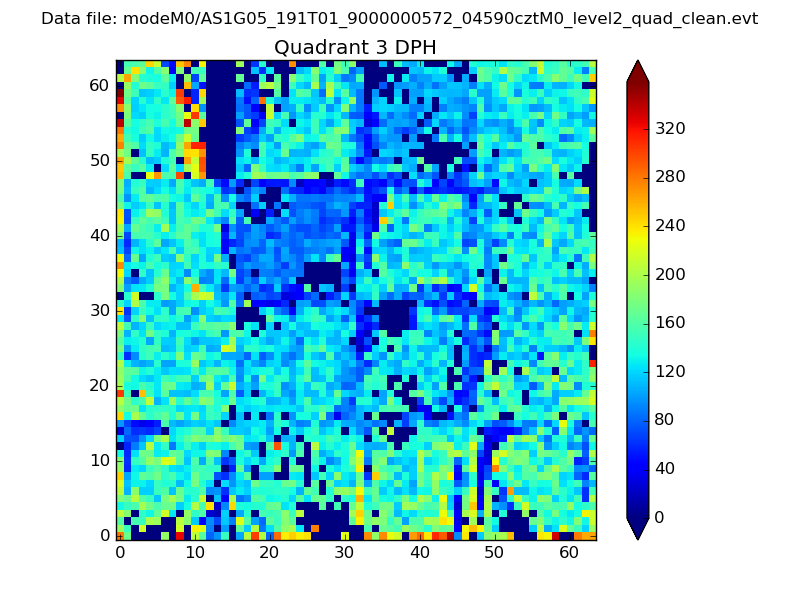 |
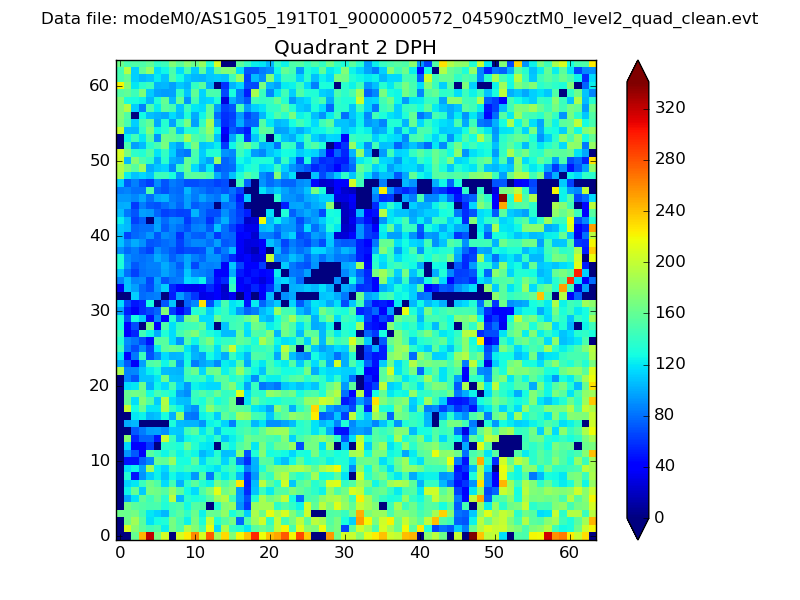 |
Quadrant C |
| Plot type | Count rate plots | Images |
|---|---|---|
| Comparison with Poisson distribution Blue bars denote a histogram of data divided into 1 sec bins. Red curve is a Poisson curve with rate = median count rate of data. |
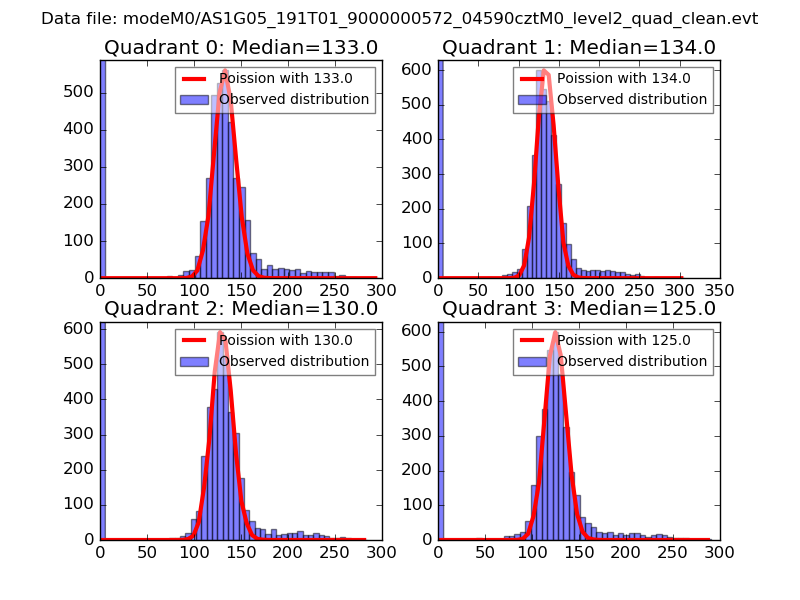 |
 |
| Quadrant-wise count rates Data is divided into 100 sec bins |
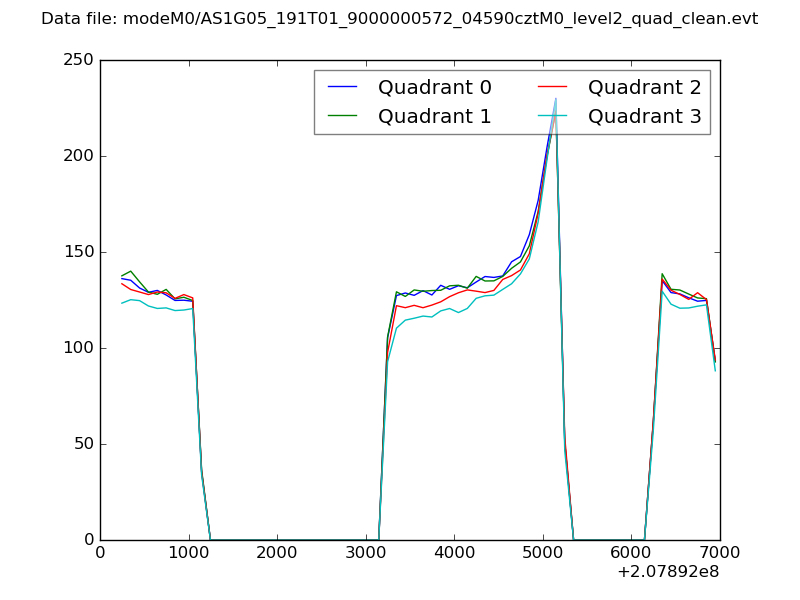 |
|
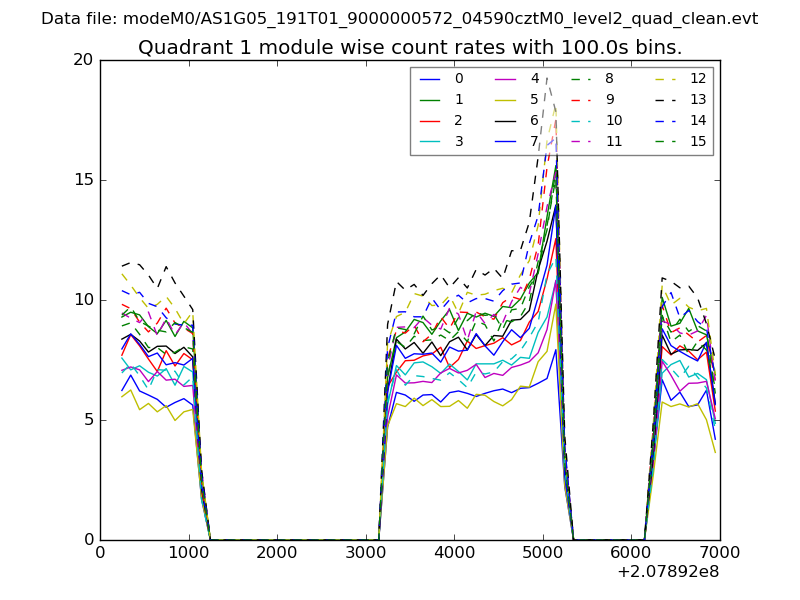
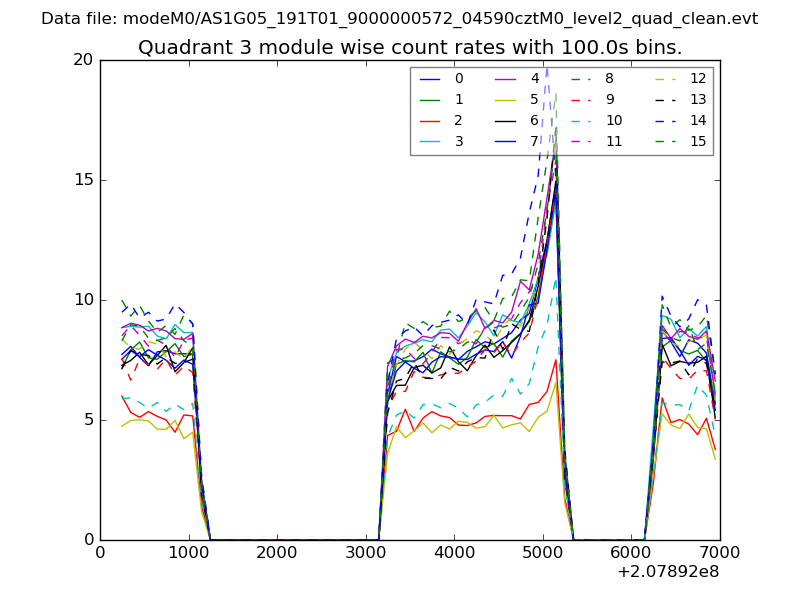
| Module-wise count rates for Quadrant A Data is divided into 100 sec bins |
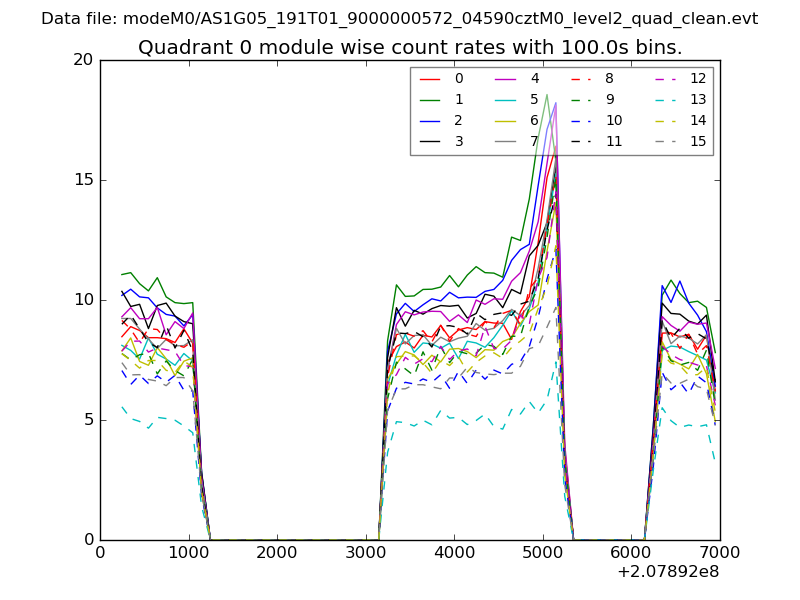 |
 |
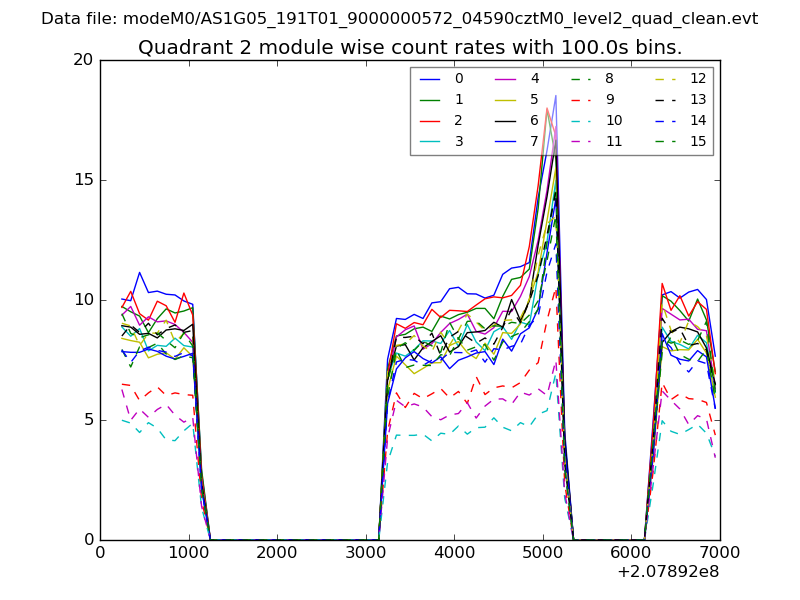
| Module-wise count rates for Quadrant B Data is divided into 100 sec bins |
 |
 |
| Module-wise count rates for Quadrant C Data is divided into 100 sec bins |
 |
 |
| Module-wise count rates for Quadrant D Data is divided into 100 sec bins |
 |
 |
| Parameter | Plot |
|---|---|
| CZT HV Monitor | 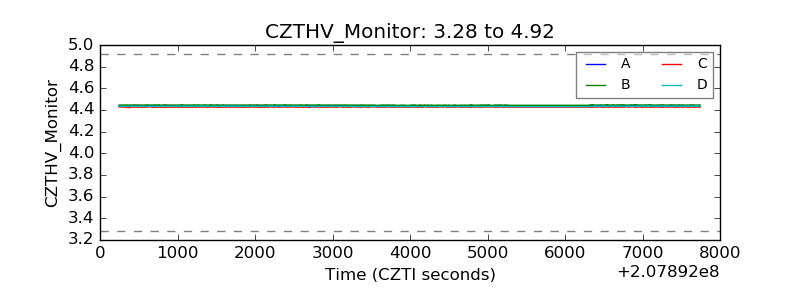 |
| D_VDD | 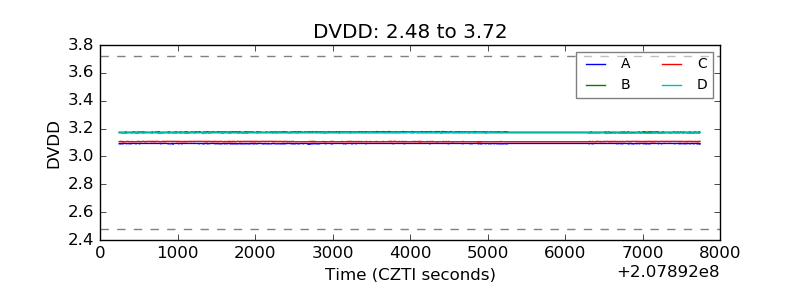 |
| Temperature 1 | 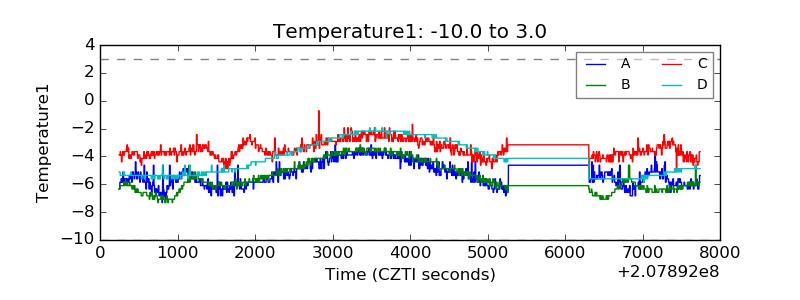 |
| Veto HV Monitor | 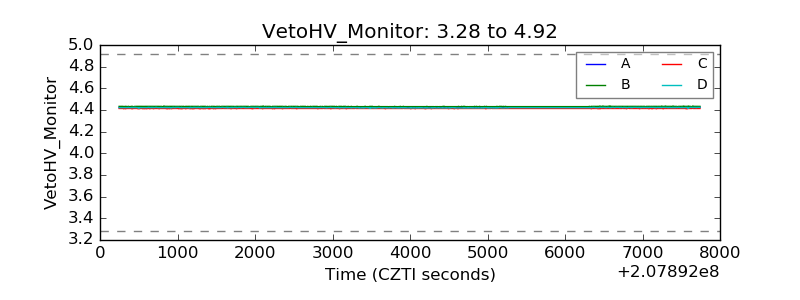 |
| Veto LLD | 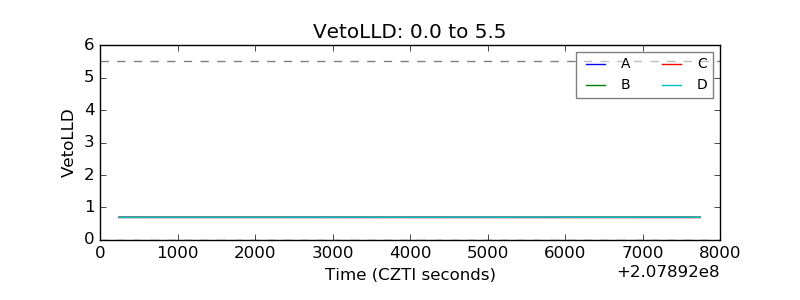 |
| Alpha Counter | 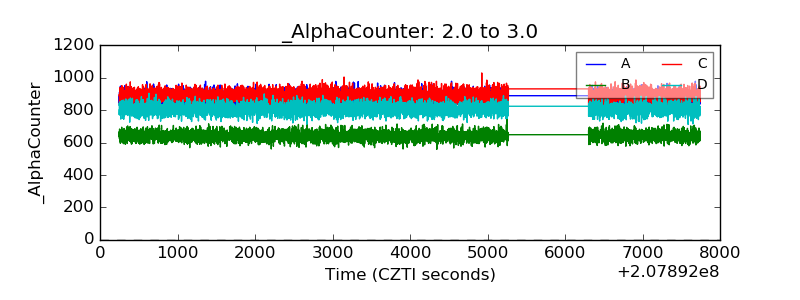 |
| _CPM_Rate | 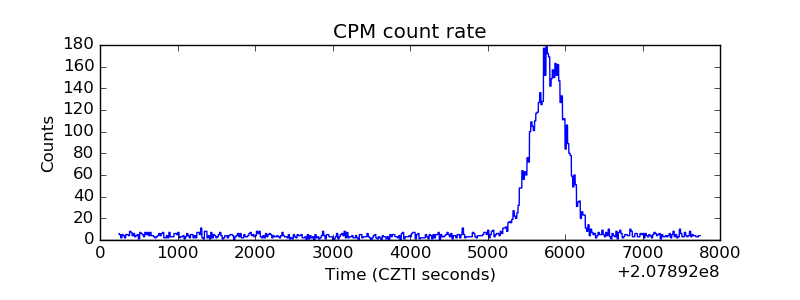 |
| CZT Counter | 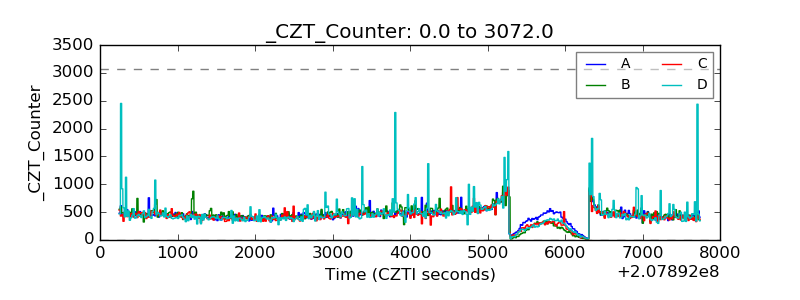 |
| +2.5 Volts monitor |  |
| +5 Volts monitor |  |
| _ROLL_ROT | 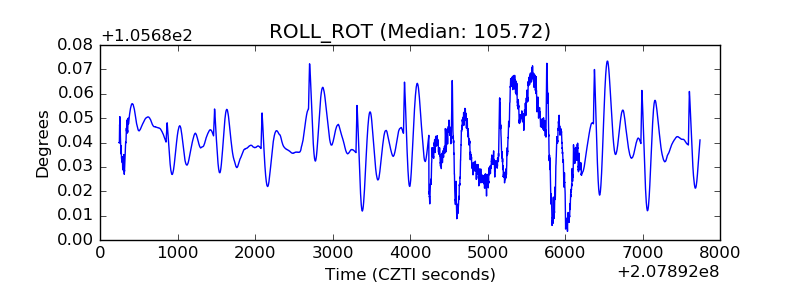 |
| _Roll_DEC | 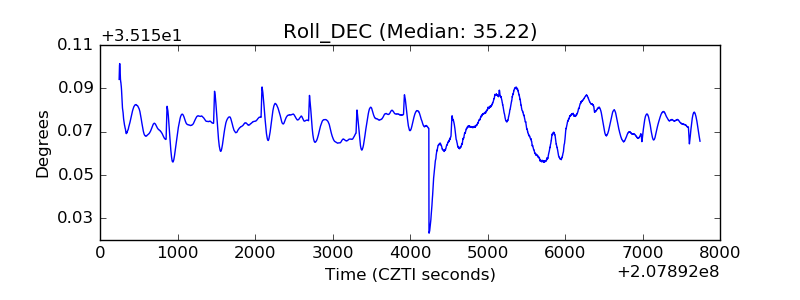 |
| _Roll_RA | 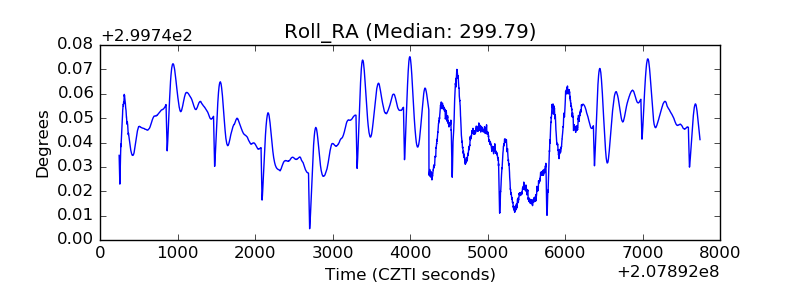 |
| Veto Counter | 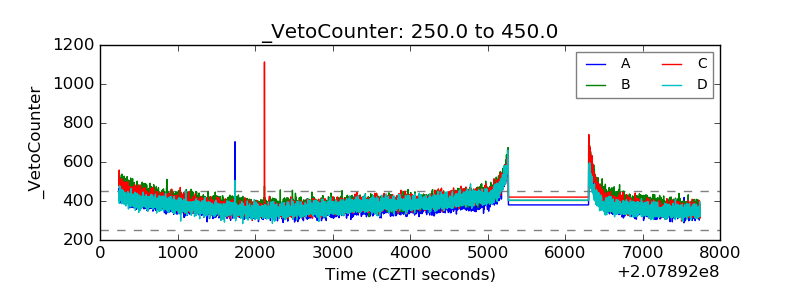 |