| Param | Original file | Final file |
|---|---|---|
| Filename | modeM0/AS1G05_191T01_9000000572_04593cztM0_level2.evt | modeM0/AS1G05_191T01_9000000572_04593cztM0_level2_quad_clean.evt |
| Size (bytes) | 530,340,480 | 80,438,400 |
| Size | 505.8 MB | 76.7 MB |
| Events in quadrant A | 3,711,830 | 491,184 |
| Events in quadrant B | 4,050,295 | 477,881 |
| Events in quadrant C | 3,487,292 | 477,627 |
| Events in quadrant D | 4,294,219 | 458,532 |
| Mode M0 | |||
|---|---|---|---|
| Quadrant | BADHDUFLAG | Total packets | Discarded packets |
| A | 0 | 15985 | 9 |
| B | 0 | 17068 | 31 |
| C | 0 | 15772 | 8 |
| D | 0 | 18096 | 18 |
| Mode SS | |||
|---|---|---|---|
| Quadrant | BADHDUFLAG | Total packets | Discarded packets |
| A | 0 | 152 | 0 |
| B | 0 | 152 | 0 |
| C | 0 | 152 | 0 |
| D | 0 | 152 | 0 |
| Quadrant | Total seconds | Saturated seconds | Saturation percentage |
|---|---|---|---|
| A | 7629 | 127 | 1.664700% |
| B | 7623 | 209 | 2.741703% |
| C | 7629 | 41 | 0.537423% |
| D | 7627 | 179 | 2.346925% |
Noise dominated data is calculated using 1-second bins in cleaned event files. If a bin has >2000 counts, and if more than 50% of those come from <1% of pixels, then it is considered to be noise-dominated and hence unusable.
| Quadrant | # 1 sec bins | Bins with >0 counts | Bins with >2000 counts | High rate bins dominated by noise | Noise dominated (total time) | Noise dominated (detector-on time) | Marked lightcurve |
|---|---|---|---|---|---|---|---|
| A | 7633 | 7633 | 0 | 0 | 0.00% | 0.00% | 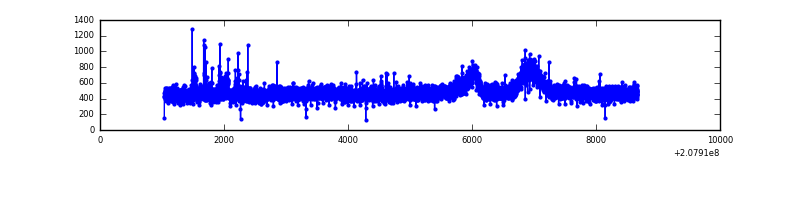 |
| B | 7633 | 7633 | 69 | 69 | 0.90% | 0.90% | 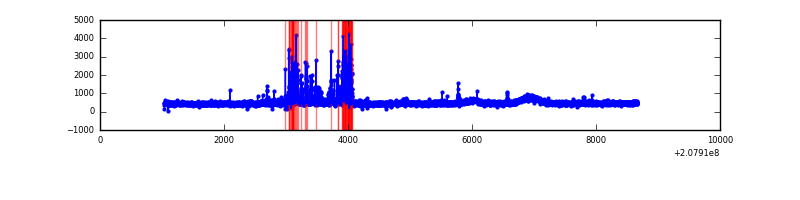 |
| C | 7633 | 7633 | 0 | 0 | 0.00% | 0.00% | 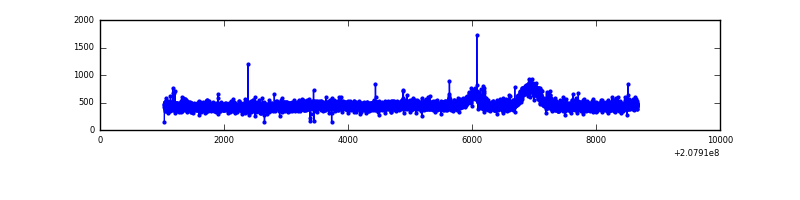 |
| D | 7633 | 7633 | 120 | 120 | 1.57% | 1.57% | 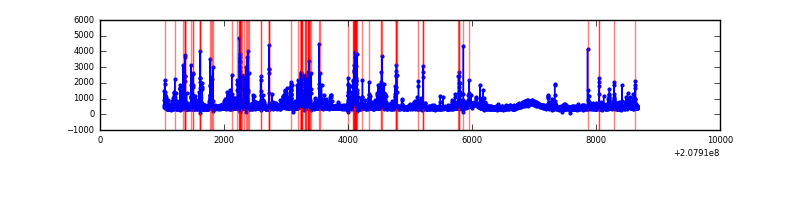 |
Top three noisy pixels from each quadrant. If the there are fewer than three noisy pixels in the level2.evt file, extra rows are filled as -1
| Pixel properties | Quadrant properties | ||||||
|---|---|---|---|---|---|---|---|
| Quadrant | DetID | PixID | Counts | Sigma | Mean | Median | Sigma |
| A | 13 | 14 | 93052 | 491.97 | 916 | 900 | 187.3 |
| A | 8 | 15 | 63049 | 331.79 | 916 | 900 | 187.3 |
| A | 13 | 11 | 24279 | 124.81 | 916 | 900 | 187.3 |
| B | 2 | 249 | 413784 | 2306.32 | 919 | 896 | 179.0 |
| B | 15 | 204 | 38146 | 208.07 | 919 | 896 | 179.0 |
| B | 4 | 80 | 23550 | 126.54 | 919 | 896 | 179.0 |
| C | 9 | 247 | 10276 | 45.37 | 884 | 889 | 206.9 |
| C | 14 | 48 | 10116 | 44.6 | 884 | 889 | 206.9 |
| C | 13 | 61 | 7344 | 31.2 | 884 | 889 | 206.9 |
| D | 10 | 15 | 289631 | 1360.88 | 873 | 849 | 212.2 |
| D | 7 | 67 | 212813 | 998.87 | 873 | 849 | 212.2 |
| D | 13 | 235 | 173954 | 815.75 | 873 | 849 | 212.2 |
Histogram calculated using DETX and DETY for each event in the final _common_clean file
| Quadrant A | 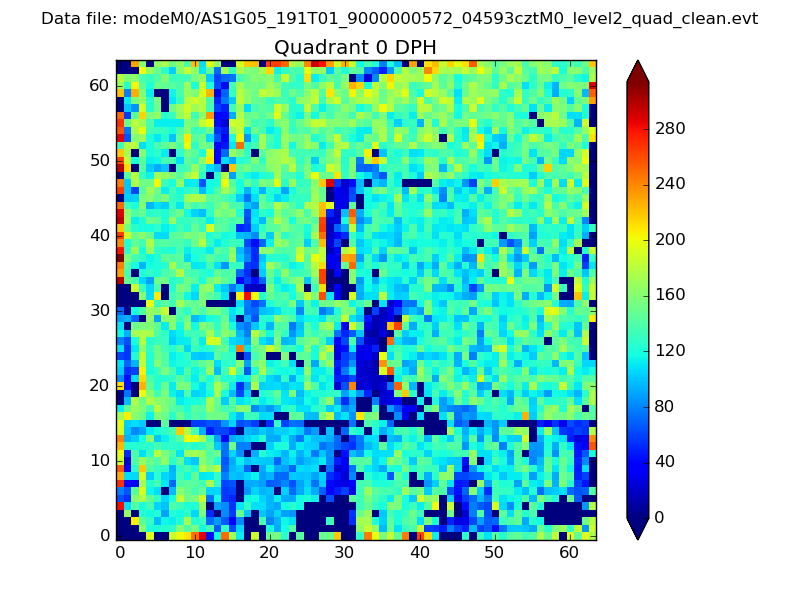 |
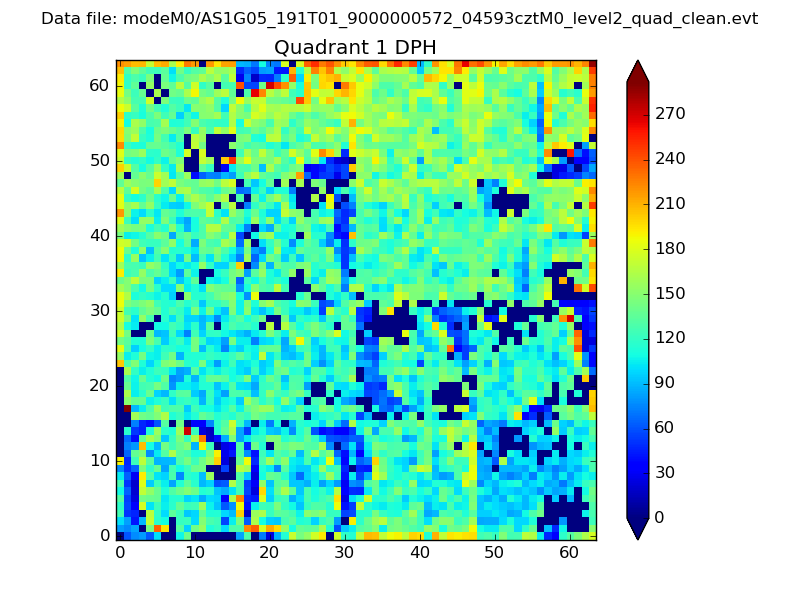 |
Quadrant B |
|---|---|---|---|
| Quadrant D | 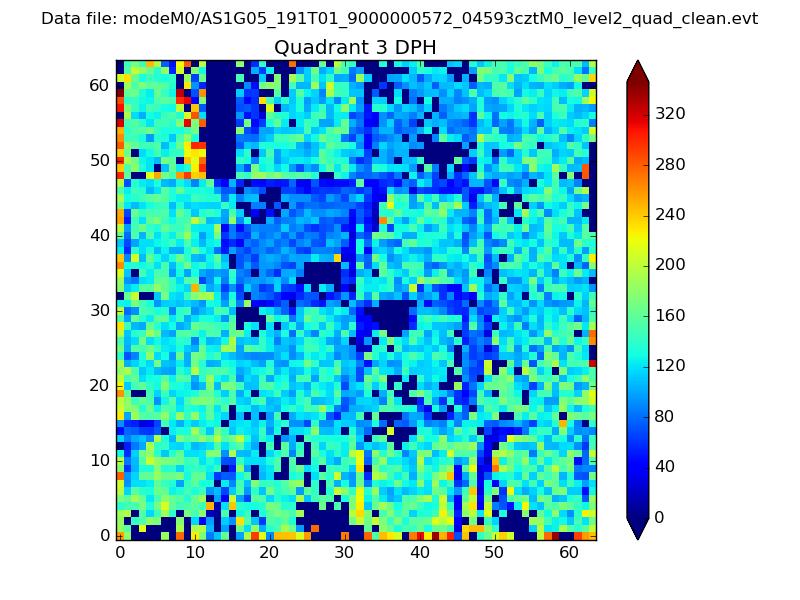 |
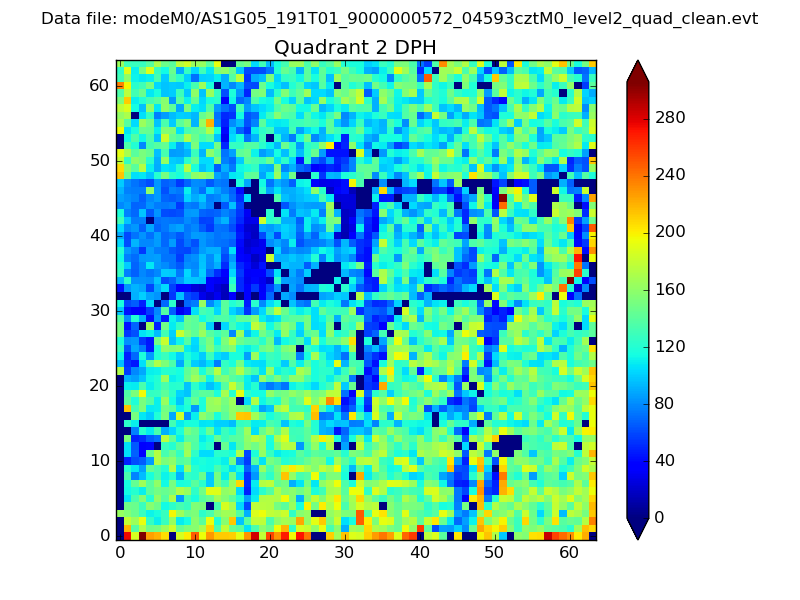 |
Quadrant C |
| Plot type | Count rate plots | Images |
|---|---|---|
| Comparison with Poisson distribution Blue bars denote a histogram of data divided into 1 sec bins. Red curve is a Poisson curve with rate = median count rate of data. |
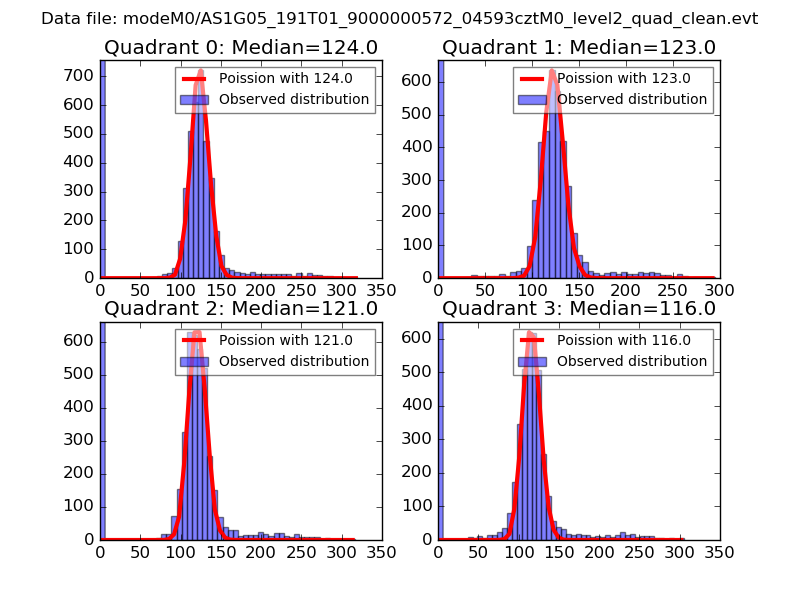 |
 |
| Quadrant-wise count rates Data is divided into 100 sec bins |
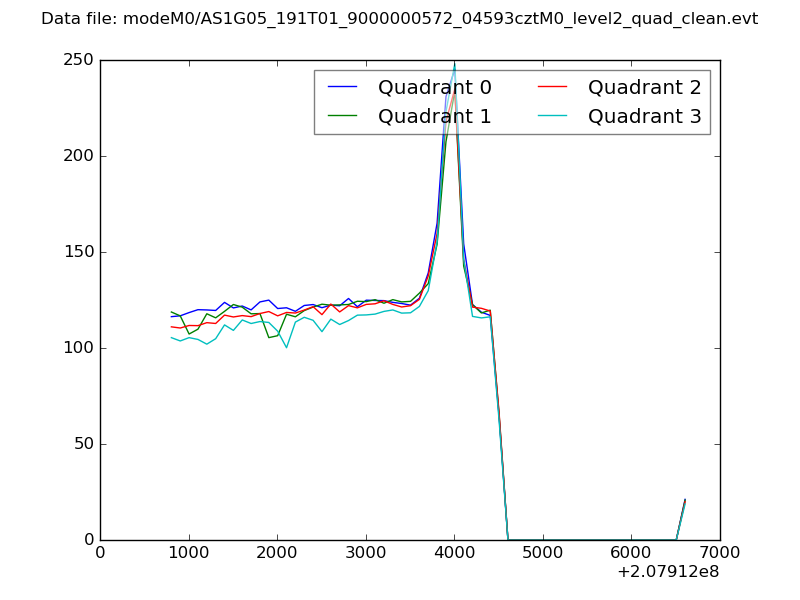 |
|
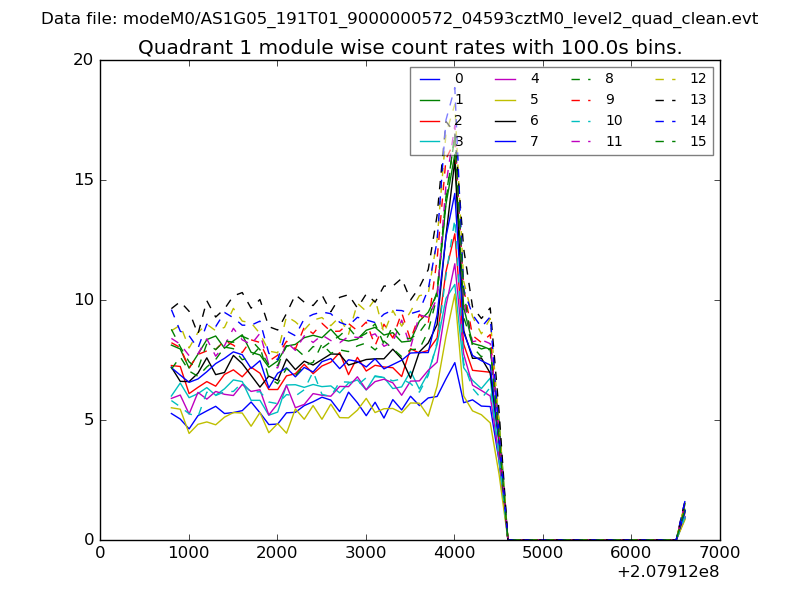
| Module-wise count rates for Quadrant A Data is divided into 100 sec bins |
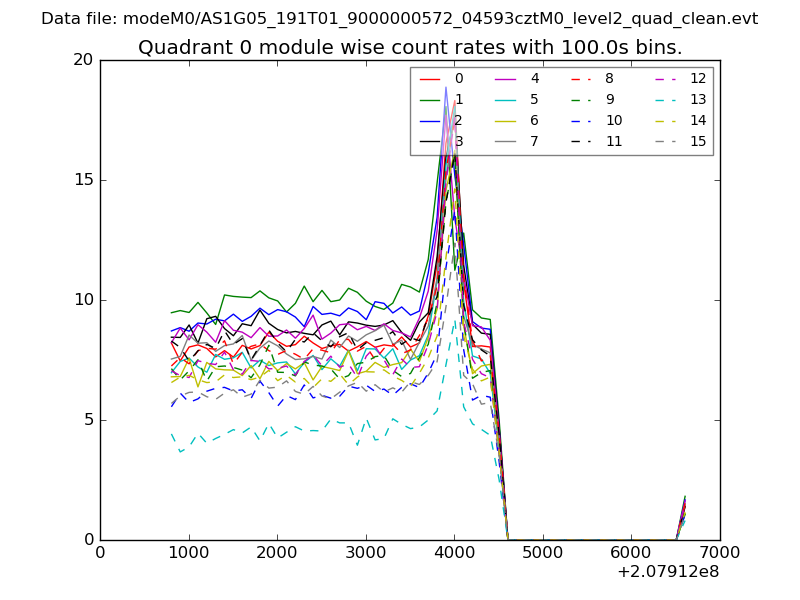 |
 |
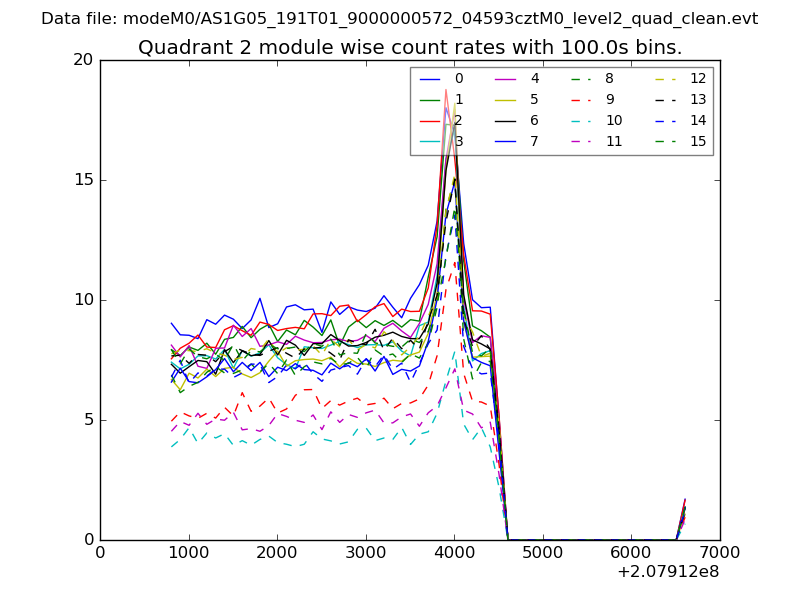
| Module-wise count rates for Quadrant B Data is divided into 100 sec bins |
 |
 |
| Module-wise count rates for Quadrant C Data is divided into 100 sec bins |
 |
 |
| Module-wise count rates for Quadrant D Data is divided into 100 sec bins |
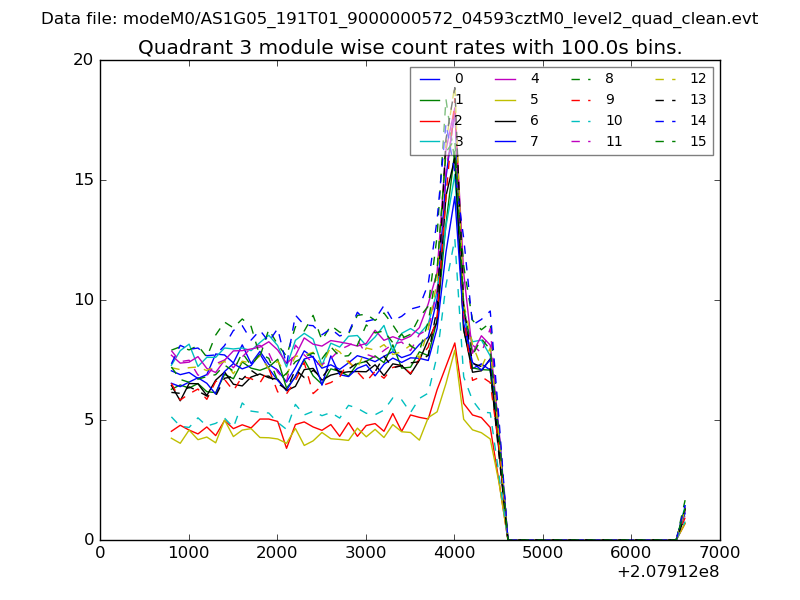 |
 |
| Parameter | Plot |
|---|---|
| CZT HV Monitor | 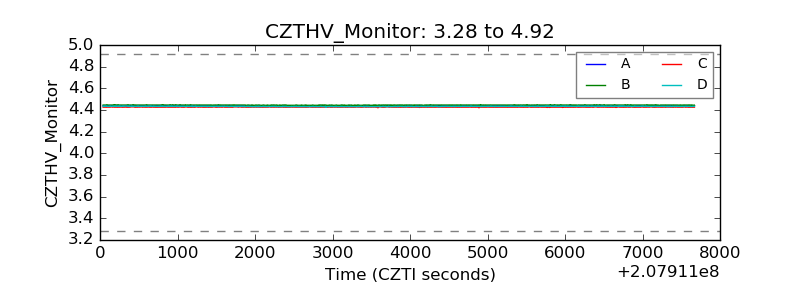 |
| D_VDD | 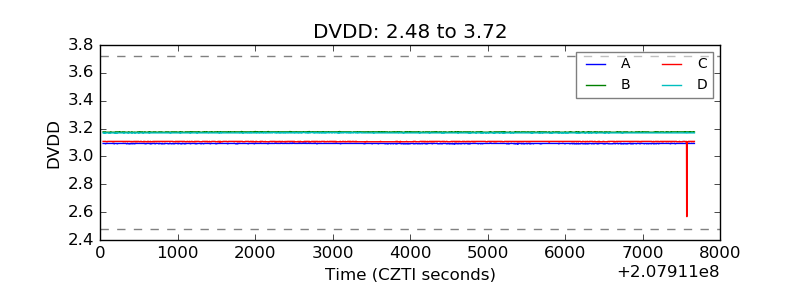 |
| Temperature 1 | 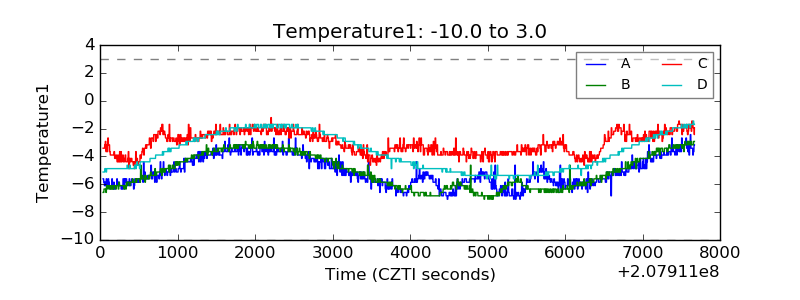 |
| Veto HV Monitor | 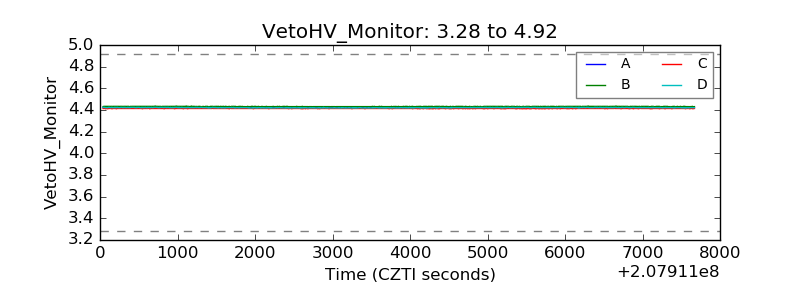 |
| Veto LLD | 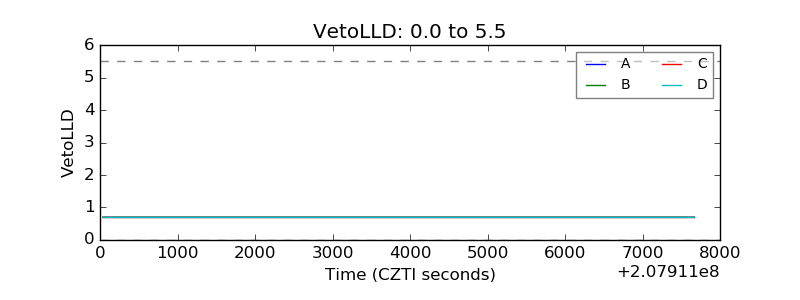 |
| Alpha Counter | 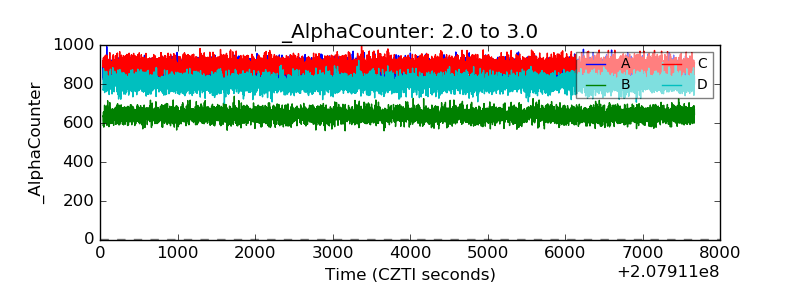 |
| _CPM_Rate | 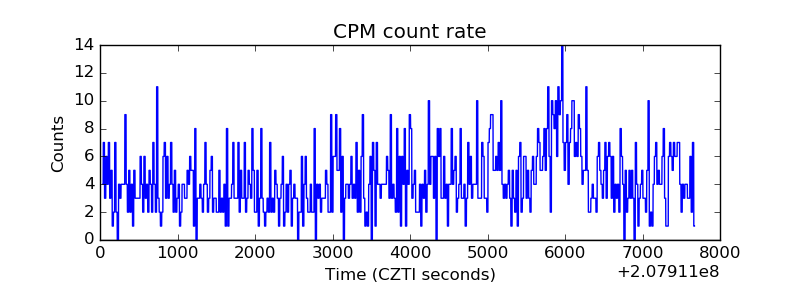 |
| CZT Counter | 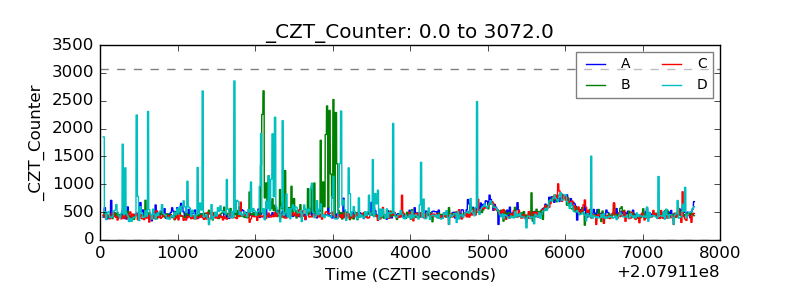 |
| +2.5 Volts monitor |  |
| +5 Volts monitor | 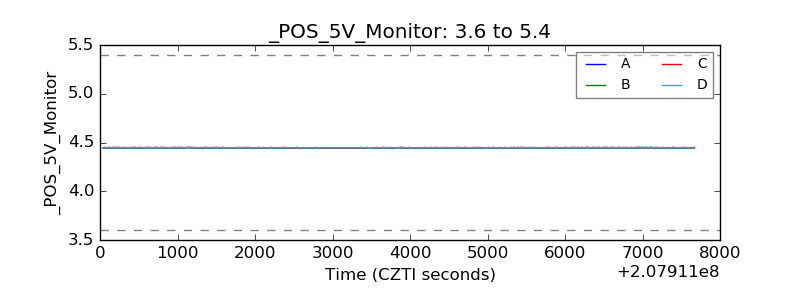 |
| _ROLL_ROT | 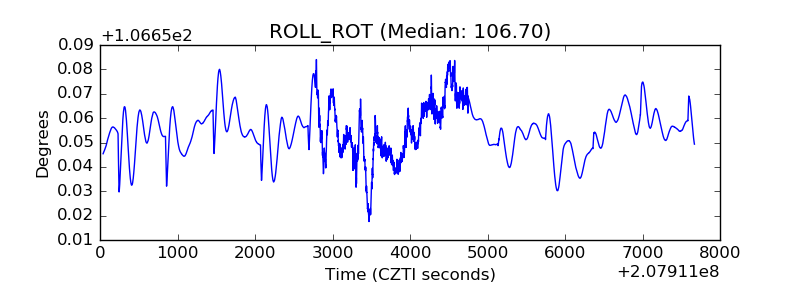 |
| _Roll_DEC | 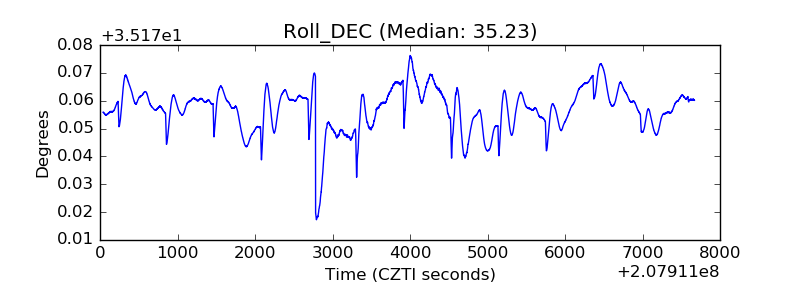 |
| _Roll_RA | 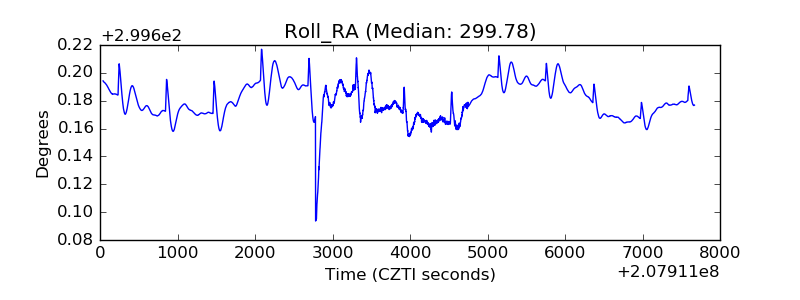 |
| Veto Counter | 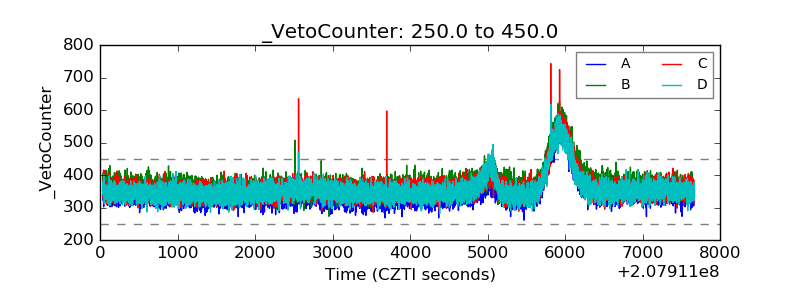 |