| Param | Original file | Final file |
|---|---|---|
| Filename | modeM0/AS1G05_191T01_9000000572_04594cztM0_level2.evt | modeM0/AS1G05_191T01_9000000572_04594cztM0_level2_quad_clean.evt |
| Size (bytes) | 536,817,600 | 81,288,000 |
| Size | 511.9 MB | 77.5 MB |
| Events in quadrant A | 3,676,580 | 503,503 |
| Events in quadrant B | 3,874,578 | 501,041 |
| Events in quadrant C | 3,416,690 | 493,867 |
| Events in quadrant D | 4,786,390 | 447,142 |
| Mode M9 | |||
|---|---|---|---|
| Quadrant | BADHDUFLAG | Total packets | Discarded packets |
| A | 0 | 3 | 0 |
| B | 0 | 3 | 0 |
| C | 0 | 3 | 0 |
| D | 0 | 3 | 0 |
| Mode M0 | |||
|---|---|---|---|
| Quadrant | BADHDUFLAG | Total packets | Discarded packets |
| A | 0 | 15821 | 221 |
| B | 0 | 16478 | 214 |
| C | 0 | 15439 | 197 |
| D | 0 | 19871 | 493 |
| Mode SS | |||
|---|---|---|---|
| Quadrant | BADHDUFLAG | Total packets | Discarded packets |
| A | 0 | 152 | 2 |
| B | 0 | 152 | 2 |
| C | 0 | 152 | 2 |
| D | 0 | 152 | 2 |
| Quadrant | Total seconds | Saturated seconds | Saturation percentage |
|---|---|---|---|
| A | 7411 | 152 | 2.051005% |
| B | 7413 | 211 | 2.846351% |
| C | 7421 | 96 | 1.293626% |
| D | 7393 | 528 | 7.141891% |
Noise dominated data is calculated using 1-second bins in cleaned event files. If a bin has >2000 counts, and if more than 50% of those come from <1% of pixels, then it is considered to be noise-dominated and hence unusable.
| Quadrant | # 1 sec bins | Bins with >0 counts | Bins with >2000 counts | High rate bins dominated by noise | Noise dominated (total time) | Noise dominated (detector-on time) | Marked lightcurve |
|---|---|---|---|---|---|---|---|
| A | 7800 | 7458 | 25 | 25 | 0.32% | 0.34% | 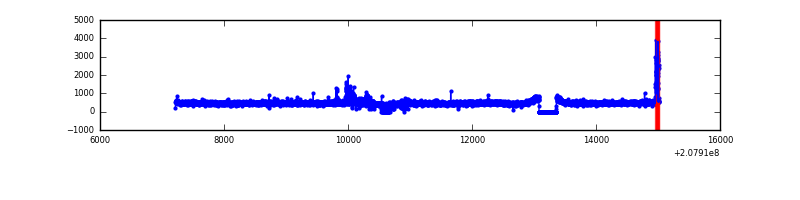 |
| B | 7800 | 7465 | 56 | 56 | 0.72% | 0.75% | 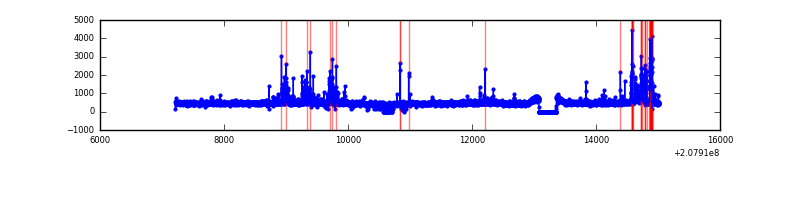 |
| C | 7800 | 7463 | 6 | 6 | 0.08% | 0.08% |  |
| D | 7799 | 7435 | 339 | 339 | 4.35% | 4.56% | 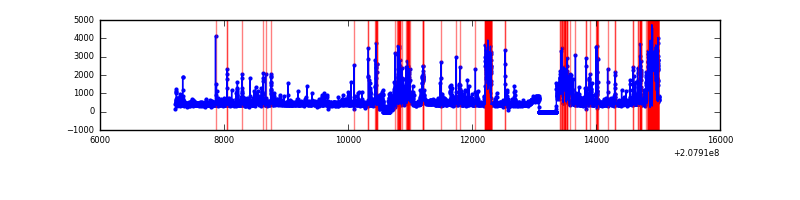 |
Top three noisy pixels from each quadrant. If the there are fewer than three noisy pixels in the level2.evt file, extra rows are filled as -1
| Pixel properties | Quadrant properties | ||||||
|---|---|---|---|---|---|---|---|
| Quadrant | DetID | PixID | Counts | Sigma | Mean | Median | Sigma |
| A | 15 | 174 | 162109 | 894.21 | 877 | 859 | 180.3 |
| A | 8 | 15 | 60235 | 329.27 | 877 | 859 | 180.3 |
| A | 13 | 14 | 56925 | 310.91 | 877 | 859 | 180.3 |
| B | 10 | 16 | 165691 | 965.35 | 884 | 865 | 170.7 |
| B | 2 | 249 | 149708 | 871.74 | 884 | 865 | 170.7 |
| B | 14 | 167 | 65673 | 379.57 | 884 | 865 | 170.7 |
| C | 14 | 48 | 43424 | 212.74 | 851 | 858 | 200.1 |
| C | 9 | 54 | 25258 | 121.95 | 851 | 858 | 200.1 |
| C | 0 | 239 | 8521 | 38.3 | 851 | 858 | 200.1 |
| D | 13 | 235 | 1399952 | 7007.53 | 817 | 793 | 199.7 |
| D | 2 | 136 | 86198 | 427.74 | 817 | 793 | 199.7 |
| D | 10 | 15 | 83929 | 416.38 | 817 | 793 | 199.7 |
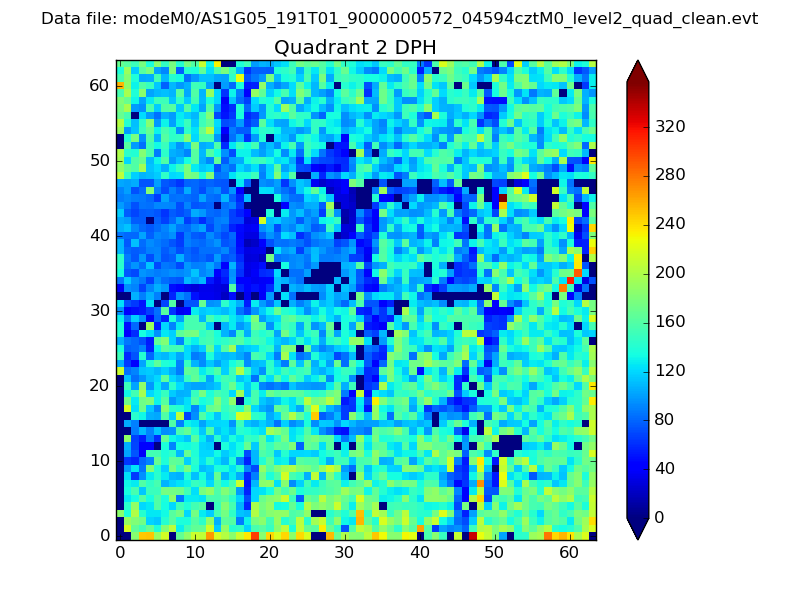
Histogram calculated using DETX and DETY for each event in the final _common_clean file
| Quadrant A | 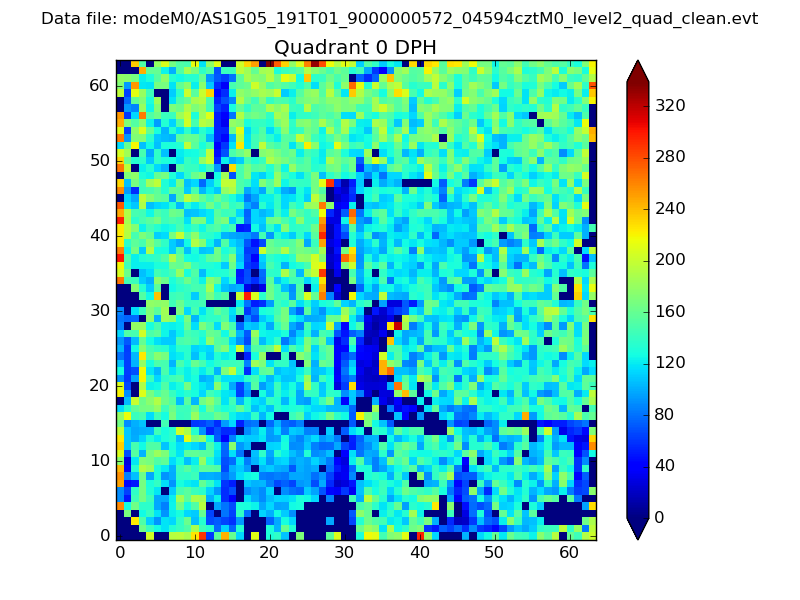 |
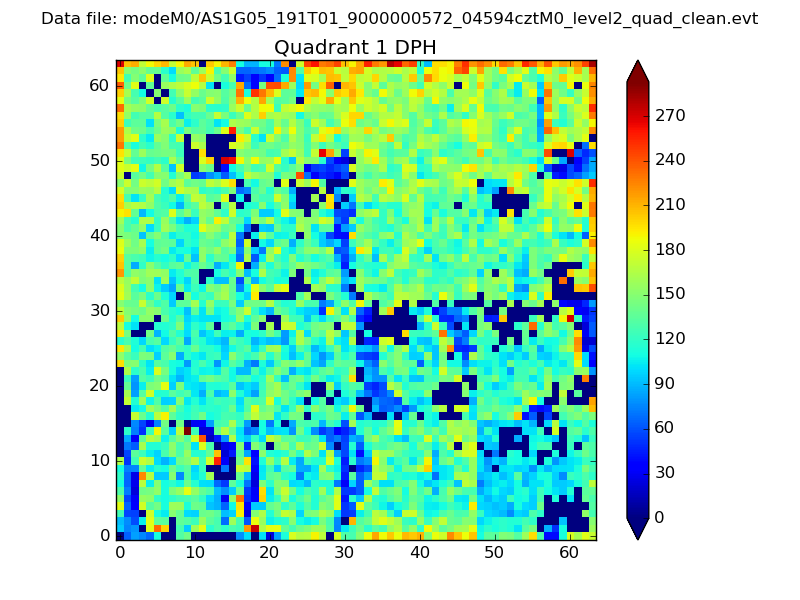 |
Quadrant B |
|---|---|---|---|
| Quadrant D | 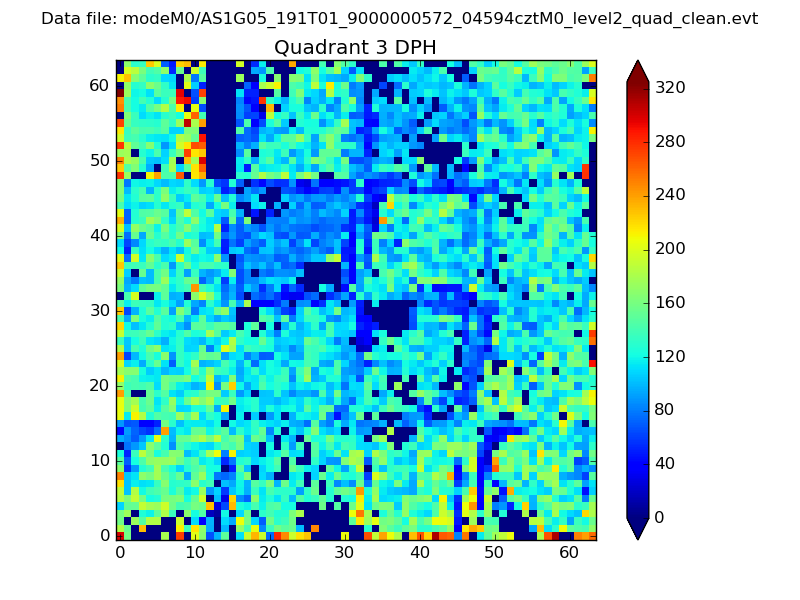 |
 |
Quadrant C |
| Plot type | Count rate plots | Images |
|---|---|---|
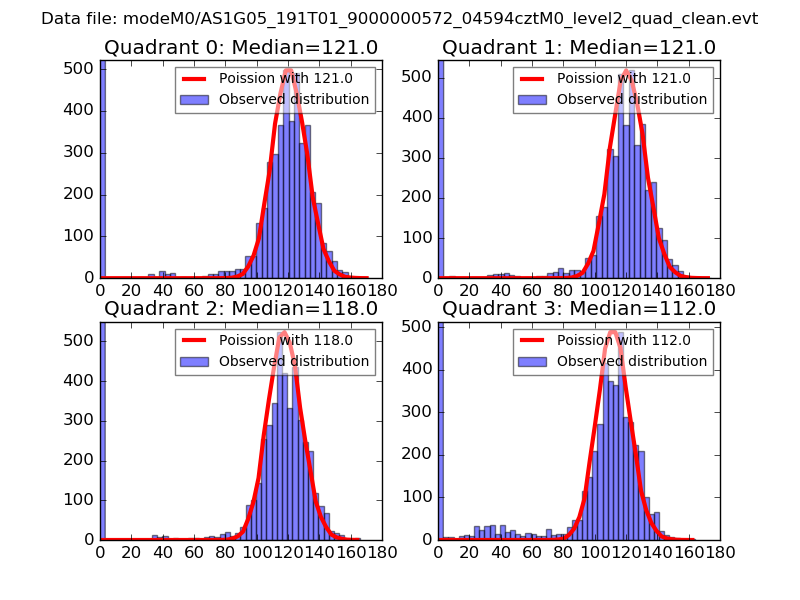
| Comparison with Poisson distribution Blue bars denote a histogram of data divided into 1 sec bins. Red curve is a Poisson curve with rate = median count rate of data. |
 |
 |
| Quadrant-wise count rates Data is divided into 100 sec bins |
 |
|
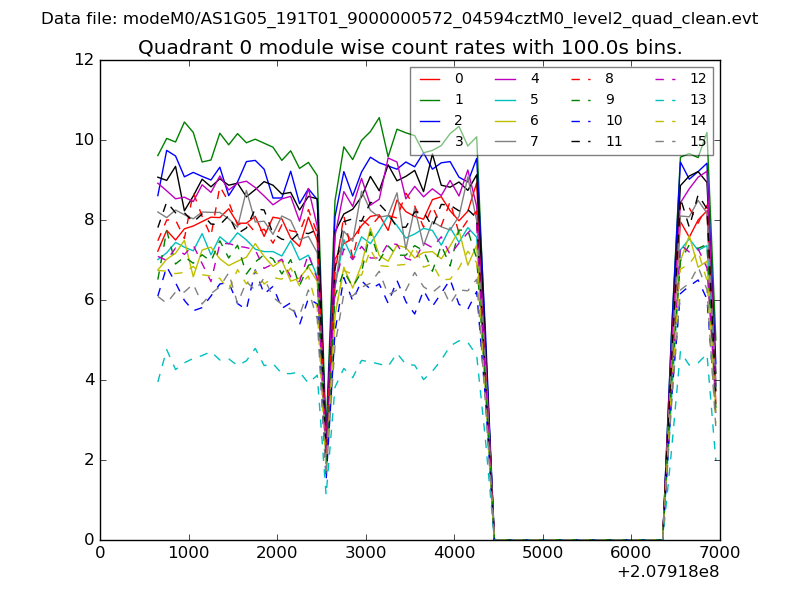
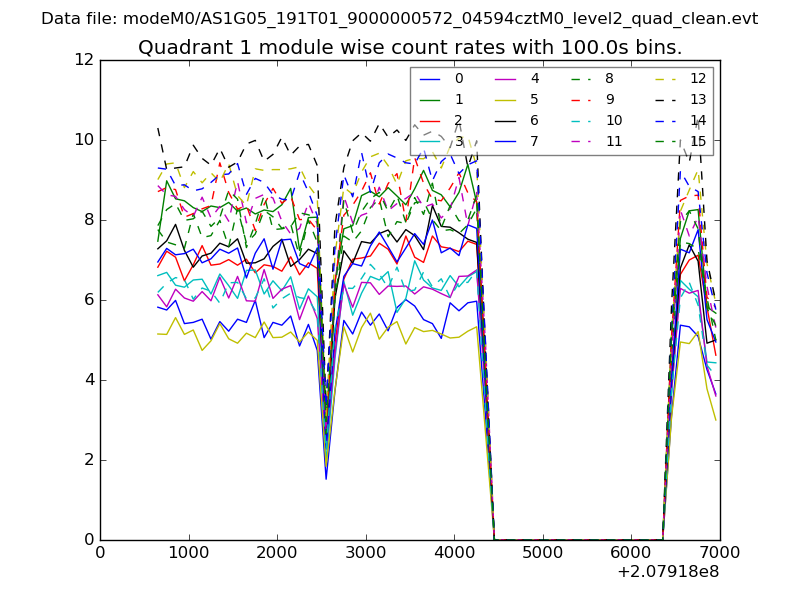
| Module-wise count rates for Quadrant A Data is divided into 100 sec bins |
 |
 |
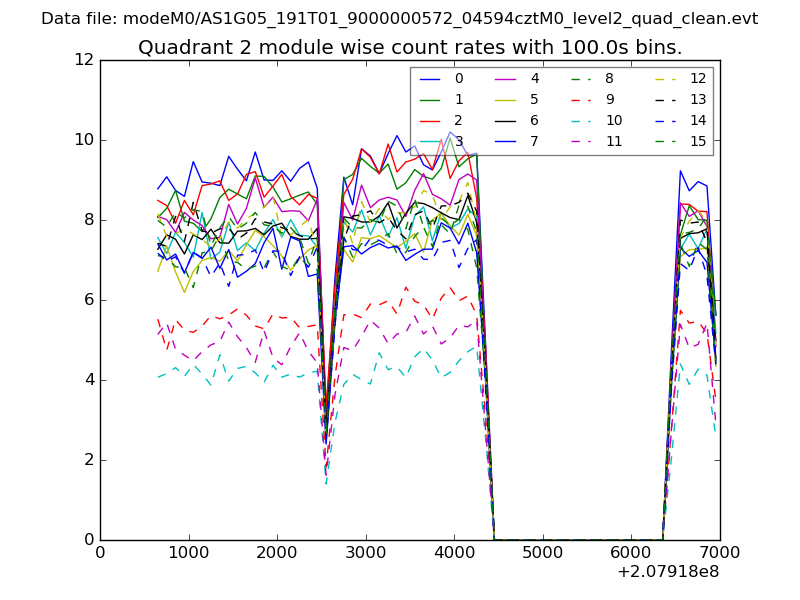
| Module-wise count rates for Quadrant B Data is divided into 100 sec bins |
 |
 |
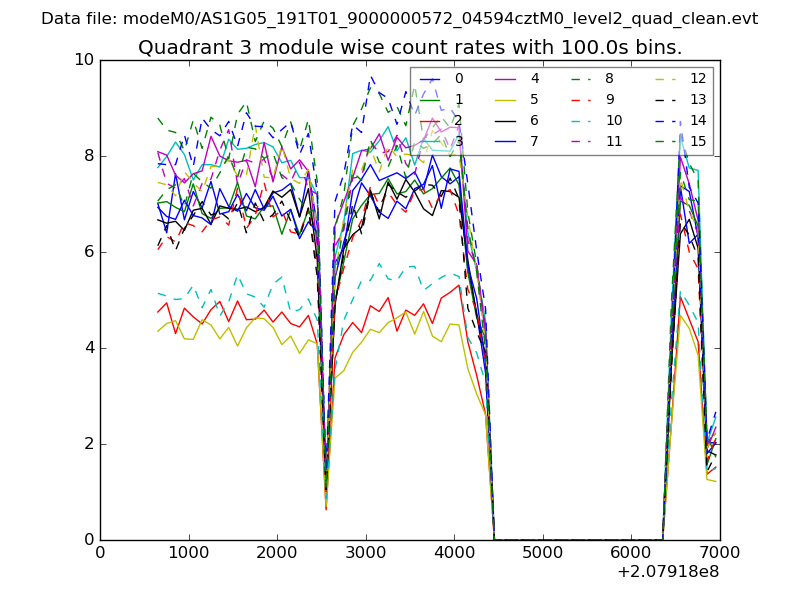
| Module-wise count rates for Quadrant C Data is divided into 100 sec bins |
 |
 |
| Module-wise count rates for Quadrant D Data is divided into 100 sec bins |
 |
 |
| Parameter | Plot |
|---|---|
| CZT HV Monitor | 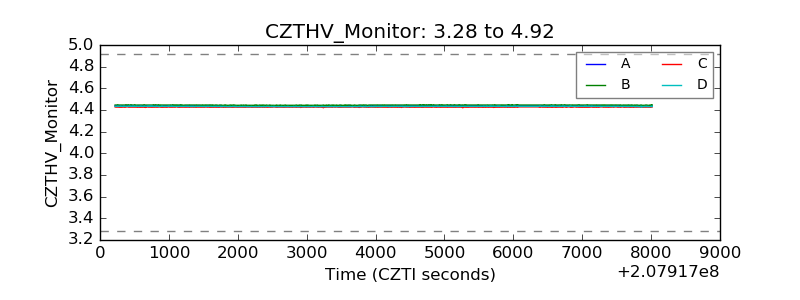 |
| D_VDD | 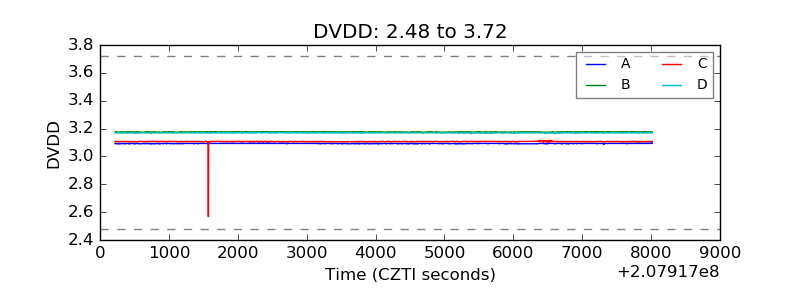 |
| Temperature 1 | 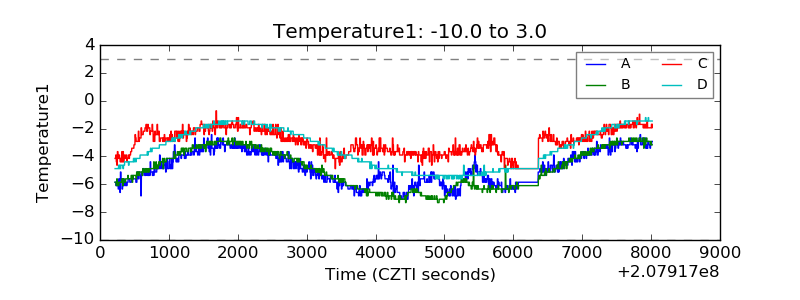 |
| Veto HV Monitor | 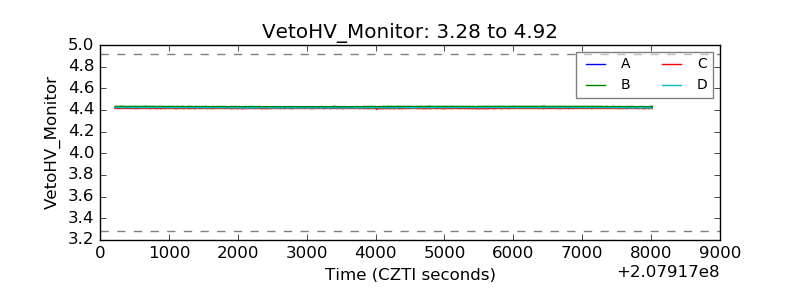 |
| Veto LLD | 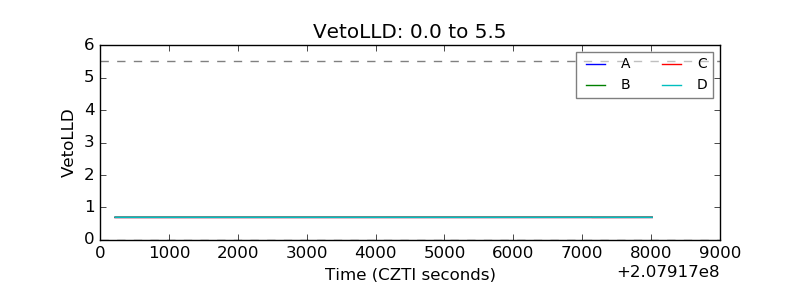 |
| Alpha Counter | 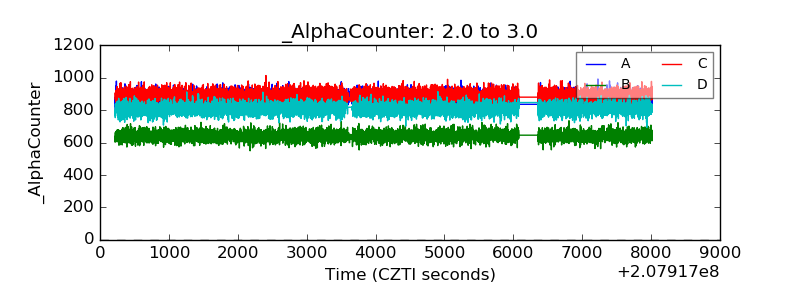 |
| _CPM_Rate | 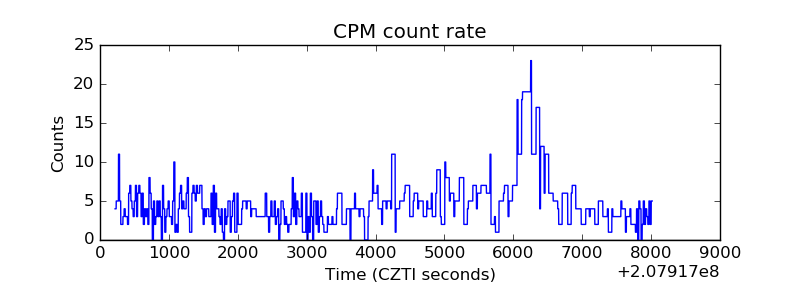 |
| CZT Counter | 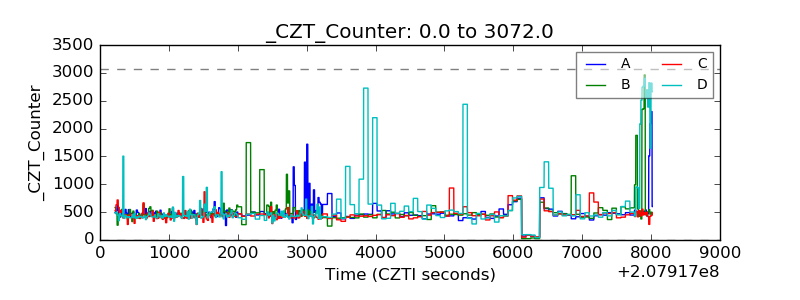 |
| +2.5 Volts monitor |  |
| +5 Volts monitor |  |
| _ROLL_ROT | 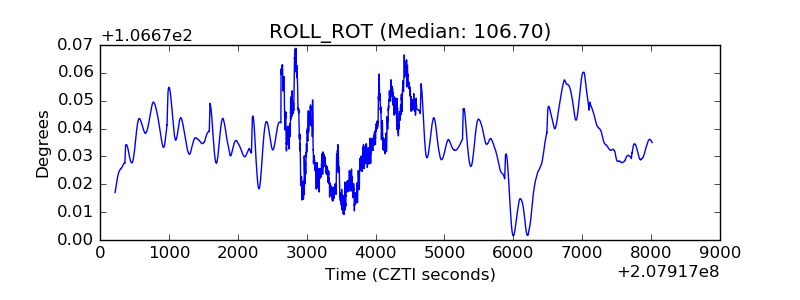 |
| _Roll_DEC | 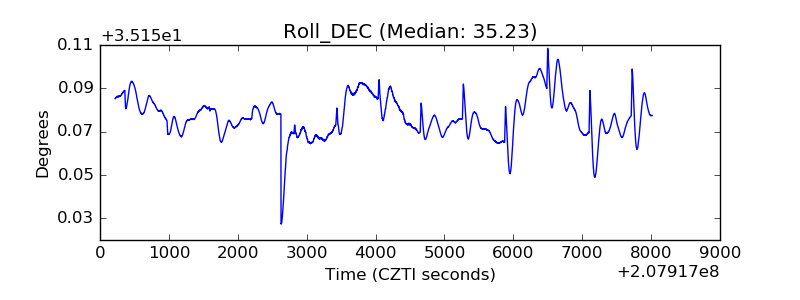 |
| _Roll_RA | 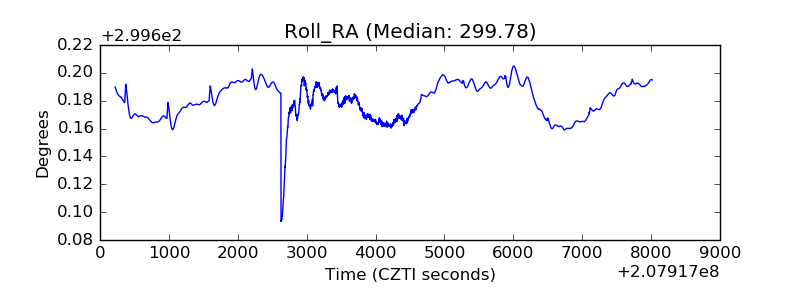 |
| Veto Counter | 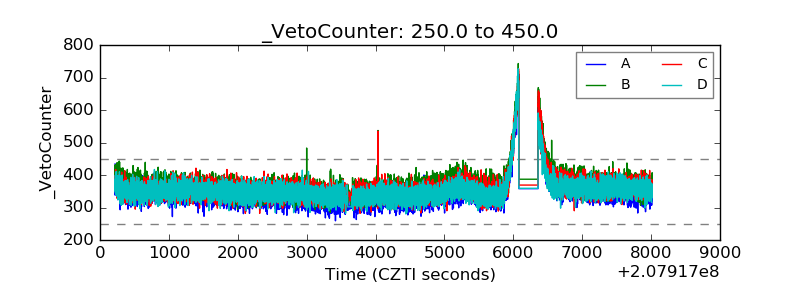 |