| Param | Original file | Final file |
|---|---|---|
| Filename | modeM0/AS1G05_191T01_9000000572_04596cztM0_level2.evt | modeM0/AS1G05_191T01_9000000572_04596cztM0_level2_quad_clean.evt |
| Size (bytes) | 10,831,680 | 1,154,880 |
| Size | 10.3 MB | 1.1 MB |
| Events in quadrant A | 75,454 | 4,251 |
| Events in quadrant B | 81,483 | 4,558 |
| Events in quadrant C | 70,361 | 3,591 |
| Events in quadrant D | 87,754 | 3,993 |
| Mode M9 | |||
|---|---|---|---|
| Quadrant | BADHDUFLAG | Total packets | Discarded packets |
| A | 1 | 224764499168 | 0 |
| B | 1 | -1 | -1 |
| C | 1 | -1 | -1 |
| D | 1 | -1 | -1 |
| Mode M0 | |||
|---|---|---|---|
| Quadrant | BADHDUFLAG | Total packets | Discarded packets |
| A | 0 | 475 | 176 |
| B | 0 | 493 | 168 |
| C | 0 | 450 | 174 |
| D | 0 | 547 | 206 |
| Mode SS | |||
|---|---|---|---|
| Quadrant | BADHDUFLAG | Total packets | Discarded packets |
| A | 0 | 4 | 0 |
| B | 0 | 4 | 0 |
| C | 0 | 4 | 0 |
| D | 0 | 4 | 2 |
| Quadrant | Total seconds | Saturated seconds | Saturation percentage |
|---|---|---|---|
| A | 133 | 1 | 0.751880% |
| B | 137 | 1 | 0.729927% |
| C | 131 | 0 | 0.000000% |
| D | 130 | 1 | 0.769231% |
Noise dominated data is calculated using 1-second bins in cleaned event files. If a bin has >2000 counts, and if more than 50% of those come from <1% of pixels, then it is considered to be noise-dominated and hence unusable.
| Quadrant | # 1 sec bins | Bins with >0 counts | Bins with >2000 counts | High rate bins dominated by noise | Noise dominated (total time) | Noise dominated (detector-on time) | Marked lightcurve |
|---|---|---|---|---|---|---|---|
| A | 152 | 142 | 0 | 0 | 0.00% | 0.00% |  |
| B | 153 | 143 | 0 | 0 | 0.00% | 0.00% | 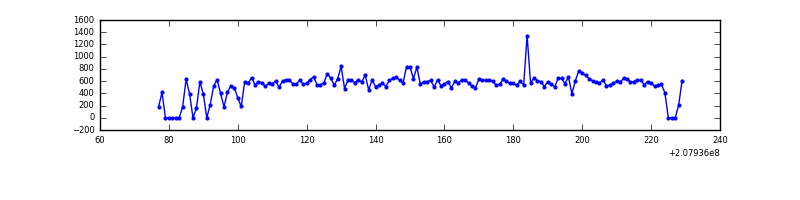 |
| C | 145 | 138 | 0 | 0 | 0.00% | 0.00% | 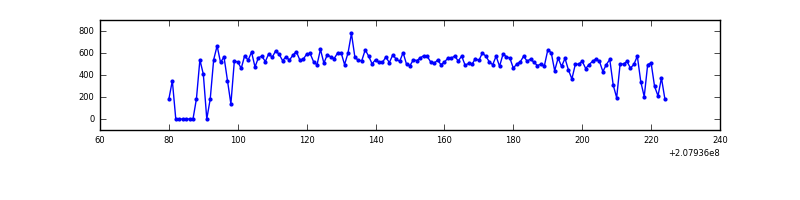 |
| D | 146 | 139 | 0 | 0 | 0.00% | 0.00% | 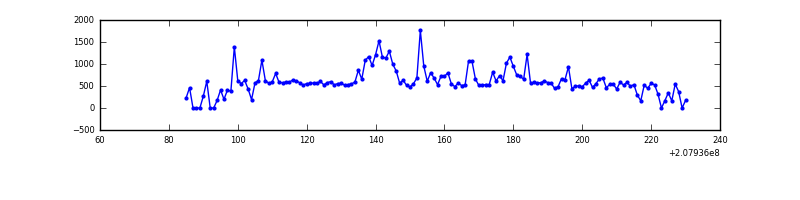 |
Top three noisy pixels from each quadrant. If the there are fewer than three noisy pixels in the level2.evt file, extra rows are filled as -1
| Pixel properties | Quadrant properties | ||||||
|---|---|---|---|---|---|---|---|
| Quadrant | DetID | PixID | Counts | Sigma | Mean | Median | Sigma |
| A | 13 | 14 | 667 | 107.88 | 19 | 18 | 6.0 |
| A | 13 | 11 | 358 | 56.52 | 19 | 18 | 6.0 |
| A | 0 | 226 | 215 | 32.75 | 19 | 18 | 6.0 |
| B | 14 | 167 | 1663 | 282.97 | 19 | 19 | 5.8 |
| B | 4 | 80 | 1030 | 174.01 | 19 | 19 | 5.8 |
| B | 10 | 246 | 918 | 154.74 | 19 | 19 | 5.8 |
| C | 5 | 250 | 211 | 31.71 | 17 | 17 | 6.1 |
| C | 13 | 61 | 133 | 18.96 | 17 | 17 | 6.1 |
| C | 3 | 14 | 61 | 7.19 | 17 | 17 | 6.1 |
| D | 2 | 136 | 11369 | 1861.47 | 17 | 16 | 6.1 |
| D | 12 | 217 | 6440 | 1053.3 | 17 | 16 | 6.1 |
| D | 13 | 235 | 1074 | 173.47 | 17 | 16 | 6.1 |
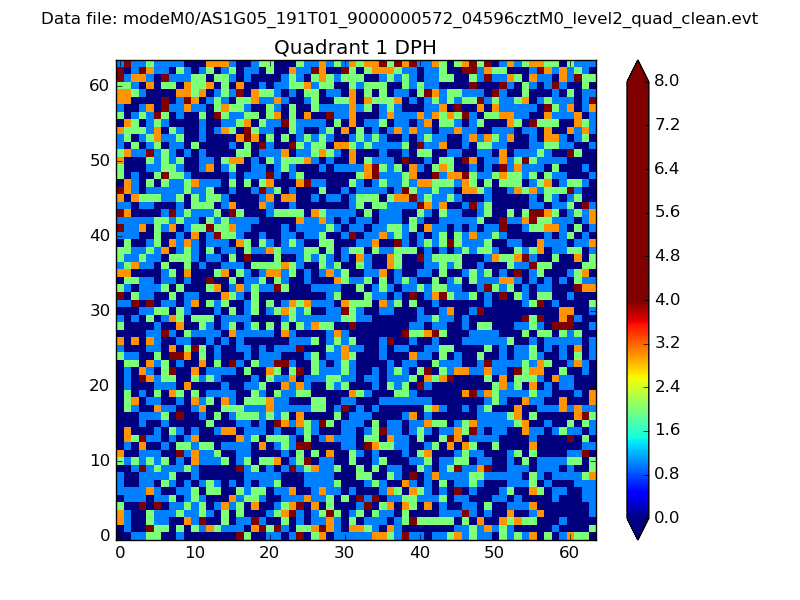
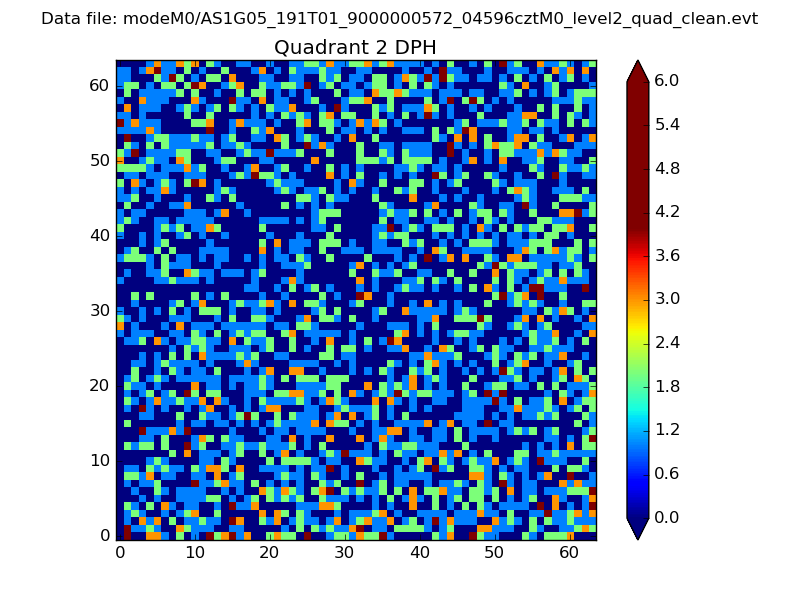
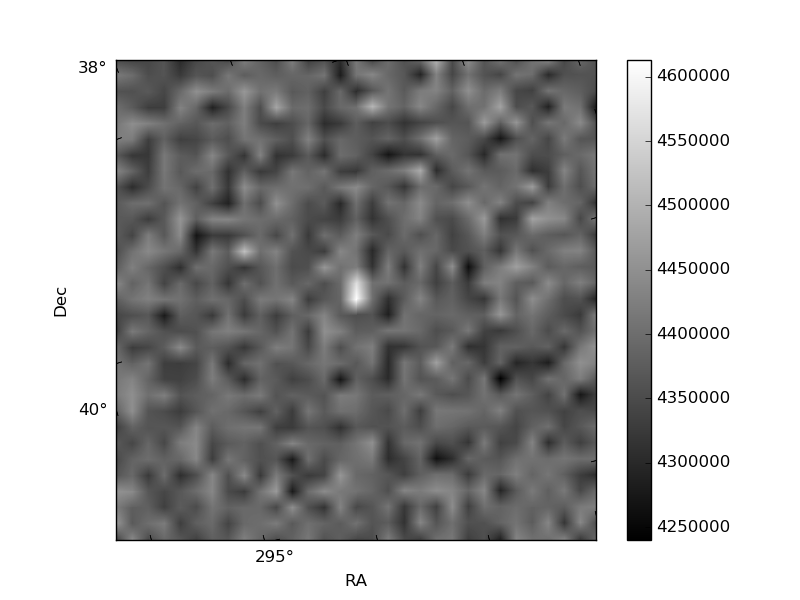
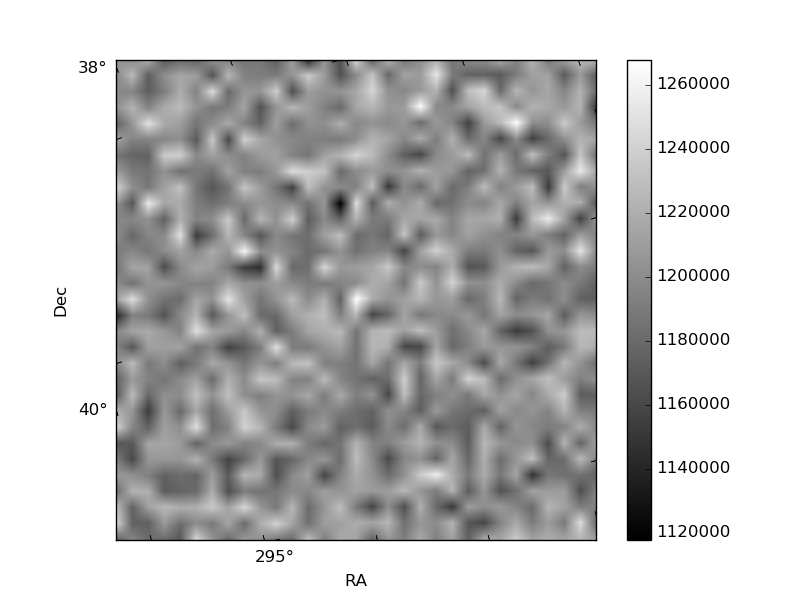
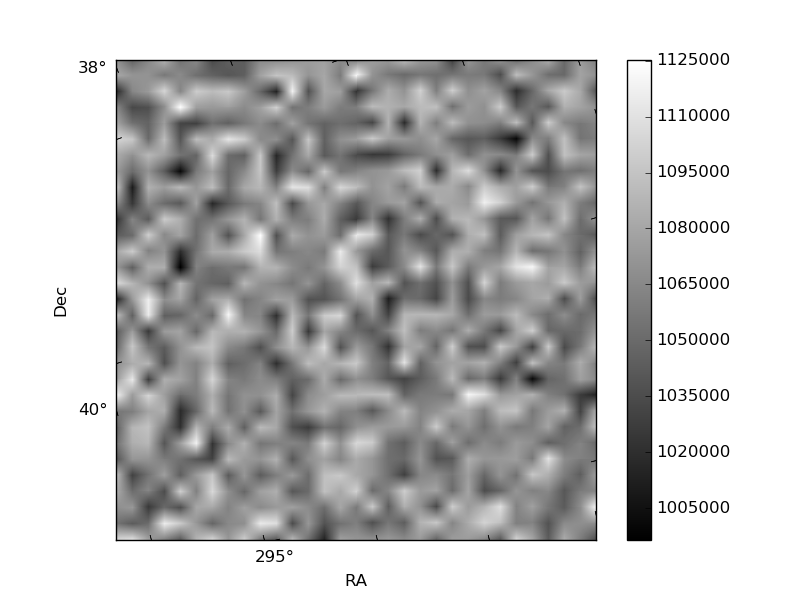
Histogram calculated using DETX and DETY for each event in the final _common_clean file
| Quadrant A | 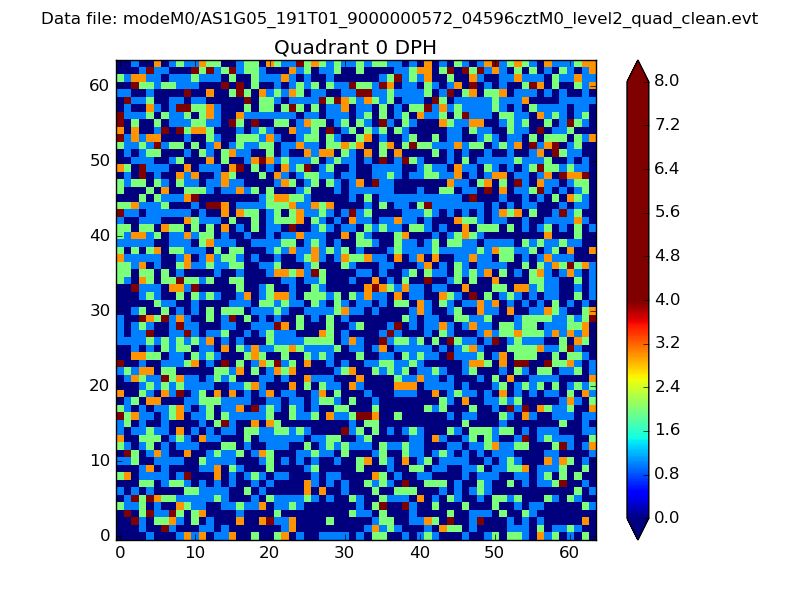 |
 |
Quadrant B |
|---|---|---|---|
| Quadrant D | 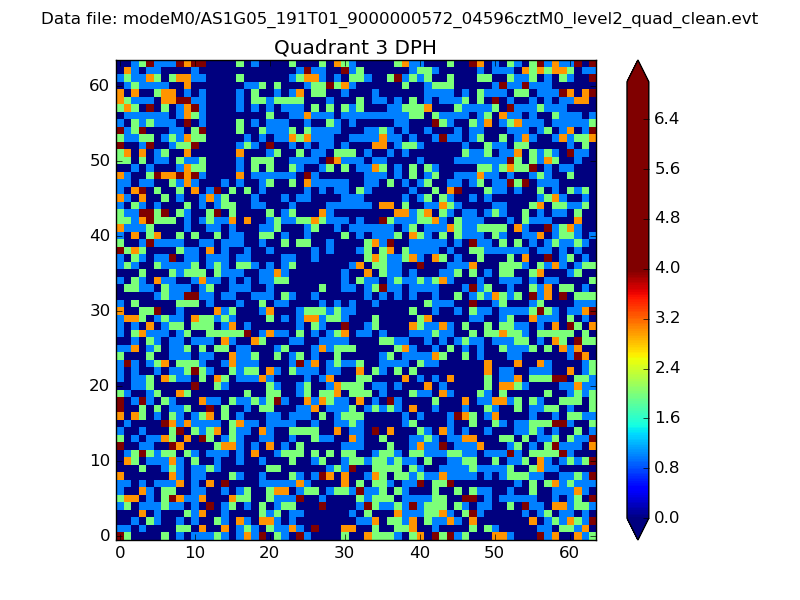 |
 |
Quadrant C |
| Plot type | Count rate plots | Images |
|---|---|---|
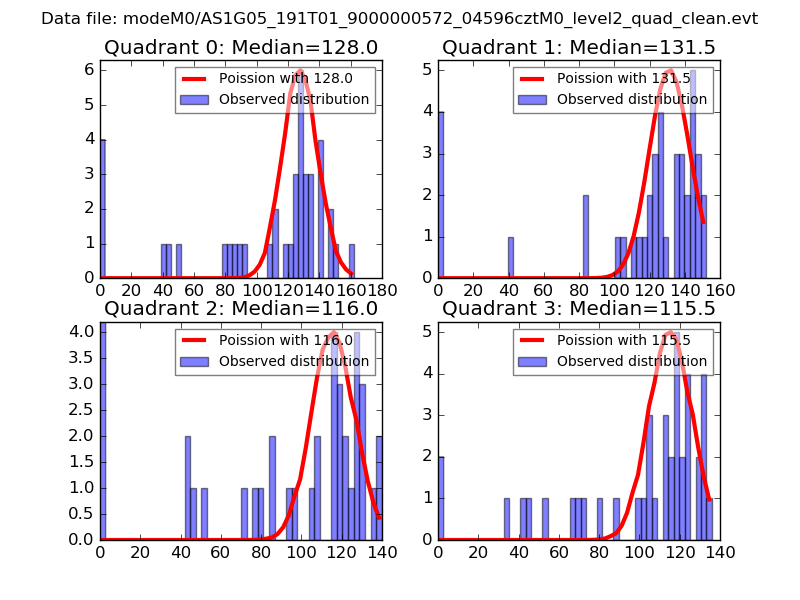
| Comparison with Poisson distribution Blue bars denote a histogram of data divided into 1 sec bins. Red curve is a Poisson curve with rate = median count rate of data. |
 |
 |
| Quadrant-wise count rates Data is divided into 100 sec bins |
 |
|
| Module-wise count rates for Quadrant A Data is divided into 100 sec bins |
 |
 |
| Module-wise count rates for Quadrant B Data is divided into 100 sec bins |
 |
 |
| Module-wise count rates for Quadrant C Data is divided into 100 sec bins |
 |
 |
| Module-wise count rates for Quadrant D Data is divided into 100 sec bins |
 |
 |
| Parameter | Plot |
|---|---|
| CZT HV Monitor | 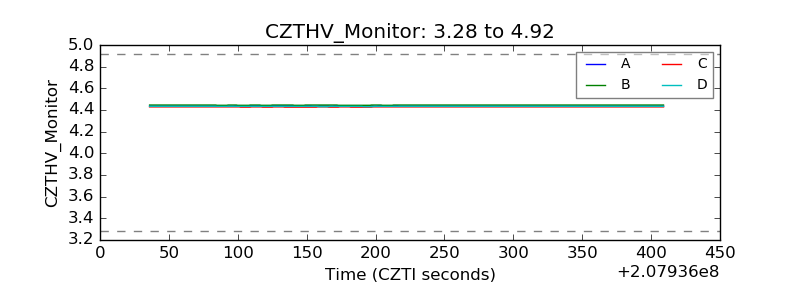 |
| D_VDD | 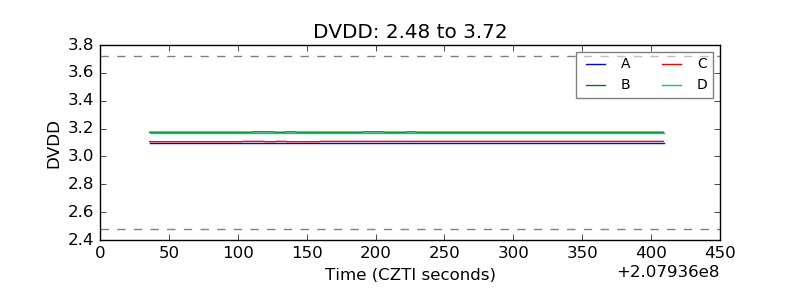 |
| Temperature 1 | 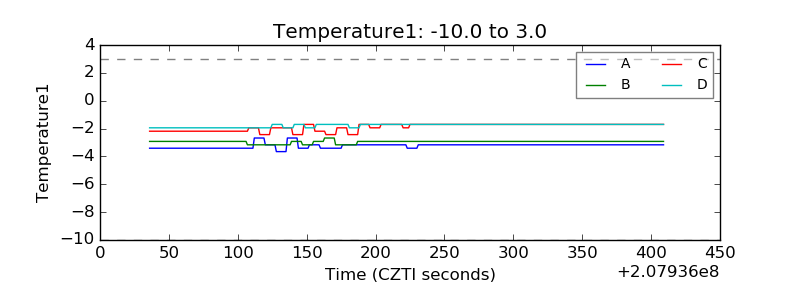 |
| Veto HV Monitor | 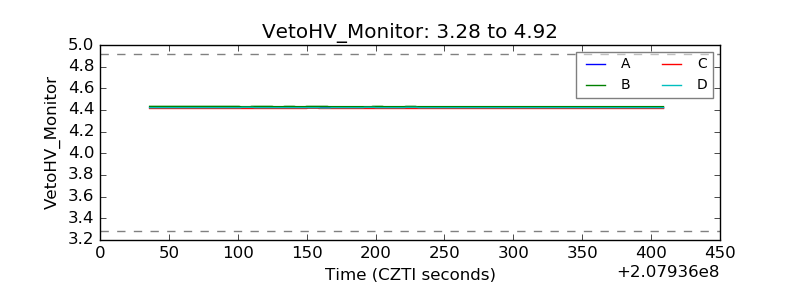 |
| Veto LLD | 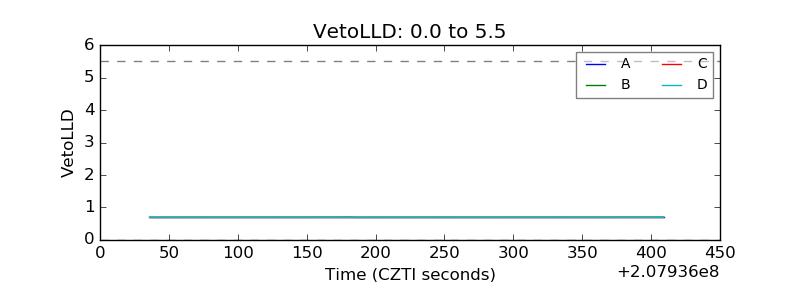 |
| Alpha Counter | 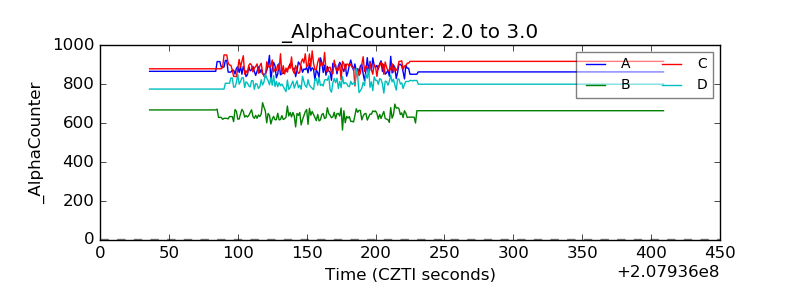 |
| _CPM_Rate | 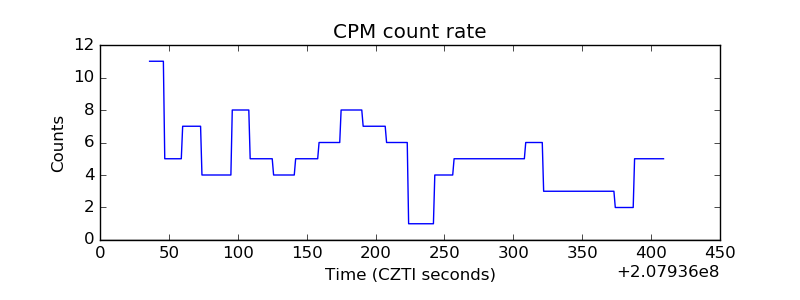 |
| CZT Counter | 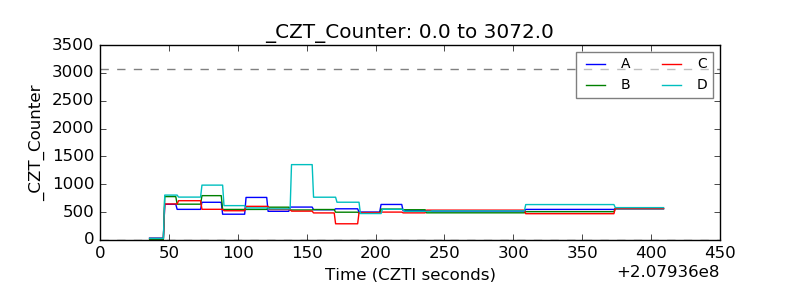 |
| +2.5 Volts monitor |  |
| +5 Volts monitor |  |
| _ROLL_ROT | 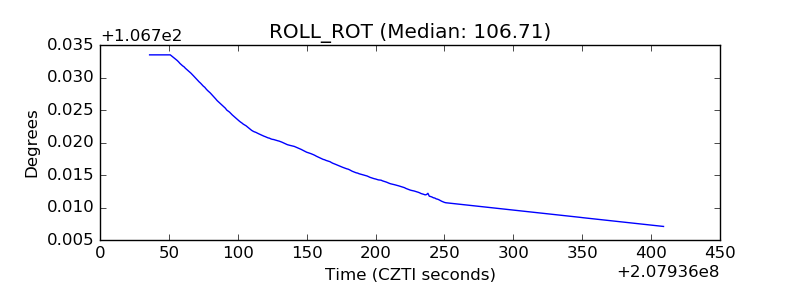 |
| _Roll_DEC | 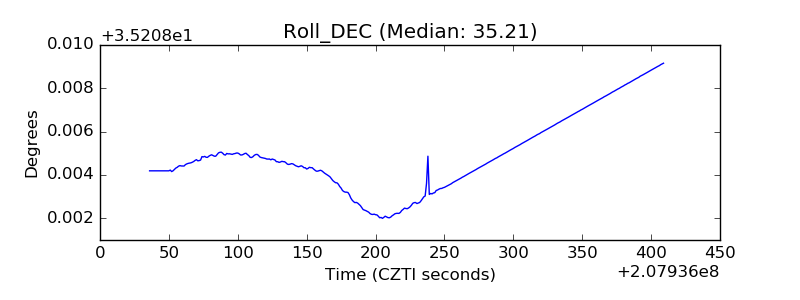 |
| _Roll_RA | 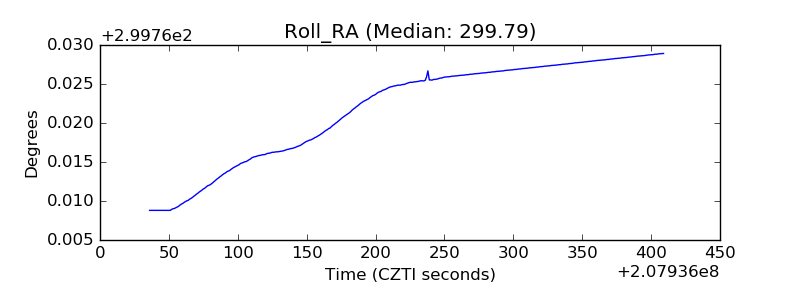 |
| Veto Counter | 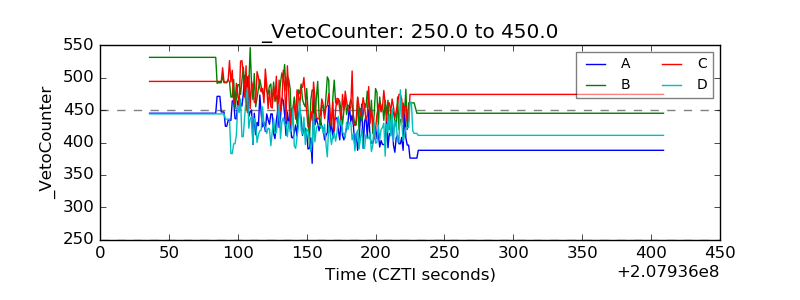 |