| Param | Original file | Final file |
|---|---|---|
| Filename | modeM0/AS1G05_191T01_9000000572_04597cztM0_level2.evt | modeM0/AS1G05_191T01_9000000572_04597cztM0_level2_quad_clean.evt |
| Size (bytes) | 1,683,884,160 | 218,802,240 |
| Size | 1.6 GB | 208.7 MB |
| Events in quadrant A | 8,296,106 | 1,514,136 |
| Events in quadrant B | 8,650,471 | 1,508,028 |
| Events in quadrant C | 7,998,709 | 1,488,694 |
| Events in quadrant D | 24,913,114 | 950,227 |
| Mode M9 | |||
|---|---|---|---|
| Quadrant | BADHDUFLAG | Total packets | Discarded packets |
| A | 0 | 21 | 0 |
| B | 0 | 21 | 0 |
| C | 0 | 21 | 0 |
| D | 0 | 21 | 0 |
| Mode M0 | |||
|---|---|---|---|
| Quadrant | BADHDUFLAG | Total packets | Discarded packets |
| A | 0 | 35772 | 102 |
| B | 0 | 36832 | 104 |
| C | 0 | 35592 | 67 |
| D | 0 | 86018 | 711 |
| Mode SS | |||
|---|---|---|---|
| Quadrant | BADHDUFLAG | Total packets | Discarded packets |
| A | 0 | 346 | 2 |
| B | 0 | 346 | 0 |
| C | 0 | 346 | 0 |
| D | 0 | 346 | 0 |
| Quadrant | Total seconds | Saturated seconds | Saturation percentage |
|---|---|---|---|
| A | 16870 | 231 | 1.369295% |
| B | 16873 | 192 | 1.137913% |
| C | 16886 | 160 | 0.947530% |
| D | 16820 | 7337 | 43.620690% |
Noise dominated data is calculated using 1-second bins in cleaned event files. If a bin has >2000 counts, and if more than 50% of those come from <1% of pixels, then it is considered to be noise-dominated and hence unusable.
| Quadrant | # 1 sec bins | Bins with >0 counts | Bins with >2000 counts | High rate bins dominated by noise | Noise dominated (total time) | Noise dominated (detector-on time) | Marked lightcurve |
|---|---|---|---|---|---|---|---|
| A | 19018 | 16919 | 77 | 77 | 0.40% | 0.46% | 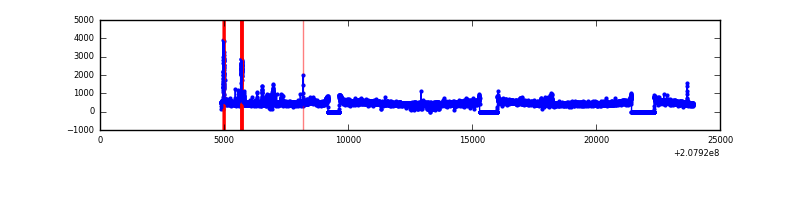 |
| B | 19018 | 16919 | 40 | 40 | 0.21% | 0.24% | 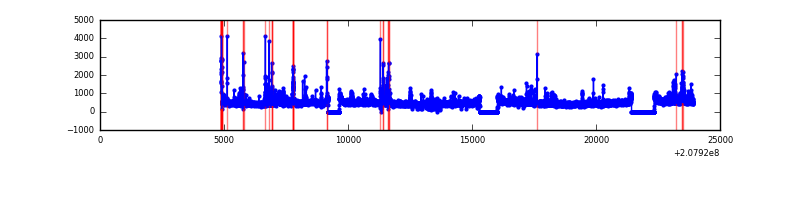 |
| C | 19018 | 16920 | 9 | 9 | 0.05% | 0.05% | 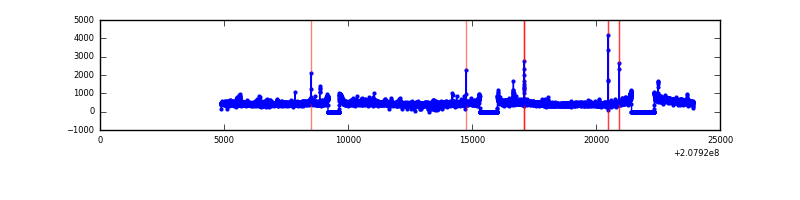 |
| D | 19018 | 16858 | 6516 | 6516 | 34.26% | 38.65% | 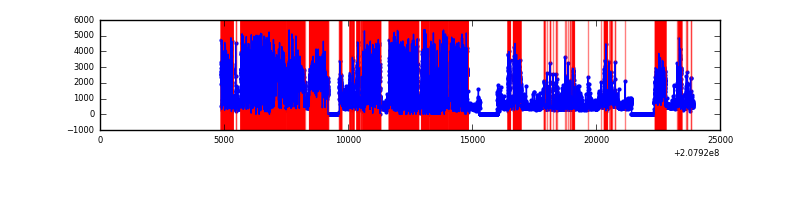 |
Top three noisy pixels from each quadrant. If the there are fewer than three noisy pixels in the level2.evt file, extra rows are filled as -1
| Pixel properties | Quadrant properties | ||||||
|---|---|---|---|---|---|---|---|
| Quadrant | DetID | PixID | Counts | Sigma | Mean | Median | Sigma |
| A | 15 | 174 | 349940 | 853.84 | 2001 | 1965 | 407.5 |
| A | 13 | 14 | 137684 | 333.02 | 2001 | 1965 | 407.5 |
| A | 13 | 11 | 41983 | 98.19 | 2001 | 1965 | 407.5 |
| B | 10 | 16 | 372646 | 968.1 | 2016 | 1975 | 382.9 |
| B | 2 | 249 | 126473 | 325.16 | 2016 | 1975 | 382.9 |
| B | 14 | 167 | 113572 | 291.46 | 2016 | 1975 | 382.9 |
| C | 14 | 48 | 254199 | 555.68 | 1955 | 1973 | 453.9 |
| C | 9 | 247 | 36190 | 75.38 | 1955 | 1973 | 453.9 |
| C | 14 | 67 | 22119 | 44.38 | 1955 | 1973 | 453.9 |
| D | 13 | 235 | 18593765 | 53435.61 | 1441 | 1402 | 347.9 |
| D | 10 | 15 | 226049 | 645.65 | 1441 | 1402 | 347.9 |
| D | 7 | 223 | 204965 | 585.05 | 1441 | 1402 | 347.9 |
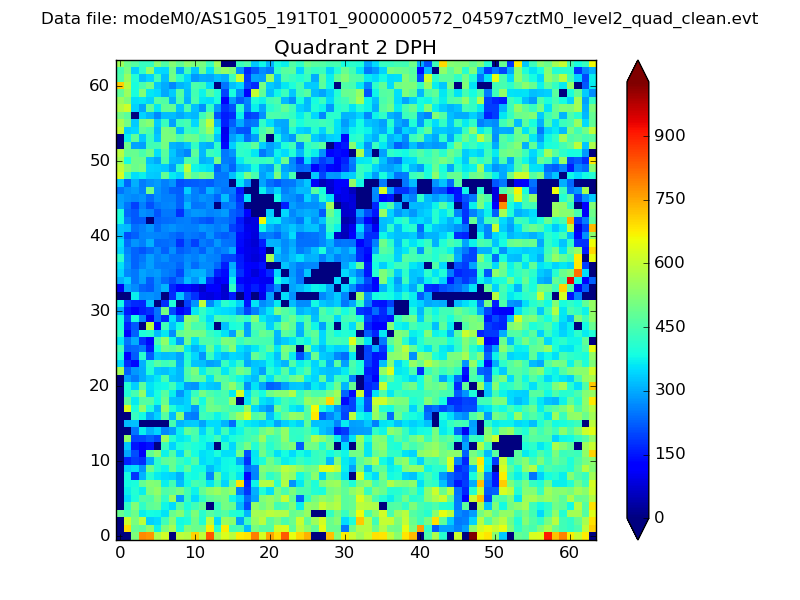
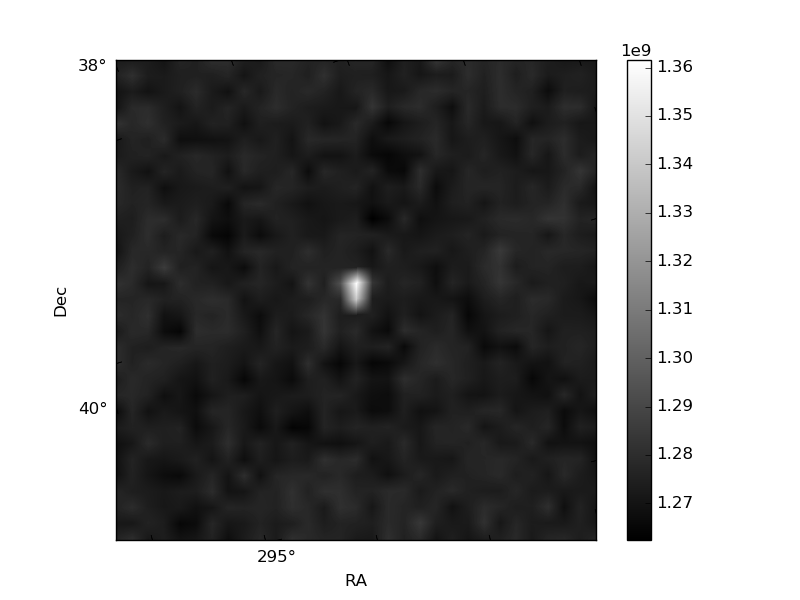
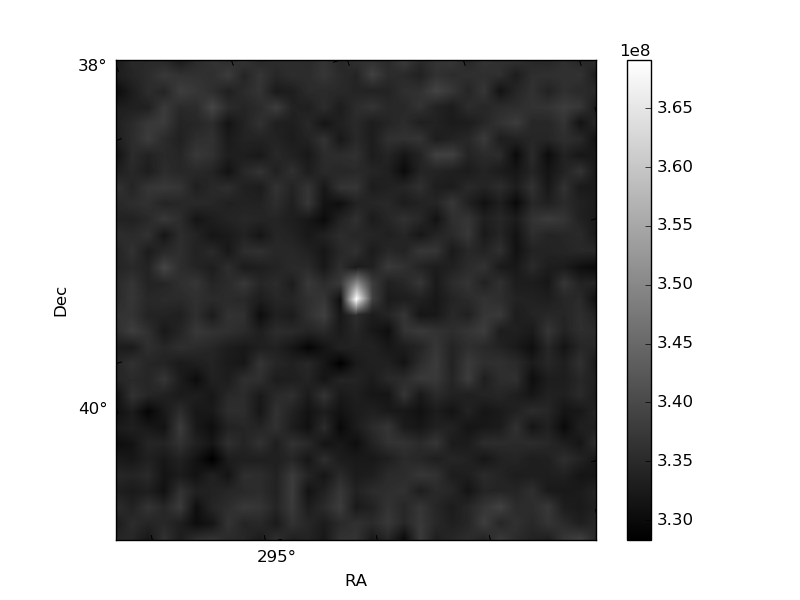
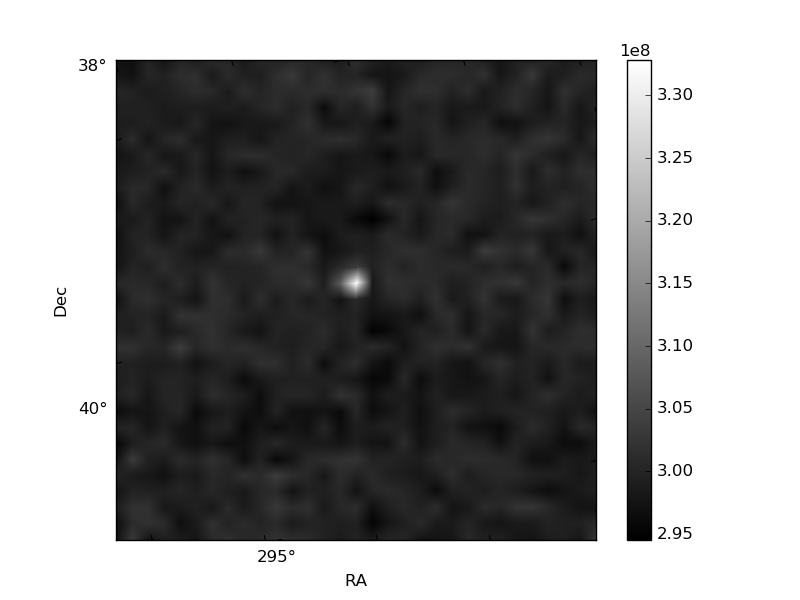
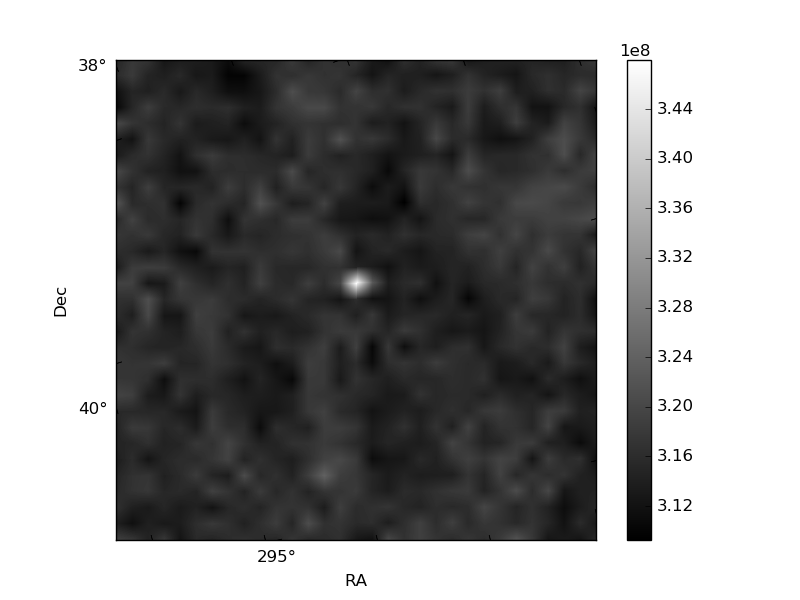
Histogram calculated using DETX and DETY for each event in the final _common_clean file
| Quadrant A | 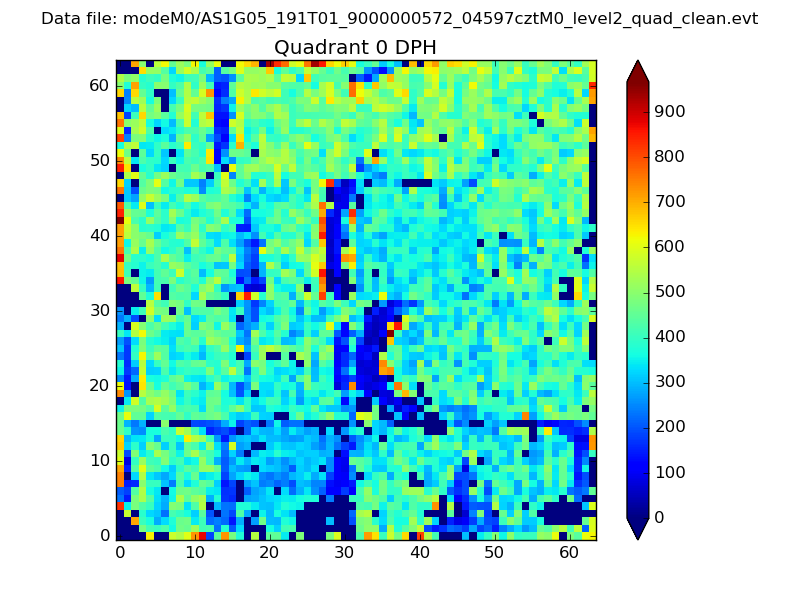 |
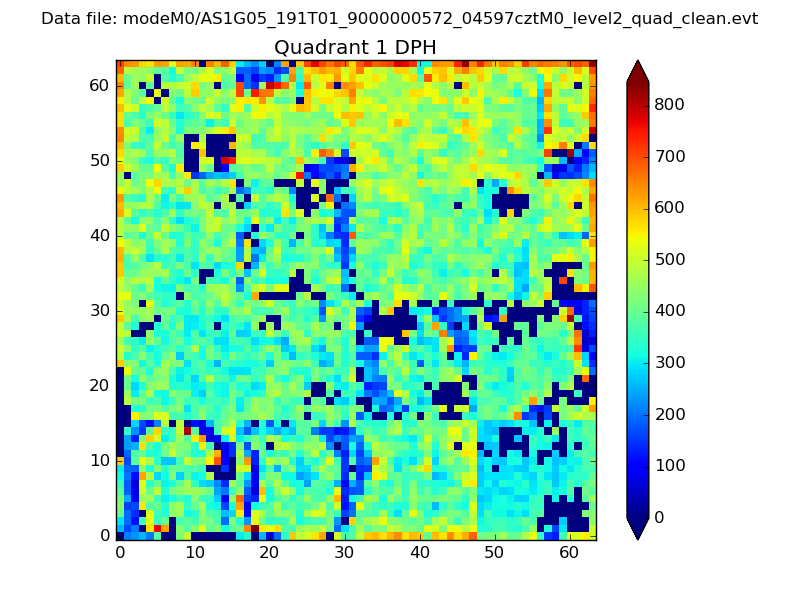 |
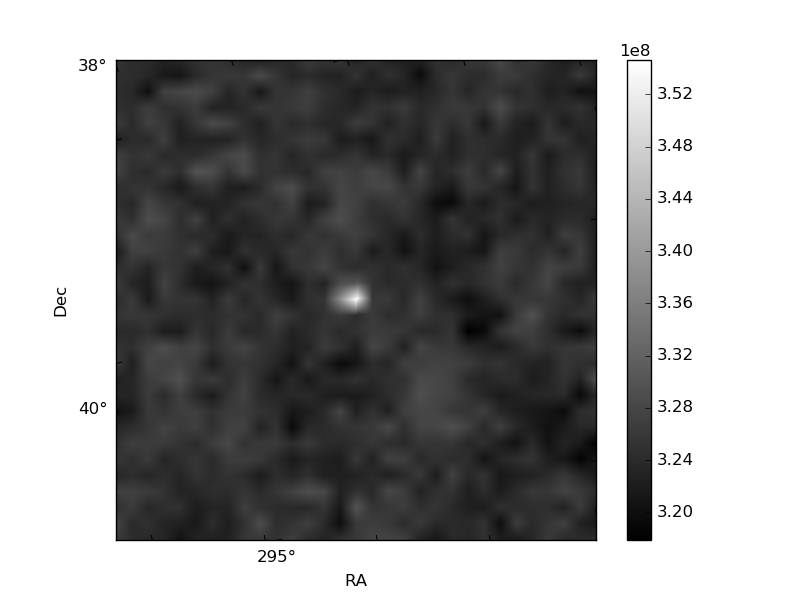
Quadrant B |
|---|---|---|---|
| Quadrant D | 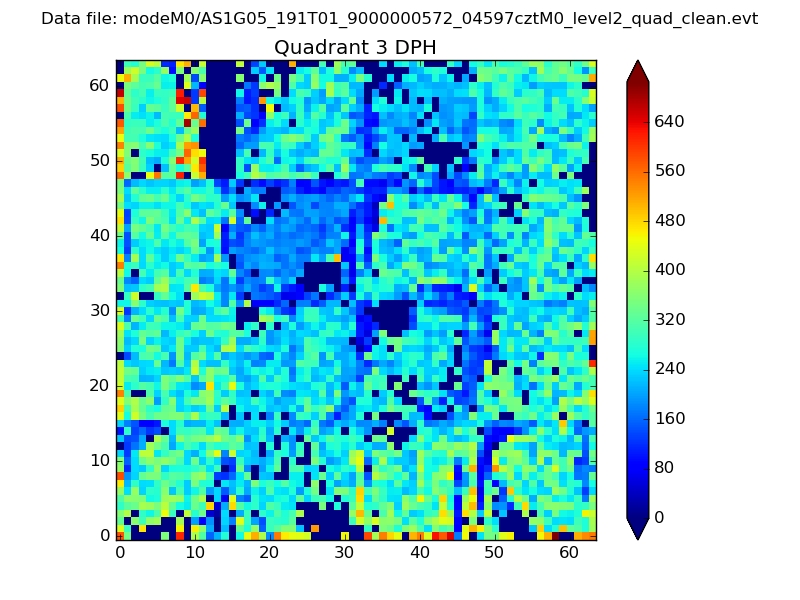 |
 |
Quadrant C |
| Plot type | Count rate plots | Images |
|---|---|---|
| Comparison with Poisson distribution Blue bars denote a histogram of data divided into 1 sec bins. Red curve is a Poisson curve with rate = median count rate of data. |
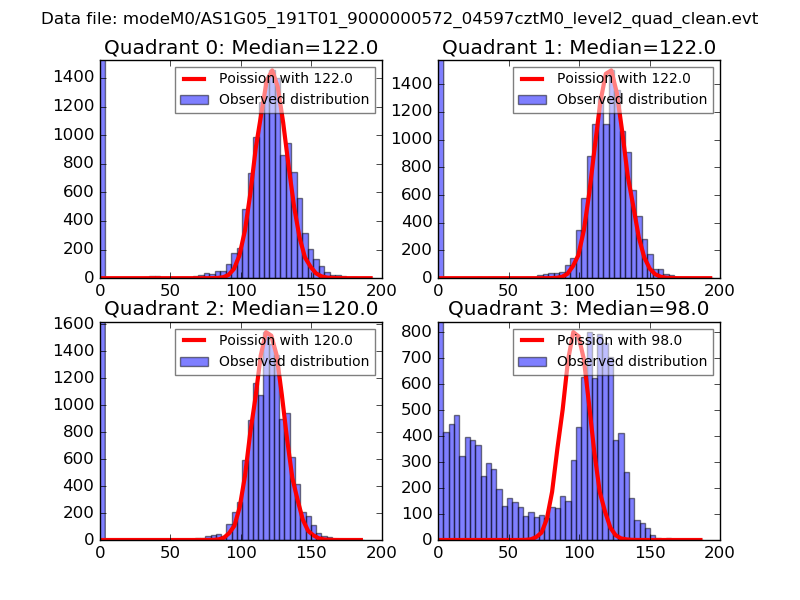 |
 |
| Quadrant-wise count rates Data is divided into 100 sec bins |
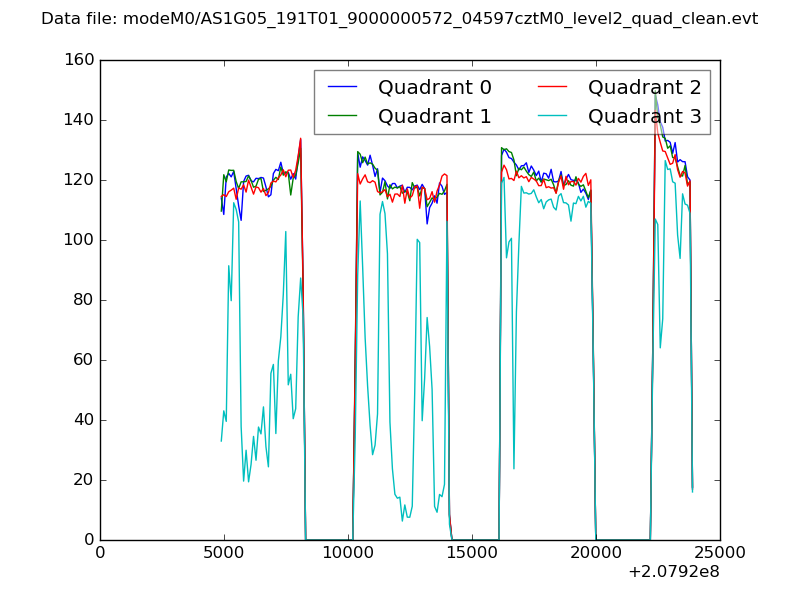 |
|
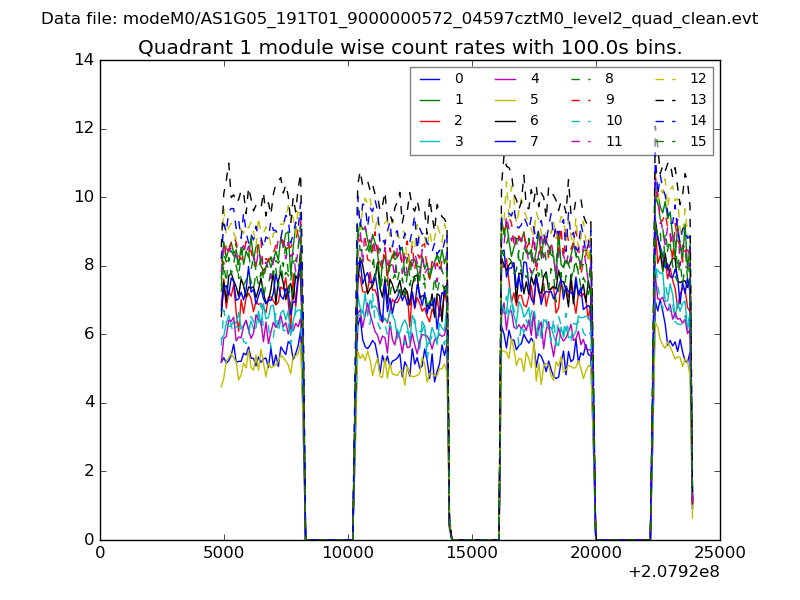
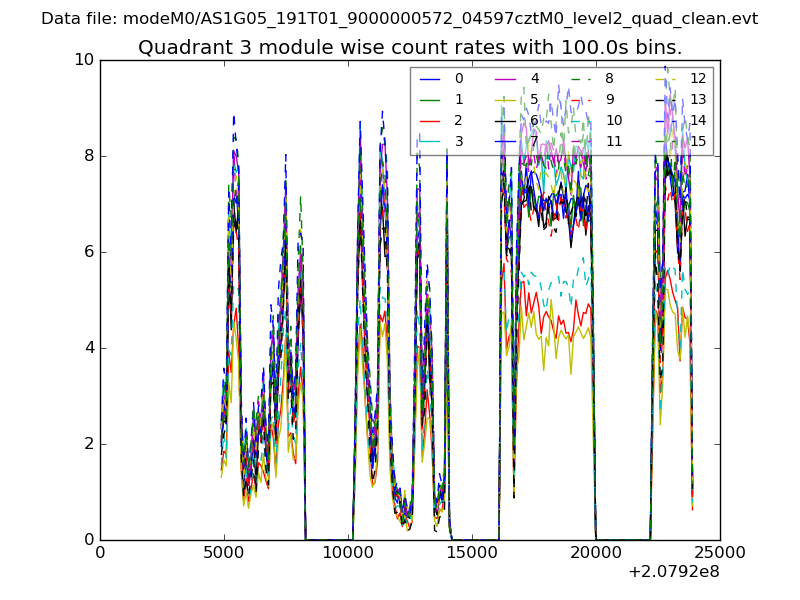
| Module-wise count rates for Quadrant A Data is divided into 100 sec bins |
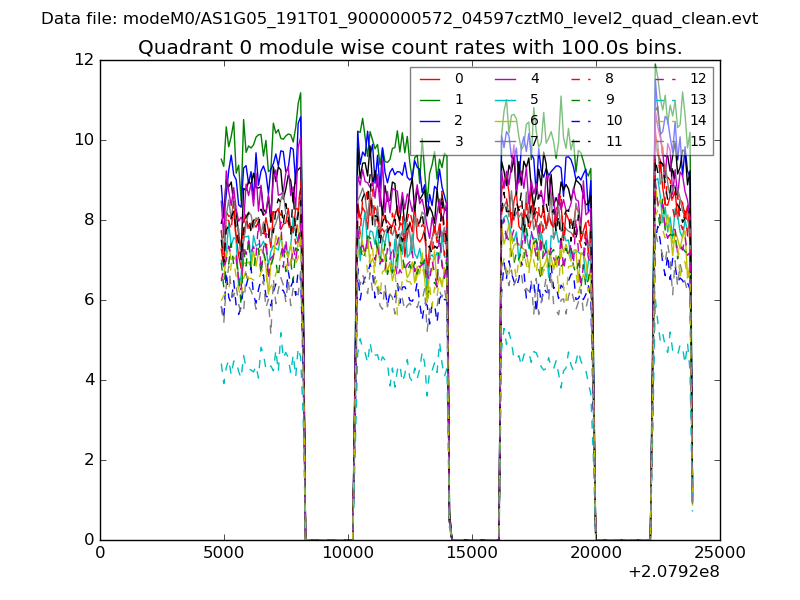 |
 |
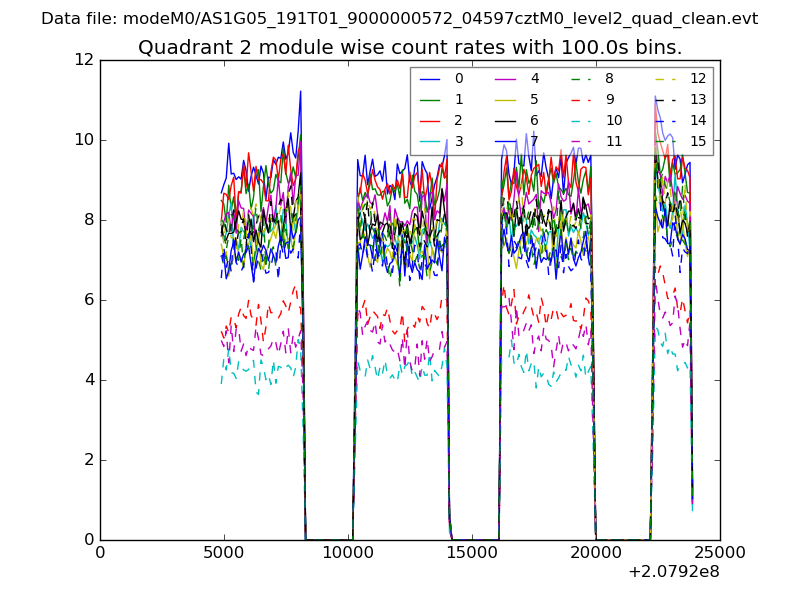
| Module-wise count rates for Quadrant B Data is divided into 100 sec bins |
 |
 |
| Module-wise count rates for Quadrant C Data is divided into 100 sec bins |
 |
 |
| Module-wise count rates for Quadrant D Data is divided into 100 sec bins |
 |
 |
| Parameter | Plot |
|---|---|
| CZT HV Monitor | 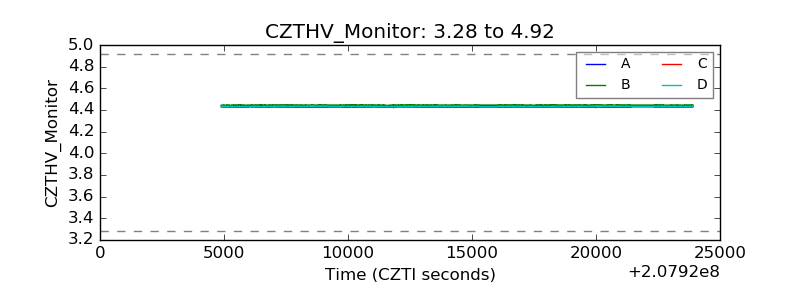 |
| D_VDD | 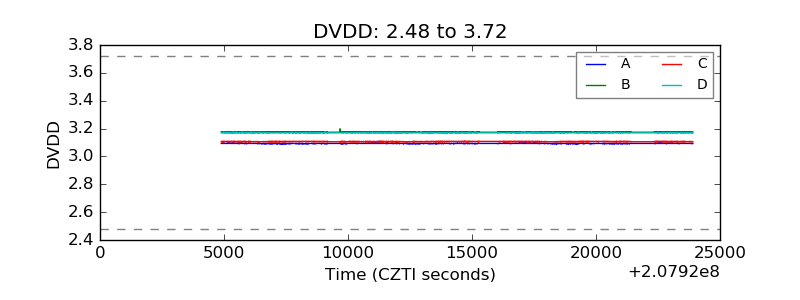 |
| Temperature 1 | 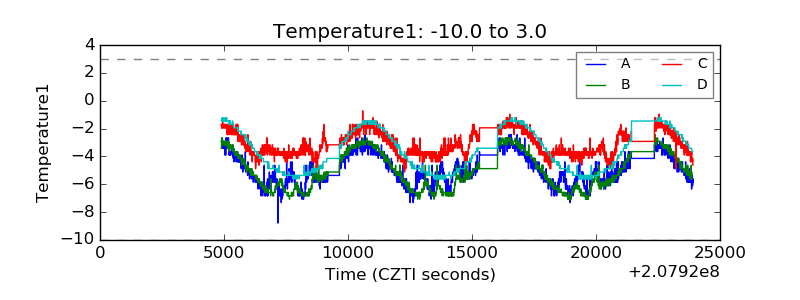 |
| Veto HV Monitor |  |
| Veto LLD | 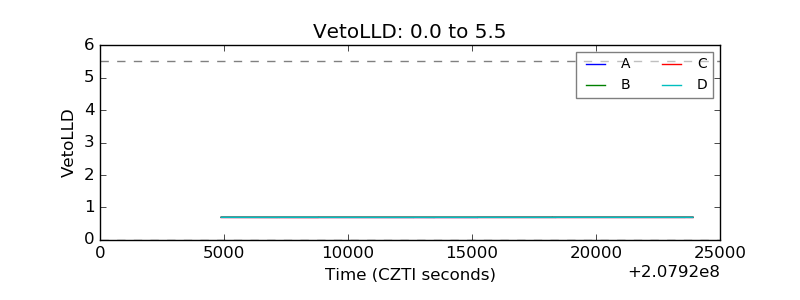 |
| Alpha Counter | 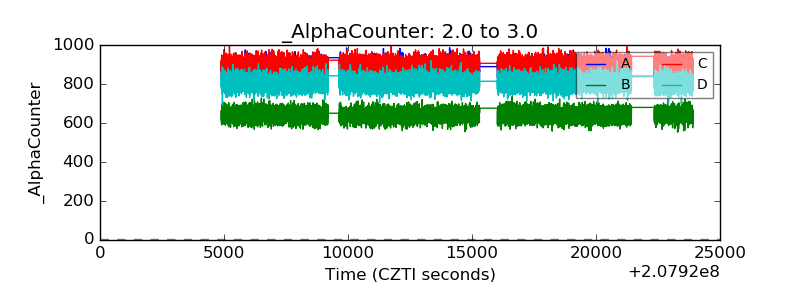 |
| _CPM_Rate | 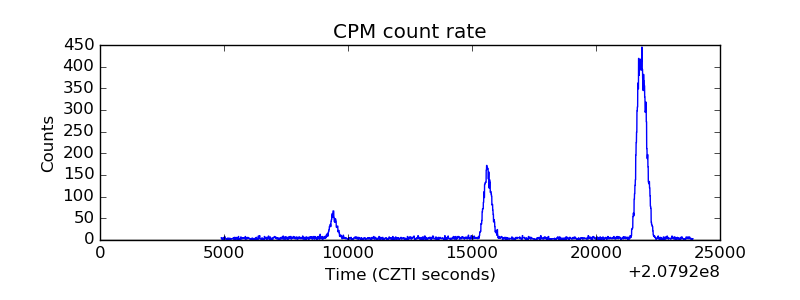 |
| CZT Counter | 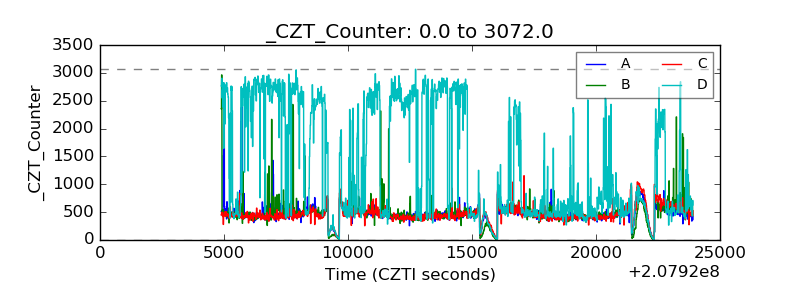 |
| +2.5 Volts monitor |  |
| +5 Volts monitor |  |
| _ROLL_ROT | 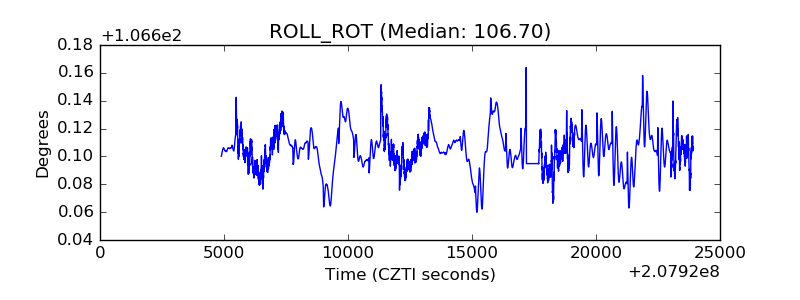 |
| _Roll_DEC | 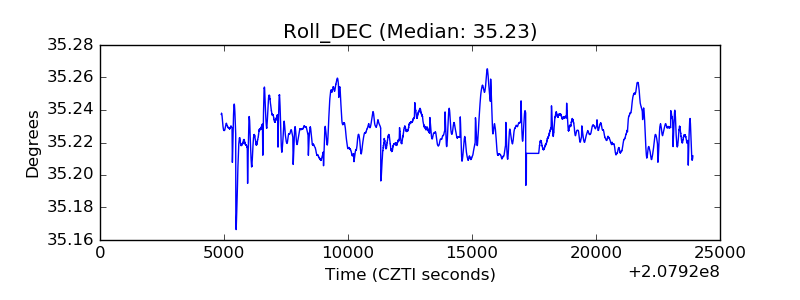 |
| _Roll_RA | 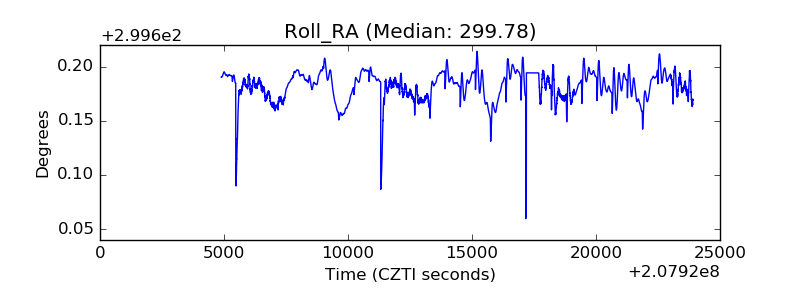 |
| Veto Counter | 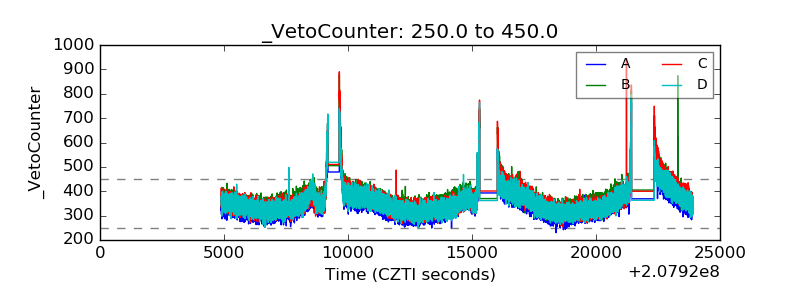 |