| Param | Original file | Final file |
|---|---|---|
| Filename | modeM0/AS1G05_191T01_9000000572_04598cztM0_level2.evt | modeM0/AS1G05_191T01_9000000572_04598cztM0_level2_quad_clean.evt |
| Size (bytes) | 233,706,240 | 47,007,360 |
| Size | 222.9 MB | 44.8 MB |
| Events in quadrant A | 1,192,467 | 325,883 |
| Events in quadrant B | 1,538,580 | 321,650 |
| Events in quadrant C | 1,437,682 | 315,673 |
| Events in quadrant D | 2,732,348 | 275,066 |
| Mode M9 | |||
|---|---|---|---|
| Quadrant | BADHDUFLAG | Total packets | Discarded packets |
| A | 0 | 2 | 0 |
| B | 0 | 2 | 0 |
| C | 0 | 2 | 0 |
| D | 0 | 3 | 0 |
| Mode M0 | |||
|---|---|---|---|
| Quadrant | BADHDUFLAG | Total packets | Discarded packets |
| A | 0 | 5334 | 1 |
| B | 0 | 6380 | 1 |
| C | 0 | 5967 | 1 |
| D | 0 | 9845 | 1 |
| Mode SS | |||
|---|---|---|---|
| Quadrant | BADHDUFLAG | Total packets | Discarded packets |
| A | 0 | 52 | 0 |
| B | 0 | 52 | 0 |
| C | 0 | 52 | 0 |
| D | 0 | 52 | 0 |
| Quadrant | Total seconds | Saturated seconds | Saturation percentage |
|---|---|---|---|
| A | 2574 | 4 | 0.155400% |
| B | 2574 | 6 | 0.233100% |
| C | 2574 | 3 | 0.116550% |
| D | 2574 | 493 | 19.153069% |
Noise dominated data is calculated using 1-second bins in cleaned event files. If a bin has >2000 counts, and if more than 50% of those come from <1% of pixels, then it is considered to be noise-dominated and hence unusable.
| Quadrant | # 1 sec bins | Bins with >0 counts | Bins with >2000 counts | High rate bins dominated by noise | Noise dominated (total time) | Noise dominated (detector-on time) | Marked lightcurve |
|---|---|---|---|---|---|---|---|
| A | 2574 | 2574 | 0 | 0 | 0.00% | 0.00% | 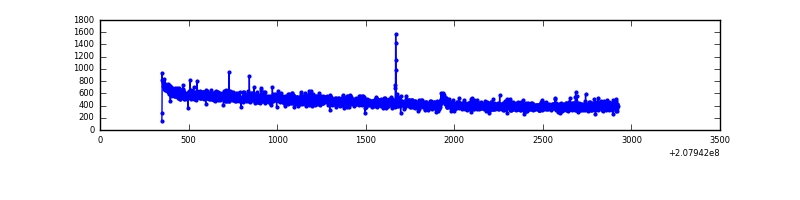 |
| B | 2574 | 2574 | 5 | 5 | 0.19% | 0.19% | 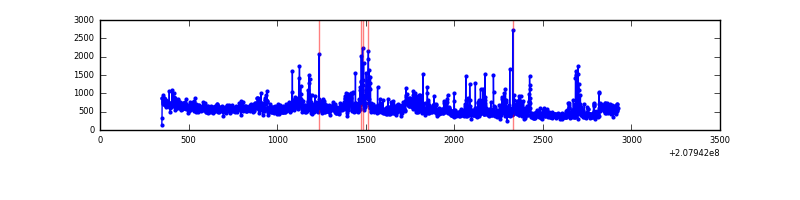 |
| C | 2574 | 2574 | 0 | 0 | 0.00% | 0.00% | 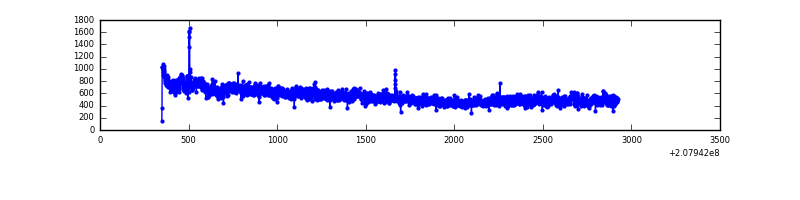 |
| D | 2574 | 2574 | 400 | 400 | 15.54% | 15.54% | 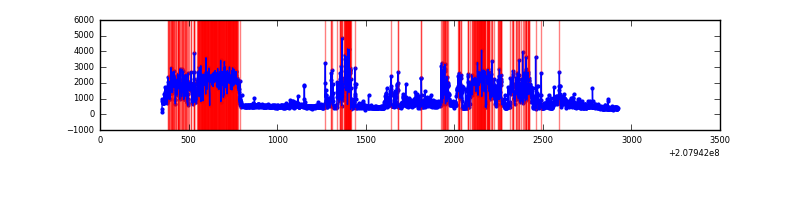 |
Top three noisy pixels from each quadrant. If the there are fewer than three noisy pixels in the level2.evt file, extra rows are filled as -1
| Pixel properties | Quadrant properties | ||||||
|---|---|---|---|---|---|---|---|
| Quadrant | DetID | PixID | Counts | Sigma | Mean | Median | Sigma |
| A | 15 | 174 | 5972 | 89.97 | 305 | 300 | 63.0 |
| A | 4 | 2 | 4415 | 65.27 | 305 | 300 | 63.0 |
| A | 12 | 194 | 3122 | 44.76 | 305 | 300 | 63.0 |
| B | 10 | 16 | 165492 | 2734.38 | 309 | 302 | 60.4 |
| B | 4 | 48 | 71733 | 1182.39 | 309 | 302 | 60.4 |
| B | 4 | 216 | 35888 | 589.05 | 309 | 302 | 60.4 |
| C | 14 | 48 | 241035 | 3321.94 | 302 | 304 | 72.5 |
| C | 9 | 247 | 9878 | 132.12 | 302 | 304 | 72.5 |
| C | 14 | 67 | 5411 | 70.47 | 302 | 304 | 72.5 |
| D | 13 | 235 | 1405344 | 20395.3 | 277 | 270 | 68.9 |
| D | 7 | 223 | 183993 | 2666.82 | 277 | 270 | 68.9 |
| D | 2 | 136 | 41484 | 598.24 | 277 | 270 | 68.9 |
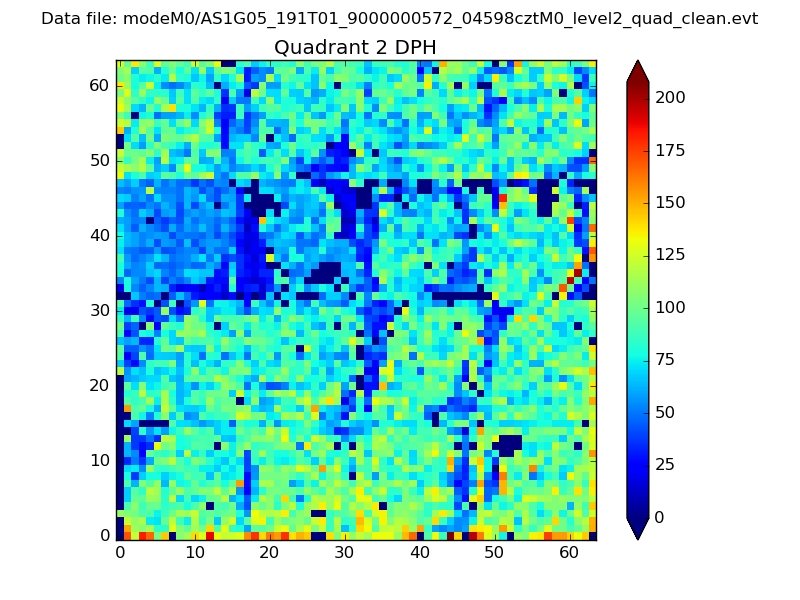
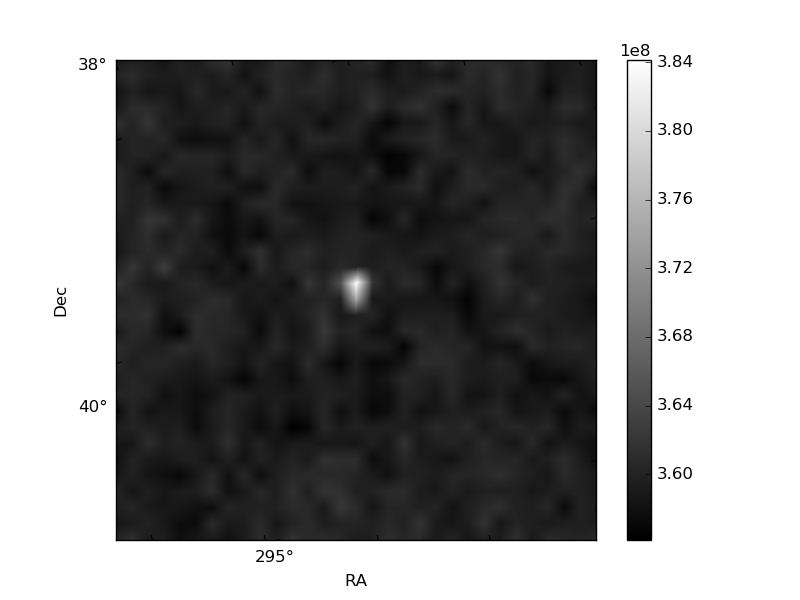
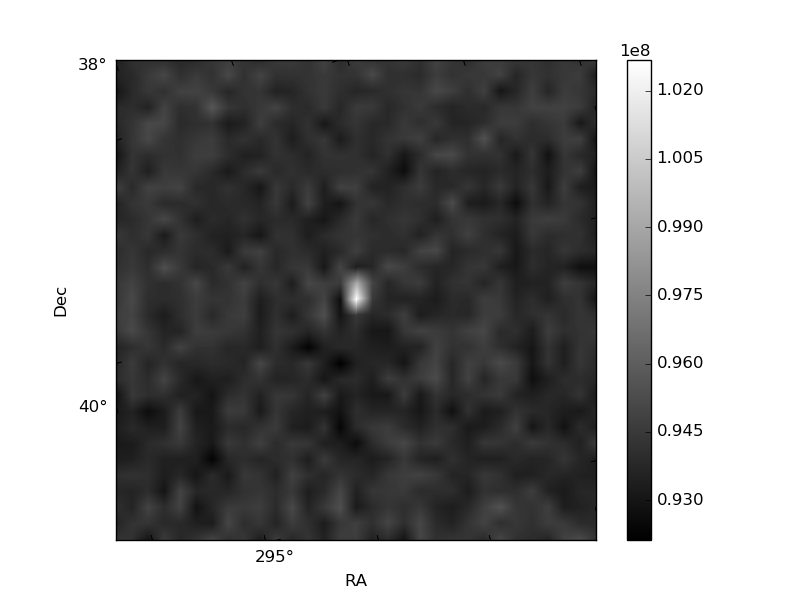
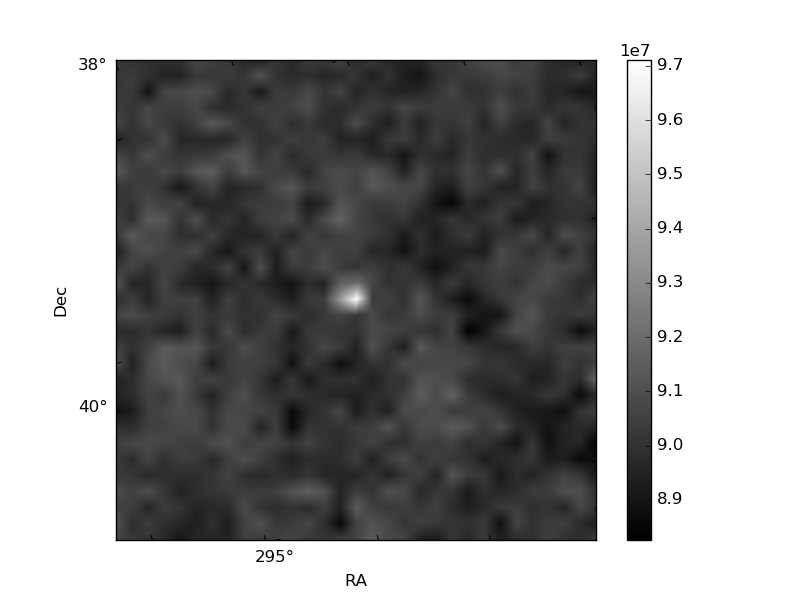
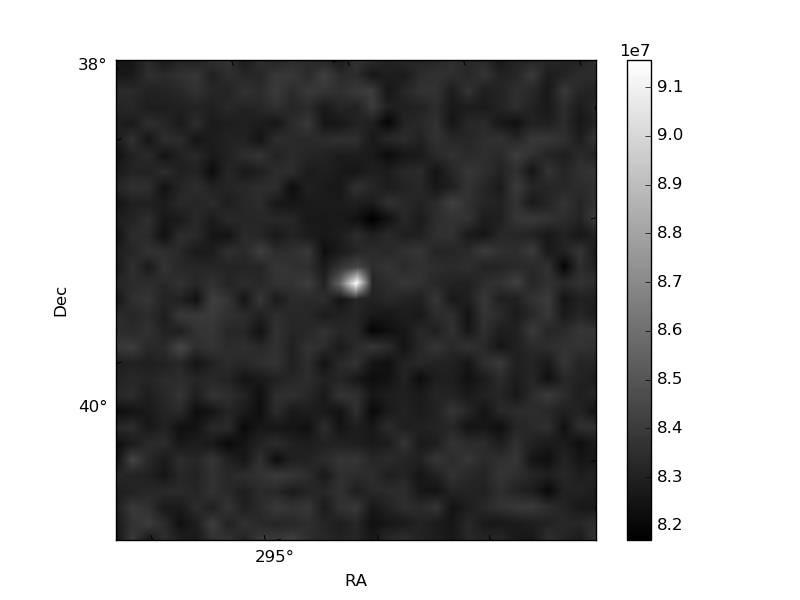
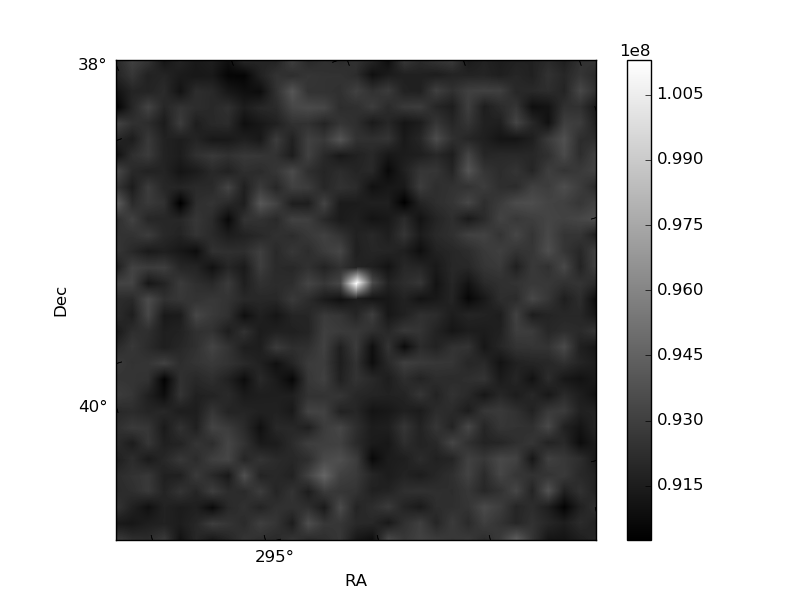
Histogram calculated using DETX and DETY for each event in the final _common_clean file
| Quadrant A | 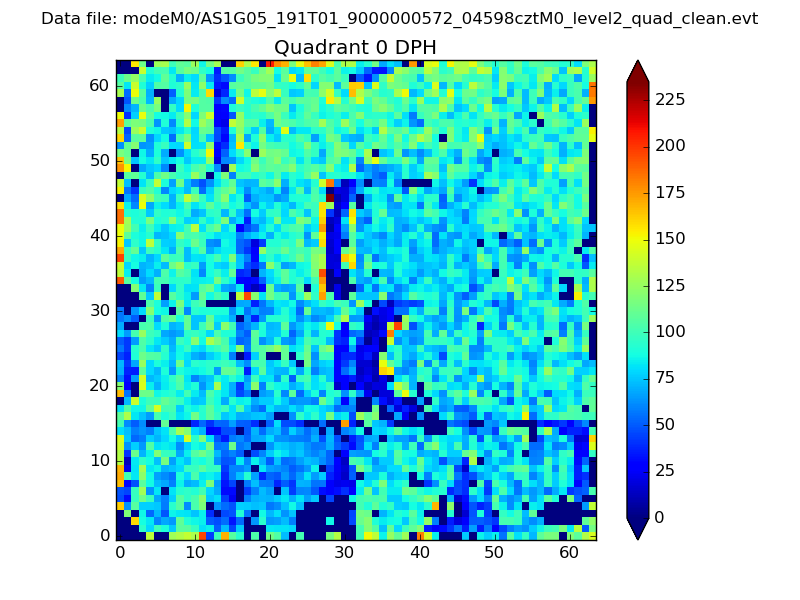 |
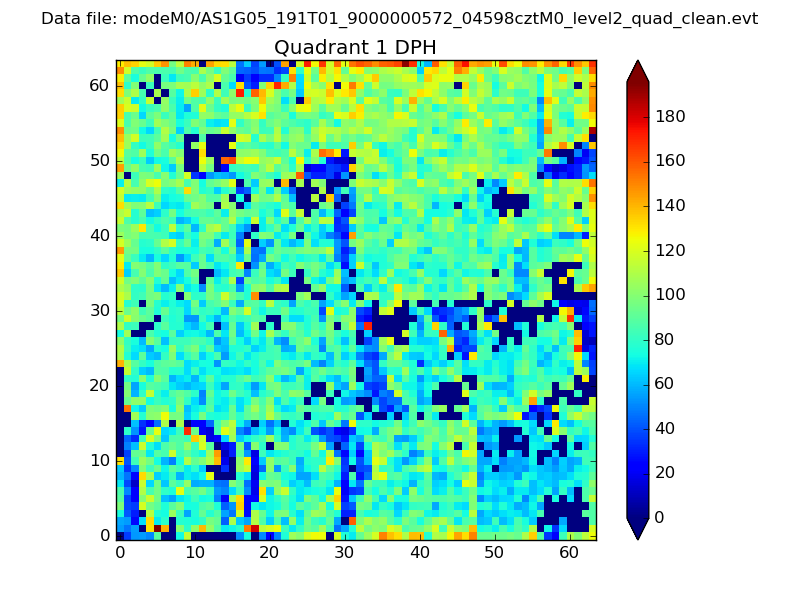 |
Quadrant B |
|---|---|---|---|
| Quadrant D | 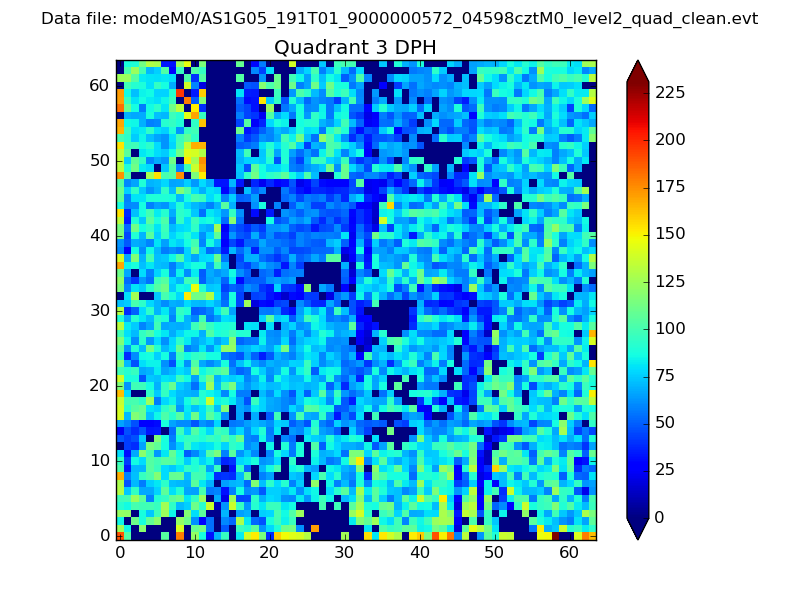 |
 |
Quadrant C |
| Plot type | Count rate plots | Images |
|---|---|---|
| Comparison with Poisson distribution Blue bars denote a histogram of data divided into 1 sec bins. Red curve is a Poisson curve with rate = median count rate of data. |
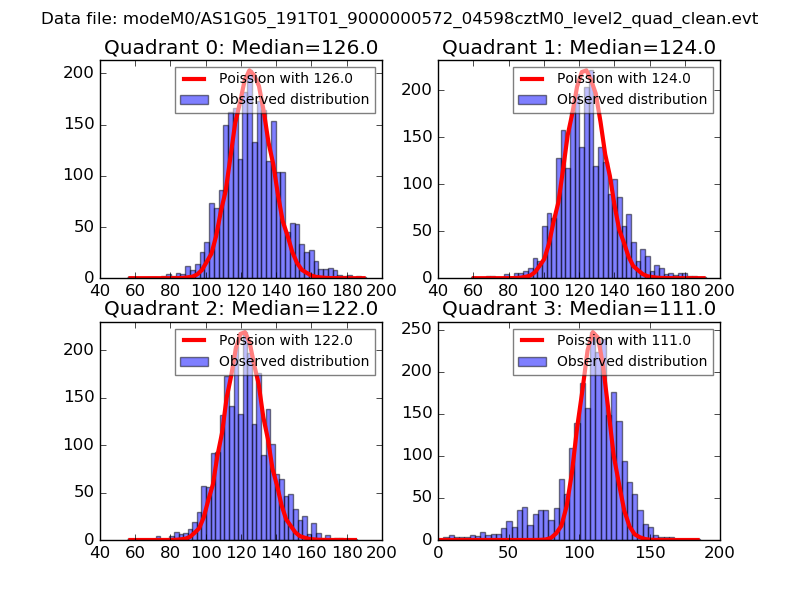 |
 |
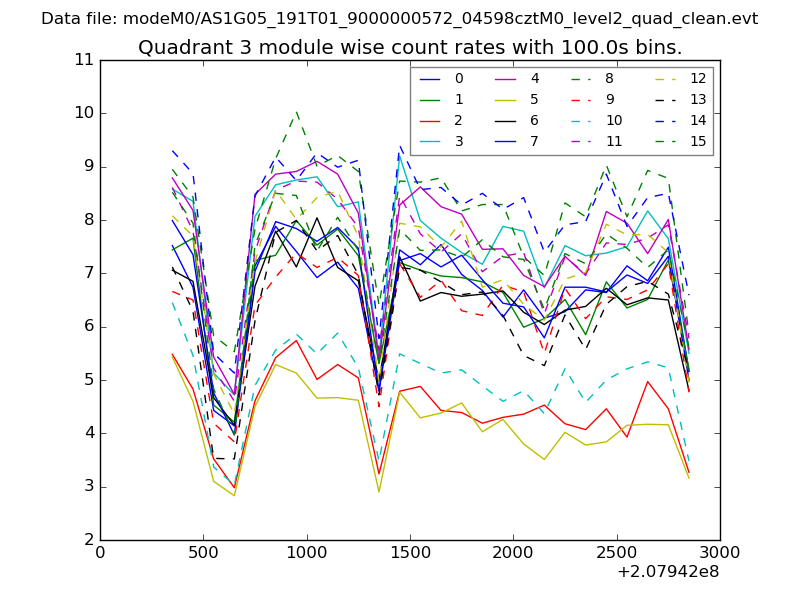
| Quadrant-wise count rates Data is divided into 100 sec bins |
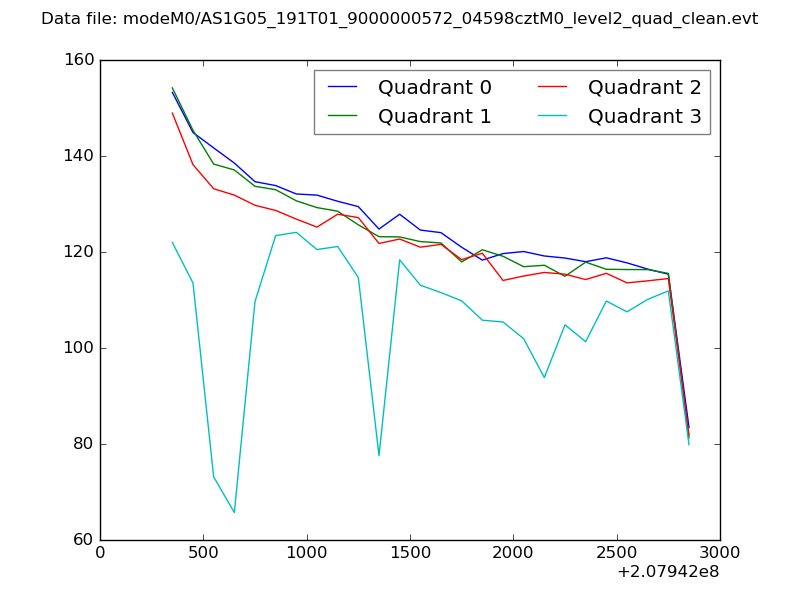 |
|
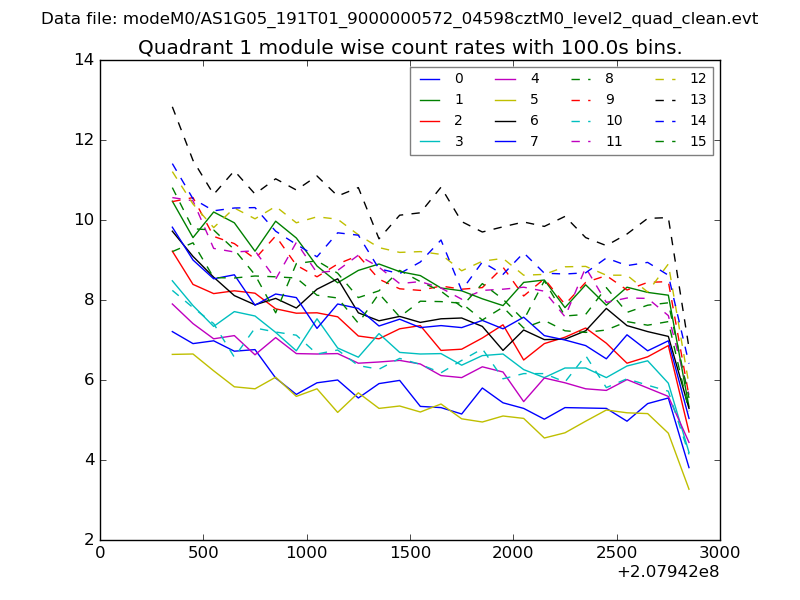
| Module-wise count rates for Quadrant A Data is divided into 100 sec bins |
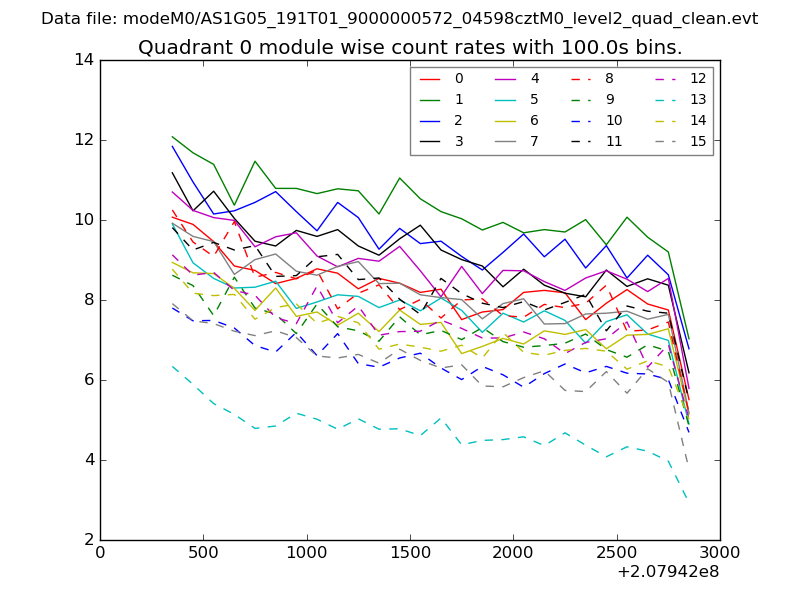 |
 |
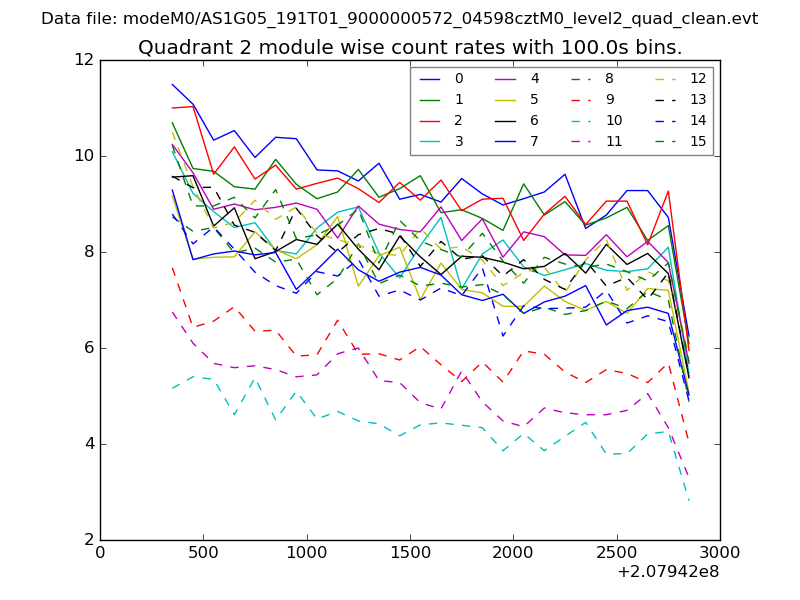
| Module-wise count rates for Quadrant B Data is divided into 100 sec bins |
 |
 |
| Module-wise count rates for Quadrant C Data is divided into 100 sec bins |
 |
 |
| Module-wise count rates for Quadrant D Data is divided into 100 sec bins |
 |
 |
| Parameter | Plot |
|---|---|
| CZT HV Monitor | 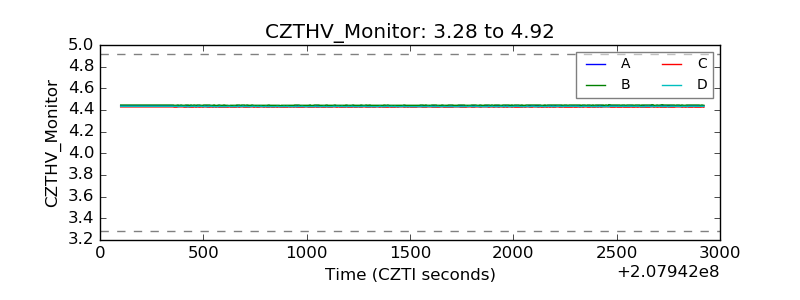 |
| D_VDD | 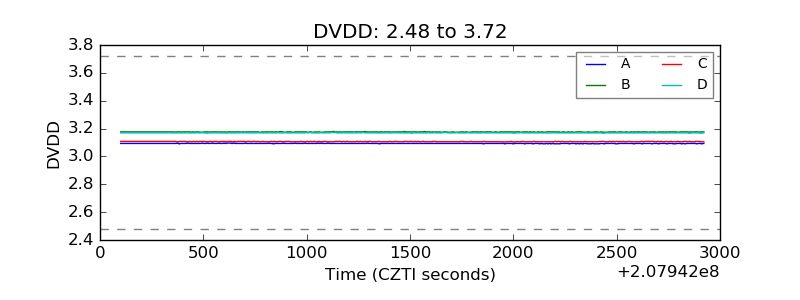 |
| Temperature 1 | 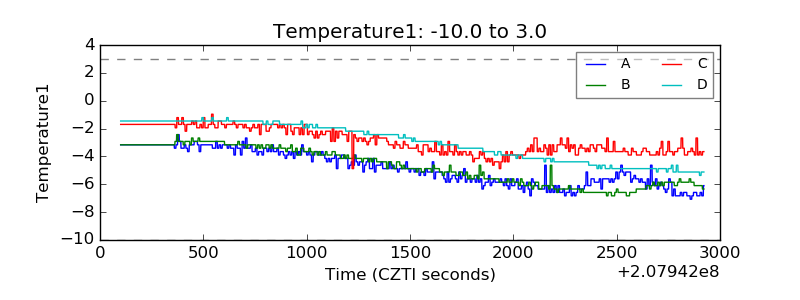 |
| Veto HV Monitor | 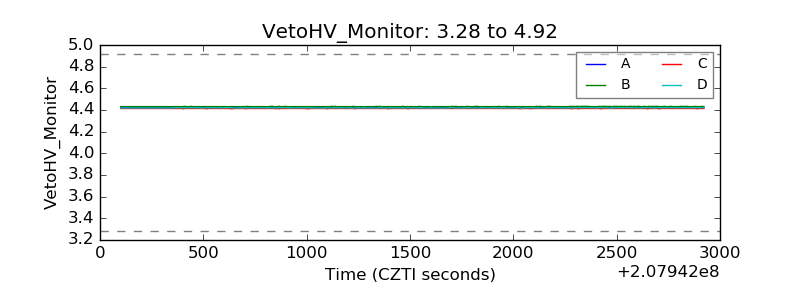 |
| Veto LLD | 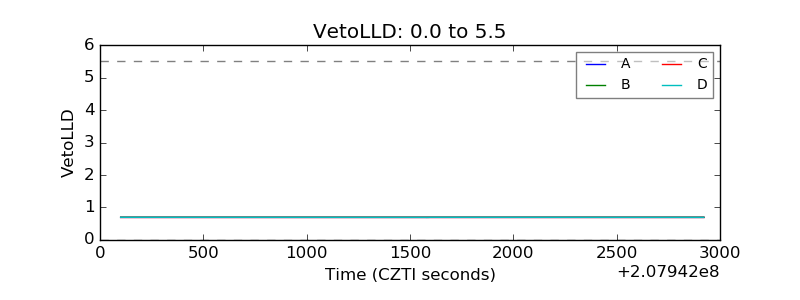 |
| Alpha Counter | 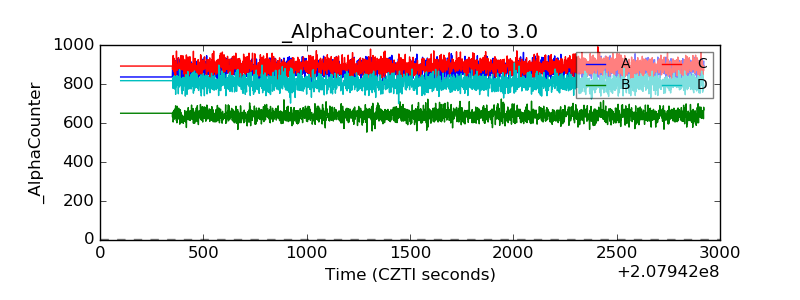 |
| _CPM_Rate | 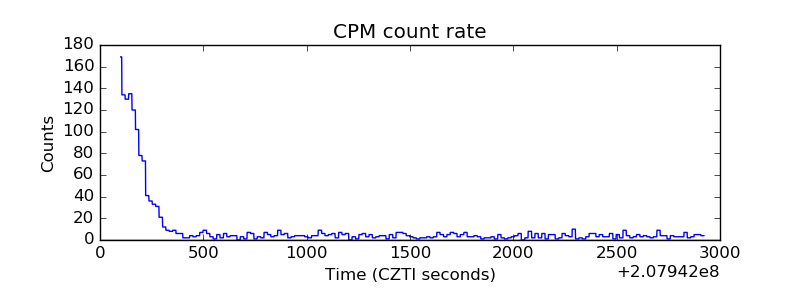 |
| CZT Counter | 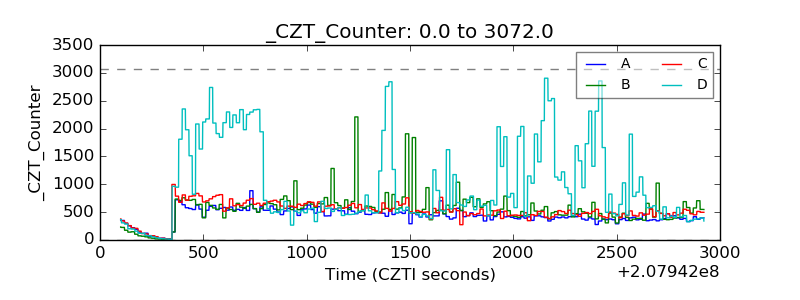 |
| +2.5 Volts monitor |  |
| +5 Volts monitor |  |
| _ROLL_ROT | 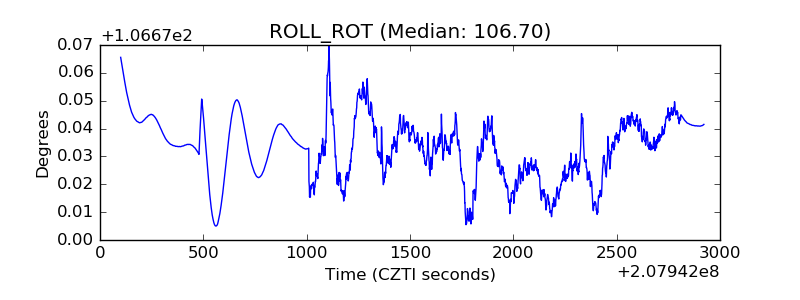 |
| _Roll_DEC | 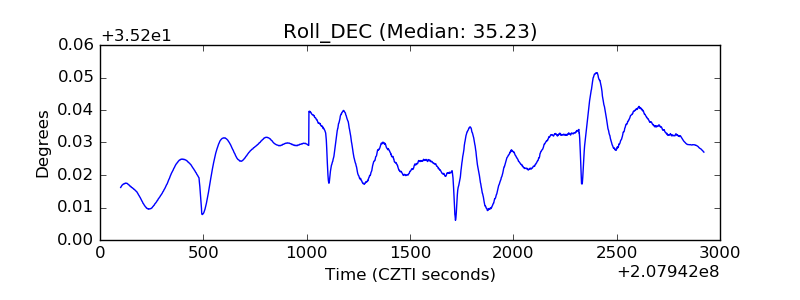 |
| _Roll_RA | 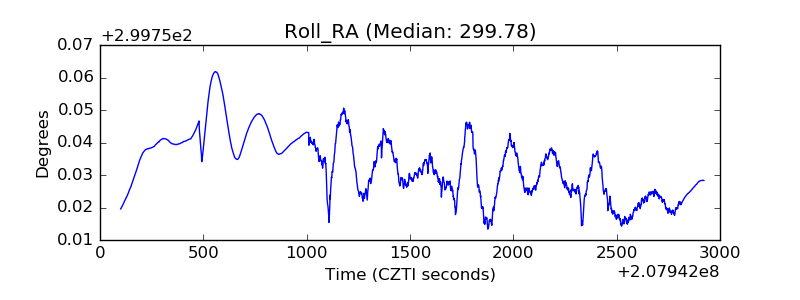 |
| Veto Counter | 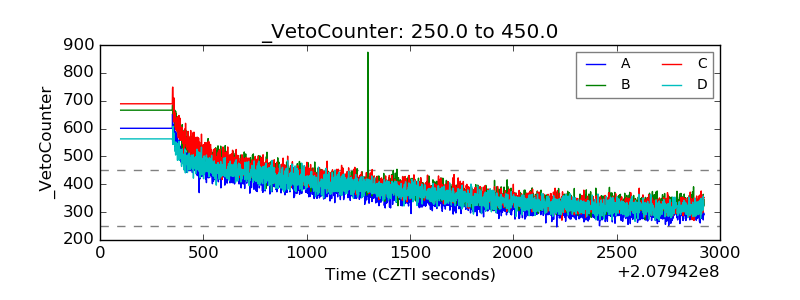 |