| Param | Original file | Final file |
|---|---|---|
| Filename | modeM0/AS1G05_154T01_9000000576cztM0_level2.fits | modeM0/AS1G05_154T01_9000000576cztM0_level2_quad_clean.evt |
| Size (bytes) | 885,286,080 | 834,166,080 |
| Size | 844.3 MB | 795.5 MB |
| Events in quadrant A | 5,439,576 | 5,013,236 |
| Events in quadrant B | 5,222,370 | 4,965,650 |
| Events in quadrant C | 5,395,307 | 4,862,017 |
| Events in quadrant D | 3,880,484 | 3,561,079 |
| Mode SS | |||
|---|---|---|---|
| Quadrant | BADHDUFLAG | Total packets | Discarded packets |
| A | 0 | 2034 | 0 |
| B | 0 | 2034 | 0 |
| C | 0 | 2034 | 0 |
| D | 0 | 2030 | 0 |
| Mode M9 | |||
|---|---|---|---|
| Quadrant | BADHDUFLAG | Total packets | Discarded packets |
| A | 0 | 123 | 0 |
| B | 0 | 123 | 0 |
| C | 0 | 123 | 0 |
| D | 0 | 124 | 0 |
| Mode M0 | |||
|---|---|---|---|
| Quadrant | BADHDUFLAG | Total packets | Discarded packets |
| A | 0 | 212609 | 0 |
| B | 0 | 228687 | 0 |
| C | 0 | 210857 | 0 |
| D | 0 | 377189 | 0 |
| Quadrant | Total seconds | Saturated seconds | Saturation percentage |
|---|---|---|---|
| A | 100072 | 2187 | 2.185426% |
| B | 100062 | 3630 | 3.627751% |
| C | 100084 | 1445 | 1.443787% |
| D | 100072 | 23145 | 23.128348% |
Noise dominated data is calculated using 1-second bins in cleaned event files. If a bin has >2000 counts, and if more than 50% of those come from <1% of pixels, then it is considered to be noise-dominated and hence unusable.
| Quadrant | # 1 sec bins | Bins with >0 counts | Bins with >2000 counts | High rate bins dominated by noise | Noise dominated (total time) | Noise dominated (detector-on time) | Marked lightcurve |
|---|---|---|---|---|---|---|---|
| A | 119298 | 100233 | 0 | 0 | 0.00% | 0.00% |  |
| B | 119298 | 100211 | 0 | 0 | 0.00% | 0.00% |  |
| C | 119298 | 100251 | 0 | 0 | 0.00% | 0.00% |  |
| D | 119297 | 96105 | 0 | 0 | 0.00% | 0.00% |  |
Top three noisy pixels from each quadrant. If the there are fewer than three noisy pixels in the level2.evt file, extra rows are filled as -1
| Pixel properties | Quadrant properties | ||||||
|---|---|---|---|---|---|---|---|
| Quadrant | DetID | PixID | Counts | Sigma | Mean | Median | Sigma |
| A | 14 | 188 | 5420 | 11.21 | 1409 | 1307 | 366.8 |
| A | 0 | 29 | 5341 | 11.0 | 1409 | 1307 | 366.8 |
| A | 7 | 110 | 4726 | 9.32 | 1409 | 1307 | 366.8 |
| B | 2 | 9 | 4692 | 12.05 | 1379 | 1306 | 281.0 |
| B | 14 | 254 | 3630 | 8.27 | 1379 | 1306 | 281.0 |
| B | 12 | 226 | 3616 | 8.22 | 1379 | 1306 | 281.0 |
| C | 1 | 80 | 3935 | 6.91 | 1422 | 1310 | 380.0 |
| C | 1 | 81 | 3827 | 6.62 | 1422 | 1310 | 380.0 |
| C | 12 | 241 | 3778 | 6.5 | 1422 | 1310 | 380.0 |
| D | 11 | 82 | 3133 | 7.09 | 1105 | 997 | 301.1 |
| D | 3 | 14 | 2947 | 6.47 | 1105 | 997 | 301.1 |
| D | 3 | 31 | 2836 | 6.11 | 1105 | 997 | 301.1 |
Histogram calculated using DETX and DETY for each event in the final _common_clean file
| Quadrant A |  |
 |
Quadrant B |
|---|---|---|---|
| Quadrant D | 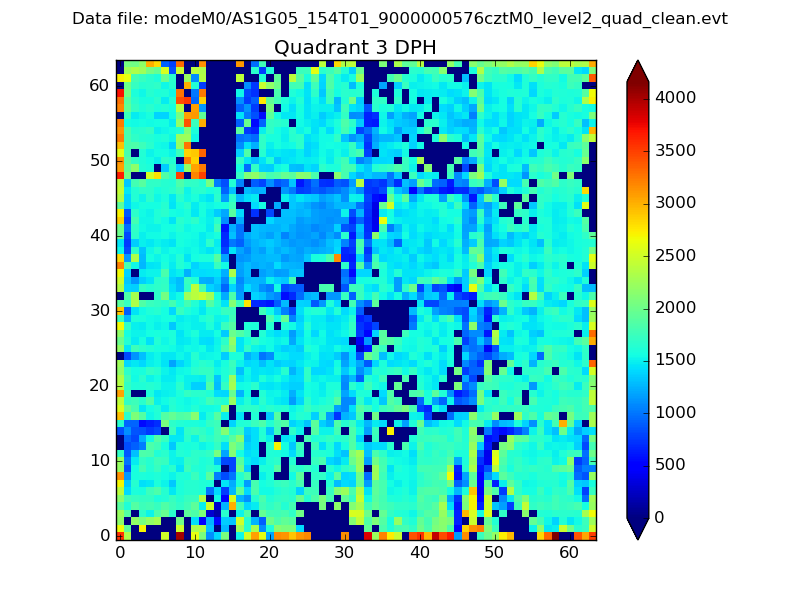 |
 |
Quadrant C |
| Plot type | Count rate plots | Images |
|---|---|---|
| Comparison with Poisson distribution Blue bars denote a histogram of data divided into 1 sec bins. Red curve is a Poisson curve with rate = median count rate of data. |
 |
 |
| Quadrant-wise count rates Data is divided into 100 sec bins |
 |
|
| Module-wise count rates for Quadrant A Data is divided into 100 sec bins |
 |
 |
| Module-wise count rates for Quadrant B Data is divided into 100 sec bins |
 |
 |
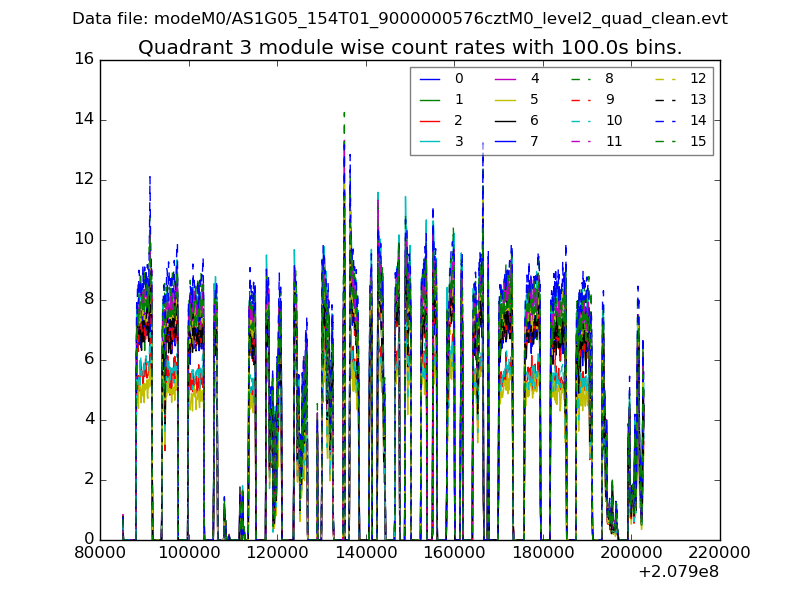
| Module-wise count rates for Quadrant C Data is divided into 100 sec bins |
 |
 |
| Module-wise count rates for Quadrant D Data is divided into 100 sec bins |
 |
 |
| Parameter | Plot |
|---|---|
| CZT HV Monitor |  |
| D_VDD | 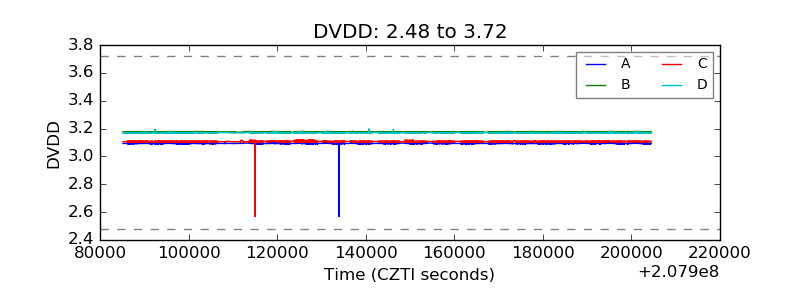 |
| Temperature 1 |  |
| Veto HV Monitor |  |
| Veto LLD |  |
| Alpha Counter | 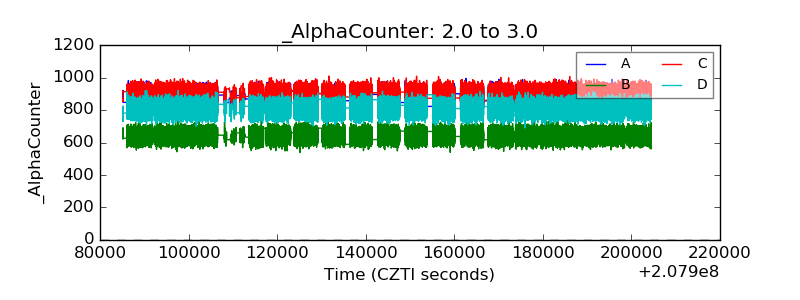 |
| _CPM_Rate | 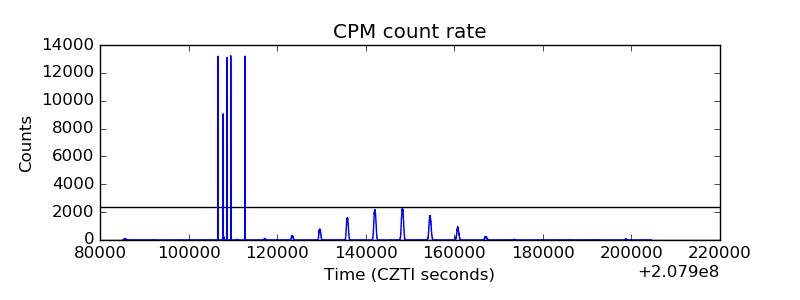 |
| CZT Counter |  |
| +2.5 Volts monitor |  |
| +5 Volts monitor |  |
| _ROLL_ROT |  |
| _Roll_DEC |  |
| _Roll_RA |  |
| Veto Counter |  |