| Param | Original file | Final file |
|---|---|---|
| Filename | modeM0/AS1G05_154T01_9000000576_04605cztM0_level2.evt | modeM0/AS1G05_154T01_9000000576_04605cztM0_level2_quad_clean.evt |
| Size (bytes) | 118,972,800 | 4,129,920 |
| Size | 113.5 MB | 3.9 MB |
| Events in quadrant A | 747,347 | 1,133 |
| Events in quadrant B | 786,881 | 1,052 |
| Events in quadrant C | 882,839 | 1,153 |
| Events in quadrant D | 1,073,015 | 1,174 |
| Mode SS | |||
|---|---|---|---|
| Quadrant | BADHDUFLAG | Total packets | Discarded packets |
| A | 0 | 34 | 0 |
| B | 0 | 34 | 0 |
| C | 0 | 34 | 0 |
| D | 0 | 34 | 0 |
| Mode M9 | |||
|---|---|---|---|
| Quadrant | BADHDUFLAG | Total packets | Discarded packets |
| A | 0 | 9 | 0 |
| B | 0 | 9 | 0 |
| C | 0 | 9 | 0 |
| D | 0 | 9 | 0 |
| Mode M0 | |||
|---|---|---|---|
| Quadrant | BADHDUFLAG | Total packets | Discarded packets |
| A | 0 | 3391 | 2 |
| B | 0 | 3426 | 1 |
| C | 0 | 3732 | 1 |
| D | 0 | 4401 | 1 |
| Quadrant | Total seconds | Saturated seconds | Saturation percentage |
|---|---|---|---|
| A | 1625 | 32 | 1.969231% |
| B | 1625 | 29 | 1.784615% |
| C | 1625 | 20 | 1.230769% |
| D | 1625 | 120 | 7.384615% |
Noise dominated data is calculated using 1-second bins in cleaned event files. If a bin has >2000 counts, and if more than 50% of those come from <1% of pixels, then it is considered to be noise-dominated and hence unusable.
| Quadrant | # 1 sec bins | Bins with >0 counts | Bins with >2000 counts | High rate bins dominated by noise | Noise dominated (total time) | Noise dominated (detector-on time) | Marked lightcurve |
|---|---|---|---|---|---|---|---|
| A | 2500 | 1626 | 0 | 0 | 0.00% | 0.00% | 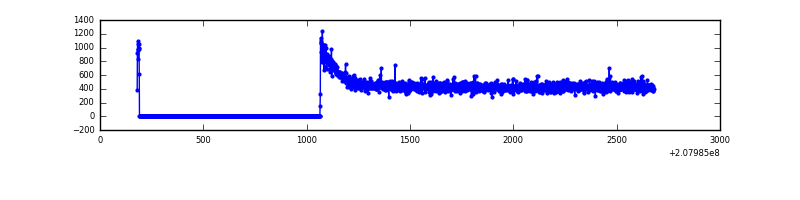 |
| B | 2500 | 1626 | 1 | 1 | 0.04% | 0.06% | 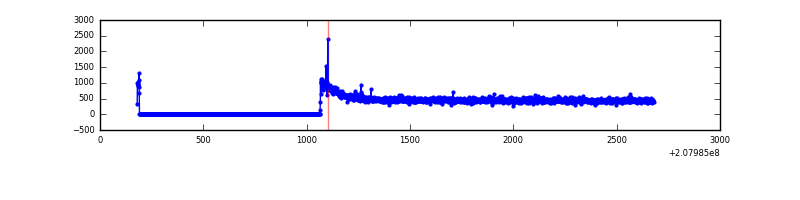 |
| C | 2500 | 1626 | 0 | 0 | 0.00% | 0.00% | 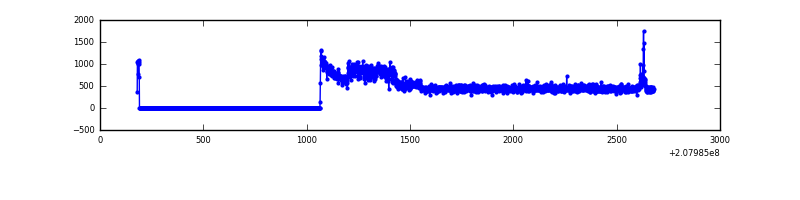 |
| D | 2500 | 1626 | 65 | 65 | 2.60% | 4.00% | 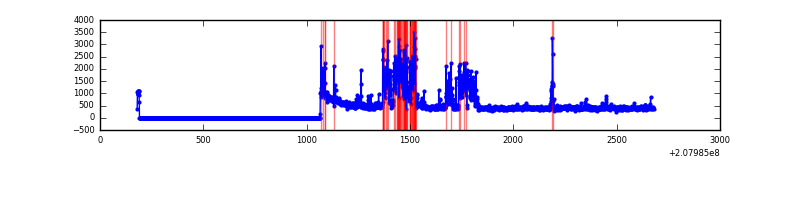 |
Top three noisy pixels from each quadrant. If the there are fewer than three noisy pixels in the level2.evt file, extra rows are filled as -1
| Pixel properties | Quadrant properties | ||||||
|---|---|---|---|---|---|---|---|
| Quadrant | DetID | PixID | Counts | Sigma | Mean | Median | Sigma |
| A | 3 | 1 | 4081 | 93.85 | 192 | 187 | 41.5 |
| A | 13 | 14 | 2310 | 51.17 | 192 | 187 | 41.5 |
| A | 12 | 194 | 1911 | 41.55 | 192 | 187 | 41.5 |
| B | 14 | 167 | 8676 | 207.78 | 198 | 193 | 40.8 |
| B | 15 | 204 | 4651 | 109.19 | 198 | 193 | 40.8 |
| B | 12 | 111 | 3872 | 90.11 | 198 | 193 | 40.8 |
| C | 14 | 48 | 122407 | 2601.15 | 191 | 191 | 47.0 |
| C | 12 | 4 | 10293 | 215.0 | 191 | 191 | 47.0 |
| C | 9 | 54 | 1829 | 34.86 | 191 | 191 | 47.0 |
| D | 13 | 235 | 339301 | 7347.11 | 182 | 176 | 46.2 |
| D | 2 | 14 | 19101 | 410.01 | 182 | 176 | 46.2 |
| D | 2 | 136 | 15354 | 328.83 | 182 | 176 | 46.2 |
Histogram calculated using DETX and DETY for each event in the final _common_clean file
| Quadrant A |  |
 |
Quadrant B |
|---|---|---|---|
| Quadrant D |  |
 |
Quadrant C |
| Plot type | Count rate plots | Images |
|---|---|---|
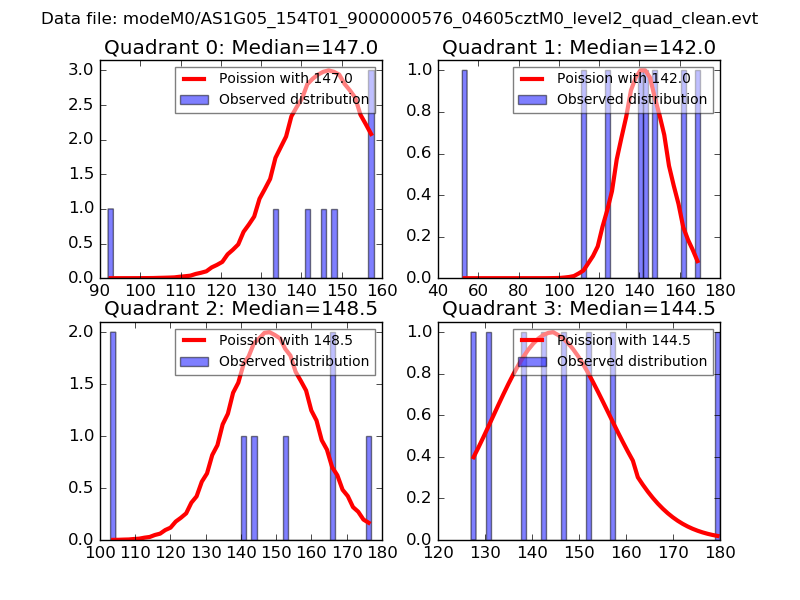
| Comparison with Poisson distribution Blue bars denote a histogram of data divided into 1 sec bins. Red curve is a Poisson curve with rate = median count rate of data. |
 |
 |
| Quadrant-wise count rates Data is divided into 100 sec bins |
 |
|
| Module-wise count rates for Quadrant A Data is divided into 100 sec bins |
 |
 |
| Module-wise count rates for Quadrant B Data is divided into 100 sec bins |
 |
 |
| Module-wise count rates for Quadrant C Data is divided into 100 sec bins |
 |
 |
| Module-wise count rates for Quadrant D Data is divided into 100 sec bins |
 |
 |
| Parameter | Plot |
|---|---|
| CZT HV Monitor | 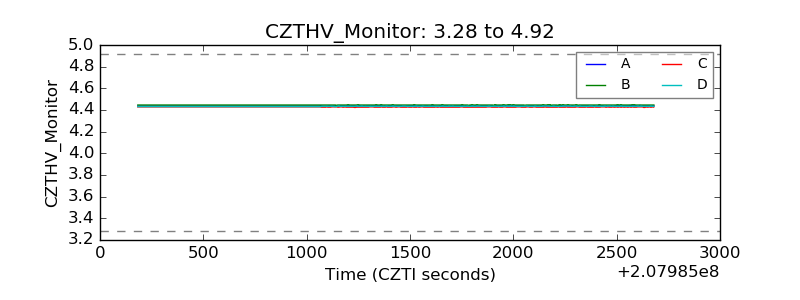 |
| D_VDD | 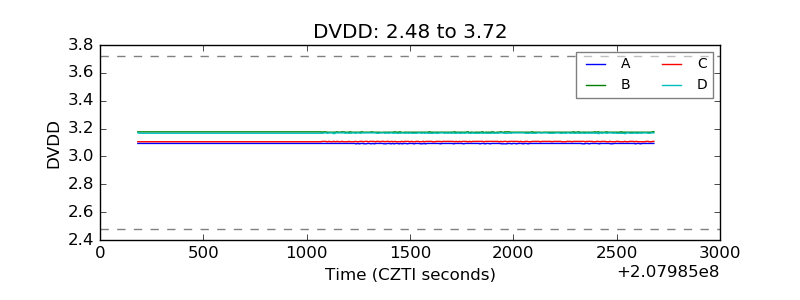 |
| Temperature 1 | 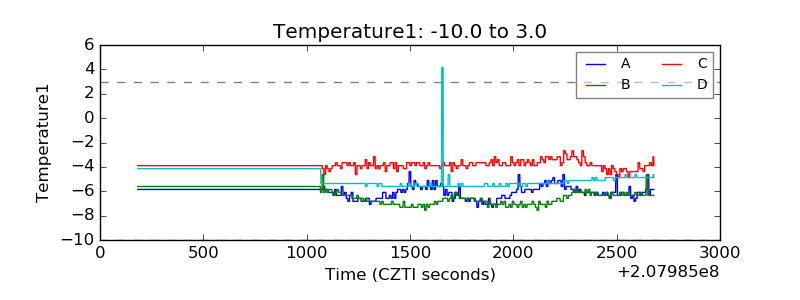 |
| Veto HV Monitor | 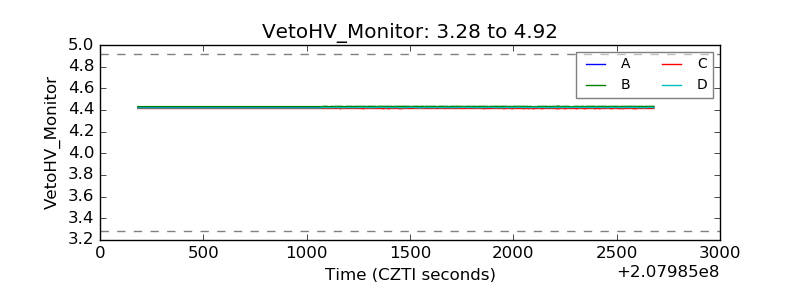 |
| Veto LLD | 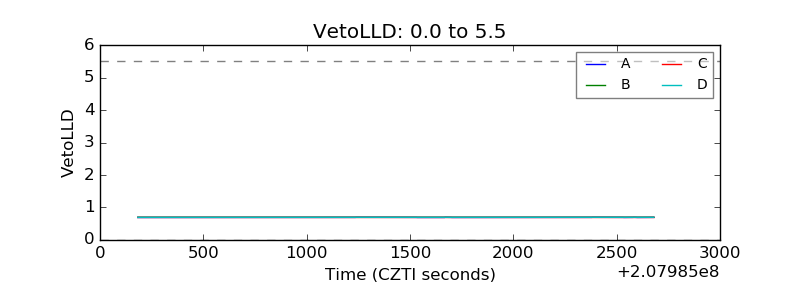 |
| Alpha Counter | 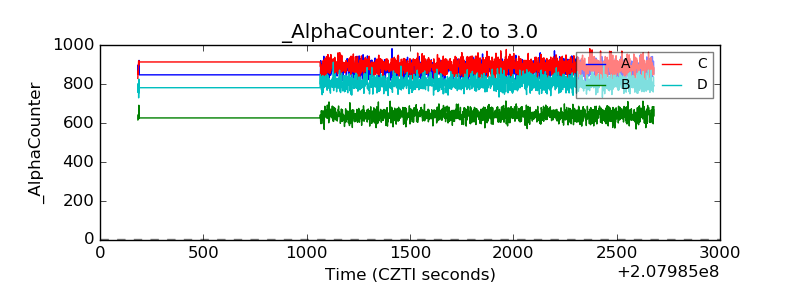 |
| _CPM_Rate | 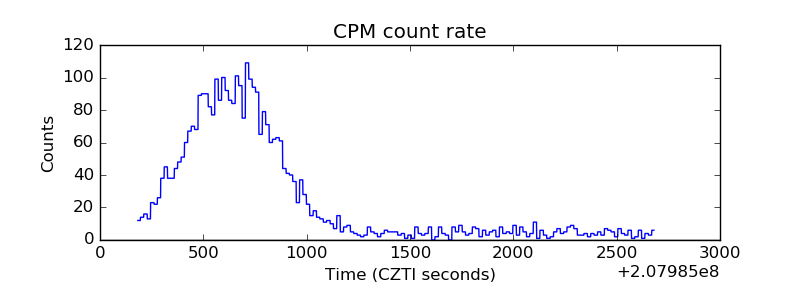 |
| CZT Counter | 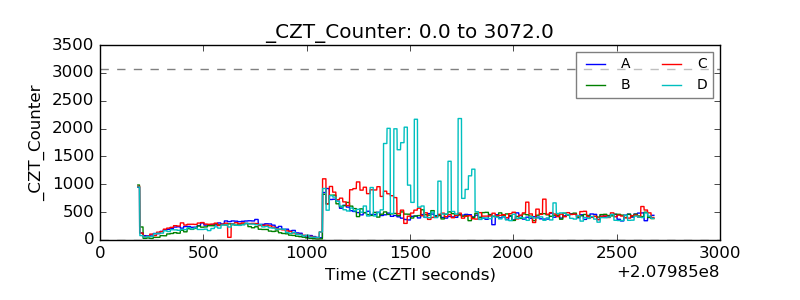 |
| +2.5 Volts monitor |  |
| +5 Volts monitor |  |
| _ROLL_ROT | 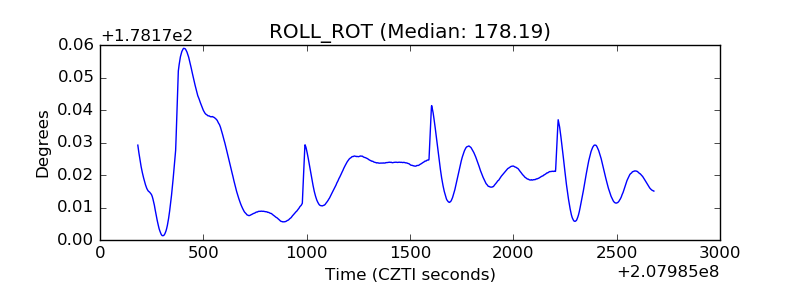 |
| _Roll_DEC | 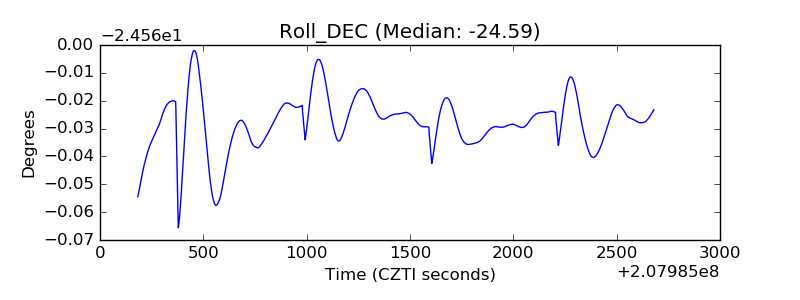 |
| _Roll_RA |  |
| Veto Counter | 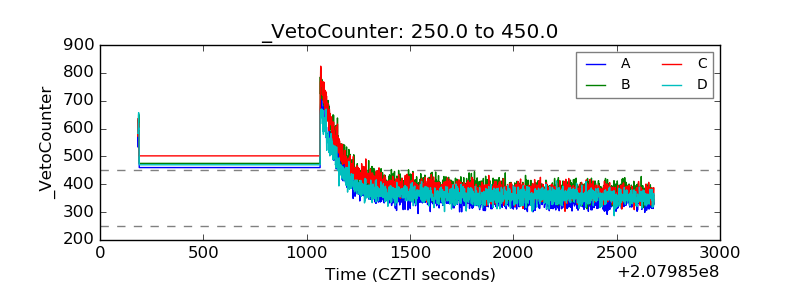 |