| Param | Original file | Final file |
|---|---|---|
| Filename | modeM0/AS1G05_154T01_9000000576_04607cztM0_level2.evt | modeM0/AS1G05_154T01_9000000576_04607cztM0_level2_quad_clean.evt |
| Size (bytes) | 639,967,680 | 69,857,280 |
| Size | 610.3 MB | 66.6 MB |
| Events in quadrant A | 3,607,775 | 399,229 |
| Events in quadrant B | 3,784,657 | 399,497 |
| Events in quadrant C | 3,917,822 | 398,905 |
| Events in quadrant D | 7,542,323 | 375,763 |
| Mode SS | |||
|---|---|---|---|
| Quadrant | BADHDUFLAG | Total packets | Discarded packets |
| A | 0 | 156 | 0 |
| B | 0 | 156 | 0 |
| C | 0 | 156 | 0 |
| D | 0 | 156 | 0 |
| Mode M0 | |||
|---|---|---|---|
| Quadrant | BADHDUFLAG | Total packets | Discarded packets |
| A | 0 | 16134 | 1 |
| B | 0 | 16307 | 0 |
| C | 0 | 16536 | 0 |
| D | 0 | 28118 | 0 |
| Quadrant | Total seconds | Saturated seconds | Saturation percentage |
|---|---|---|---|
| A | 7787 | 171 | 2.195968% |
| B | 7787 | 205 | 2.632593% |
| C | 7787 | 116 | 1.489662% |
| D | 7787 | 2142 | 27.507384% |
Noise dominated data is calculated using 1-second bins in cleaned event files. If a bin has >2000 counts, and if more than 50% of those come from <1% of pixels, then it is considered to be noise-dominated and hence unusable.
| Quadrant | # 1 sec bins | Bins with >0 counts | Bins with >2000 counts | High rate bins dominated by noise | Noise dominated (total time) | Noise dominated (detector-on time) | Marked lightcurve |
|---|---|---|---|---|---|---|---|
| A | 7787 | 7787 | 0 | 0 | 0.00% | 0.00% | 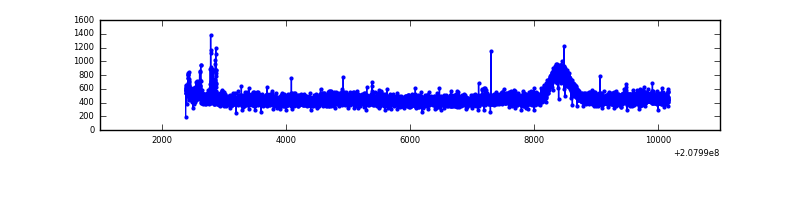 |
| B | 7787 | 7787 | 6 | 6 | 0.08% | 0.08% | 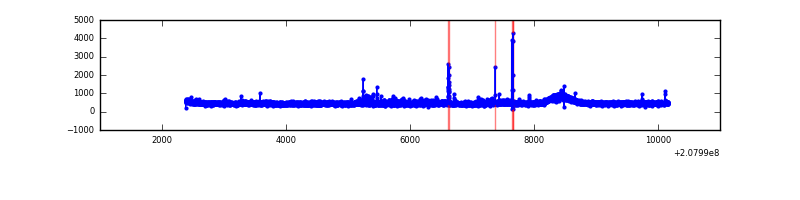 |
| C | 7787 | 7787 | 0 | 0 | 0.00% | 0.00% | 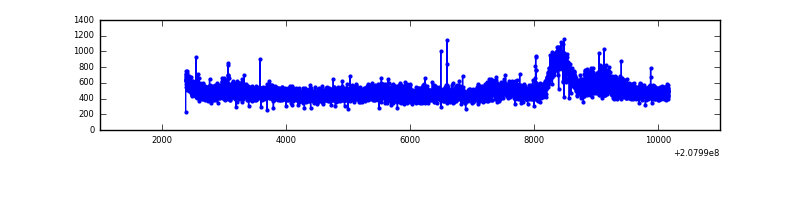 |
| D | 7787 | 7787 | 1596 | 1596 | 20.50% | 20.50% | 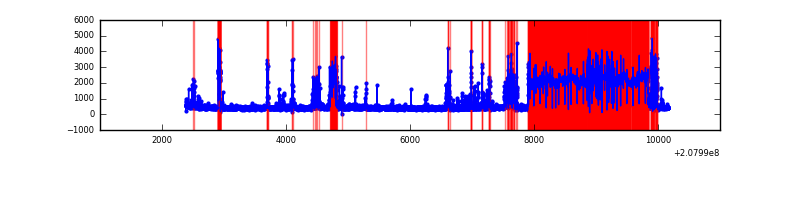 |
Top three noisy pixels from each quadrant. If the there are fewer than three noisy pixels in the level2.evt file, extra rows are filled as -1
| Pixel properties | Quadrant properties | ||||||
|---|---|---|---|---|---|---|---|
| Quadrant | DetID | PixID | Counts | Sigma | Mean | Median | Sigma |
| A | 15 | 174 | 42405 | 217.15 | 918 | 895 | 191.2 |
| A | 3 | 1 | 12454 | 60.47 | 918 | 895 | 191.2 |
| A | 12 | 194 | 9292 | 43.93 | 918 | 895 | 191.2 |
| B | 14 | 167 | 31698 | 169.04 | 931 | 906 | 182.2 |
| B | 15 | 204 | 30835 | 164.3 | 931 | 906 | 182.2 |
| B | 15 | 54 | 26737 | 141.8 | 931 | 906 | 182.2 |
| C | 14 | 48 | 396340 | 1888.23 | 896 | 900 | 209.4 |
| C | 9 | 54 | 12243 | 54.16 | 896 | 900 | 209.4 |
| C | 13 | 61 | 7442 | 31.24 | 896 | 900 | 209.4 |
| D | 13 | 235 | 4909449 | 30408.57 | 660 | 639 | 161.4 |
| D | 2 | 206 | 36098 | 219.66 | 660 | 639 | 161.4 |
| D | 2 | 136 | 30869 | 187.27 | 660 | 639 | 161.4 |
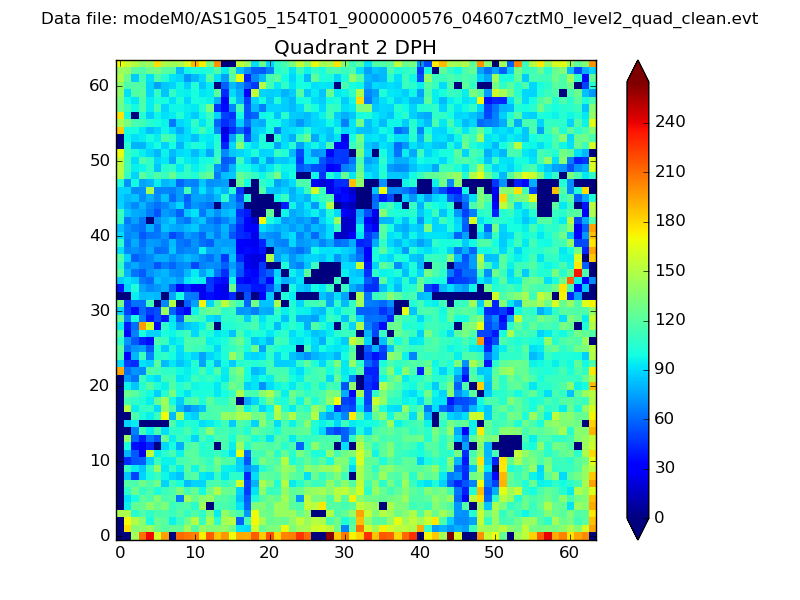
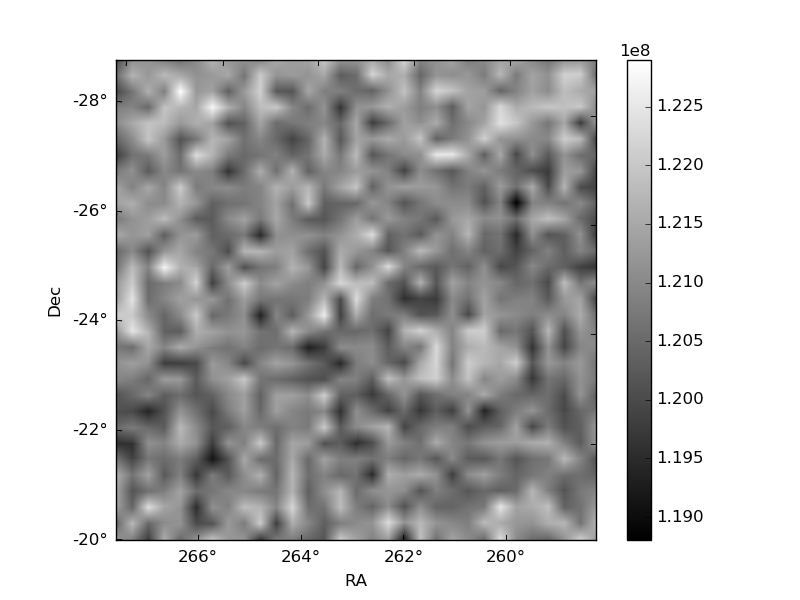
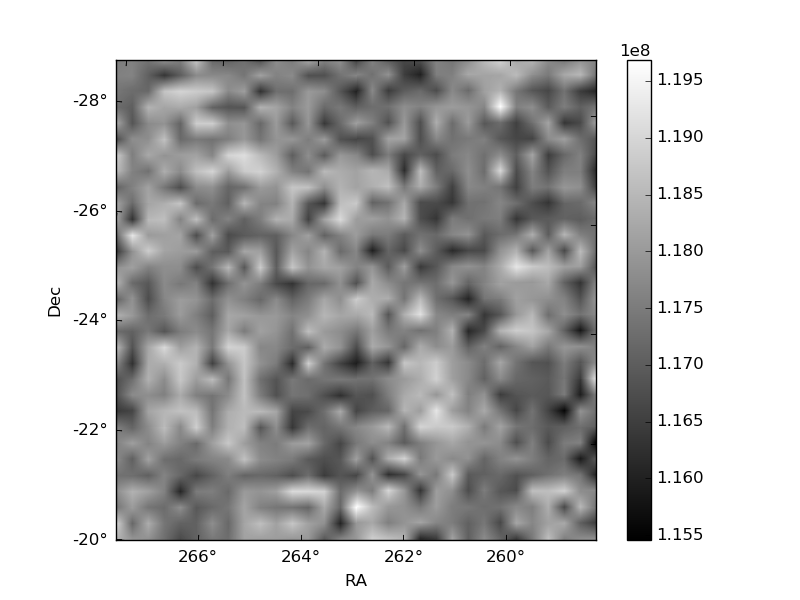
Histogram calculated using DETX and DETY for each event in the final _common_clean file
| Quadrant A | 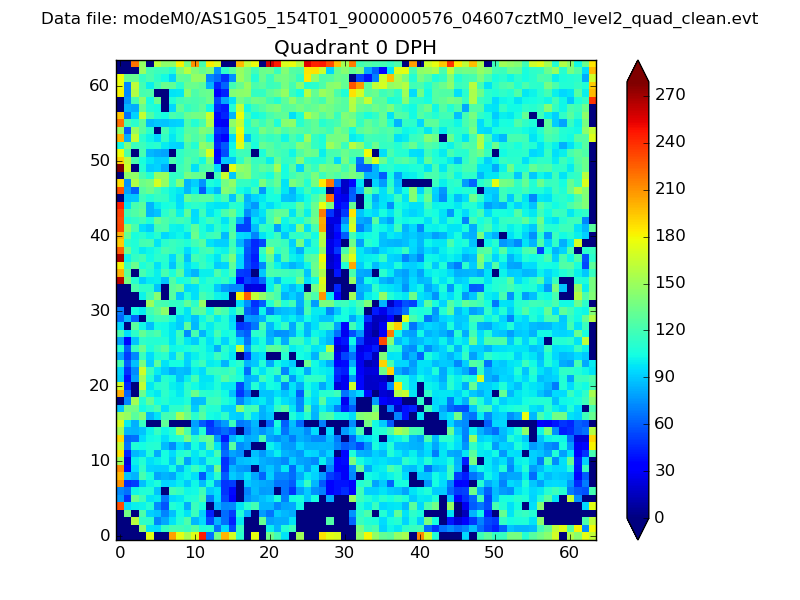 |
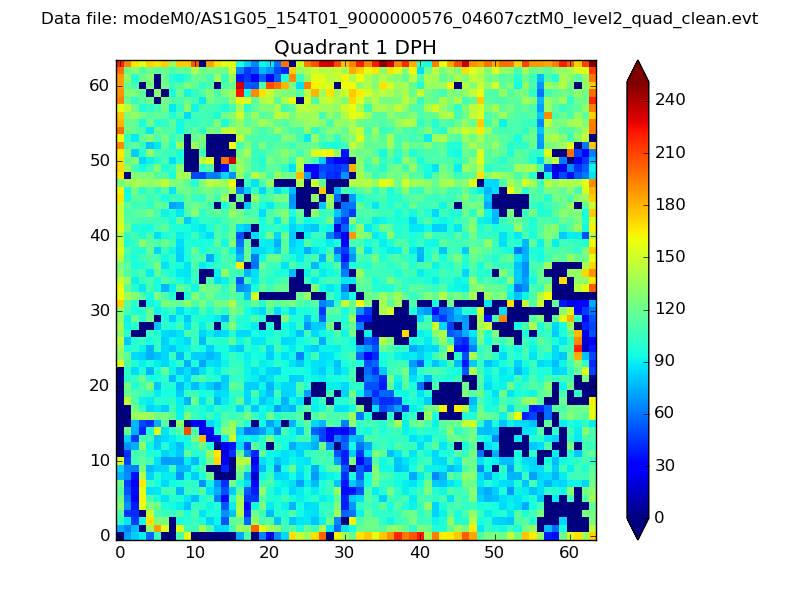 |
Quadrant B |
|---|---|---|---|
| Quadrant D | 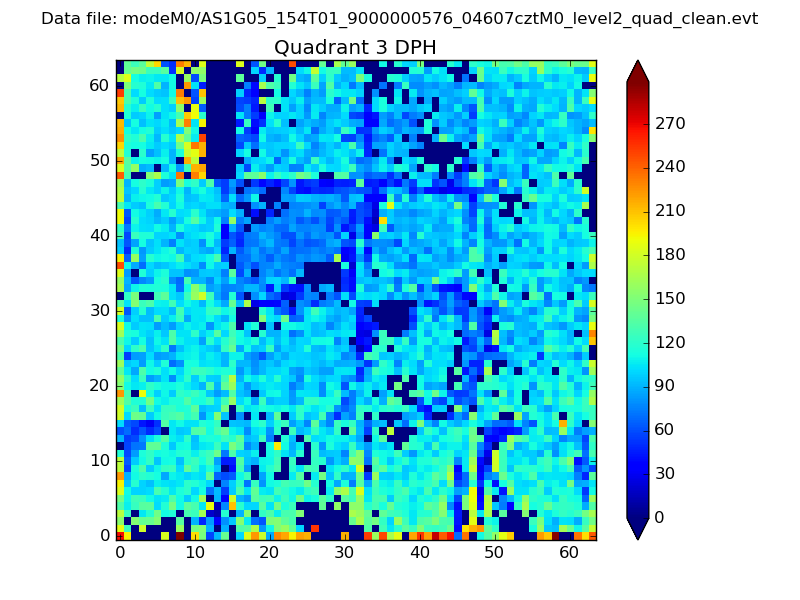 |
 |
Quadrant C |
| Plot type | Count rate plots | Images |
|---|---|---|
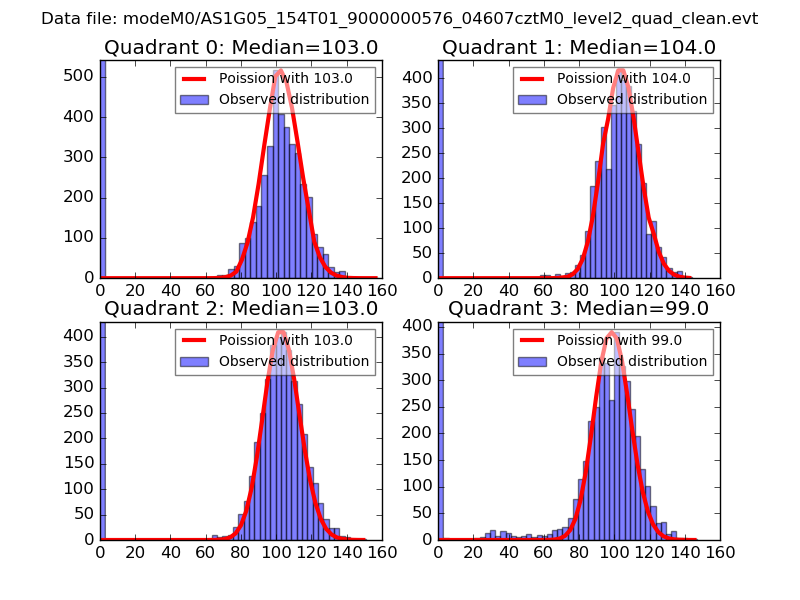
| Comparison with Poisson distribution Blue bars denote a histogram of data divided into 1 sec bins. Red curve is a Poisson curve with rate = median count rate of data. |
 |
 |
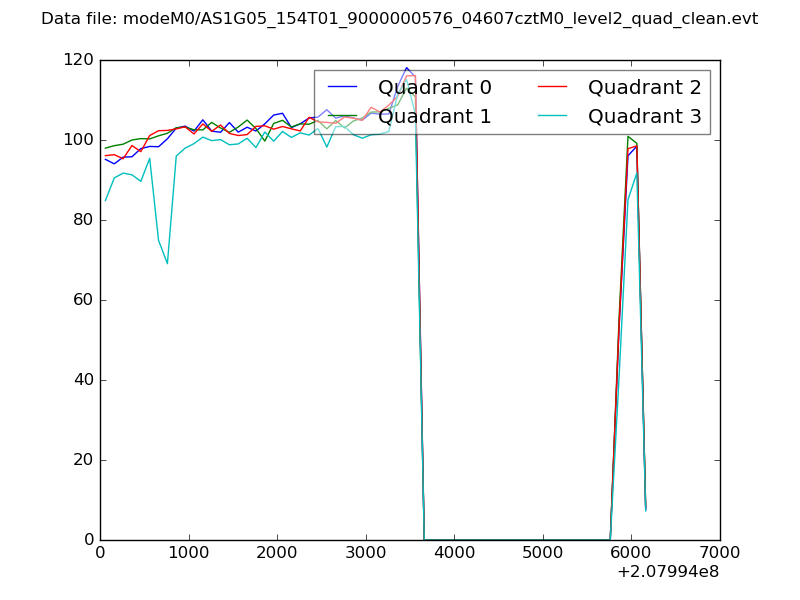
| Quadrant-wise count rates Data is divided into 100 sec bins |
 |
|
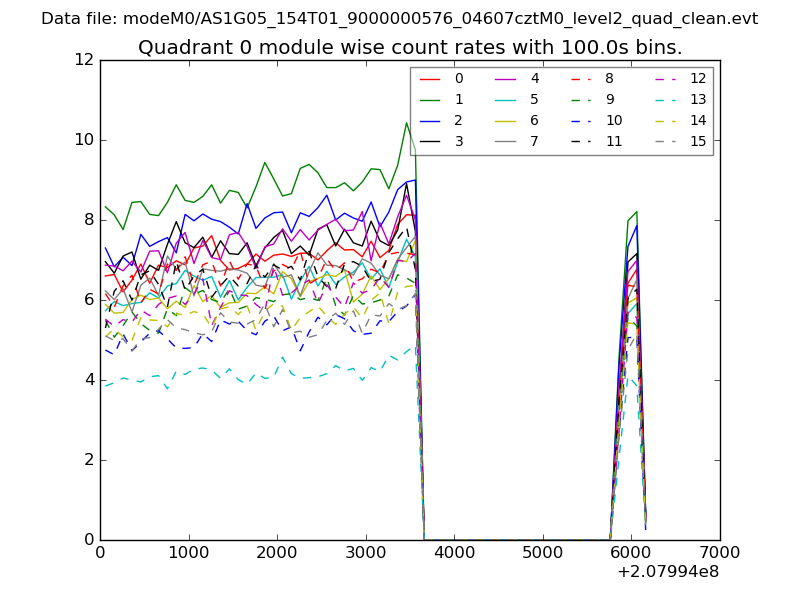
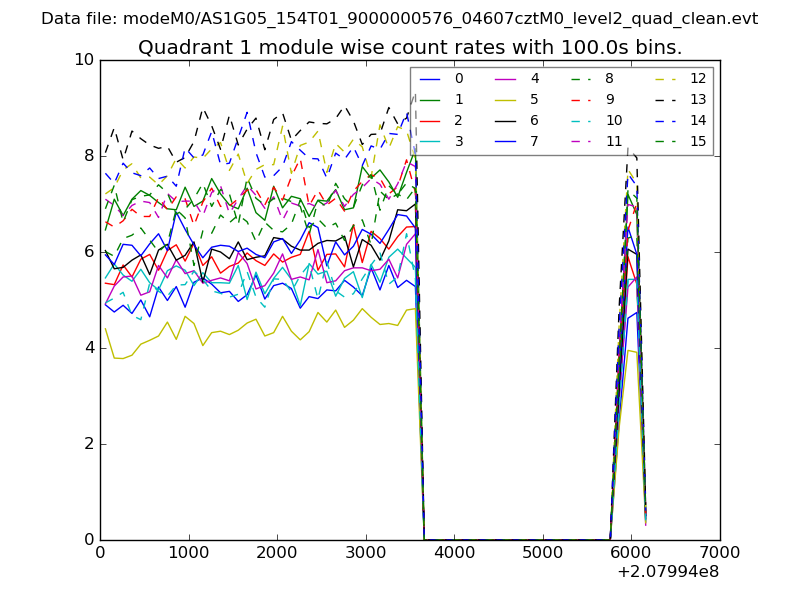
| Module-wise count rates for Quadrant A Data is divided into 100 sec bins |
 |
 |
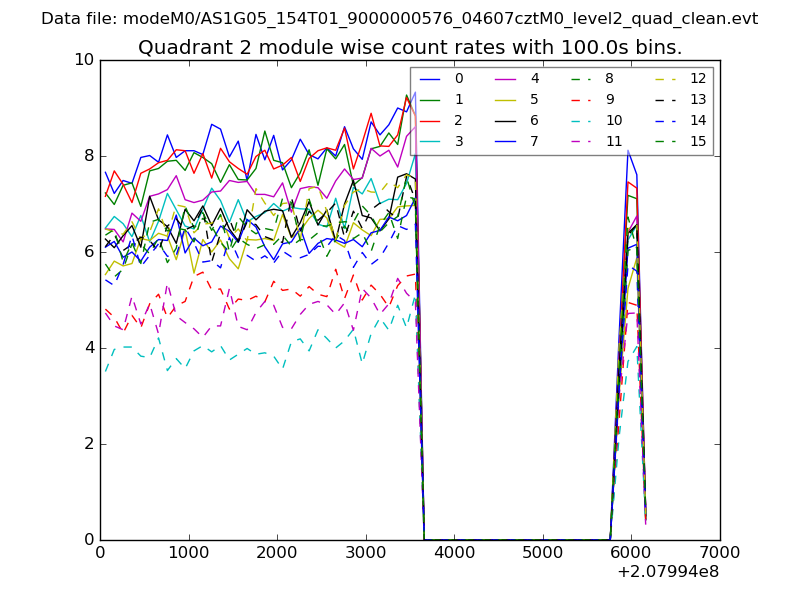
| Module-wise count rates for Quadrant B Data is divided into 100 sec bins |
 |
 |
| Module-wise count rates for Quadrant C Data is divided into 100 sec bins |
 |
 |
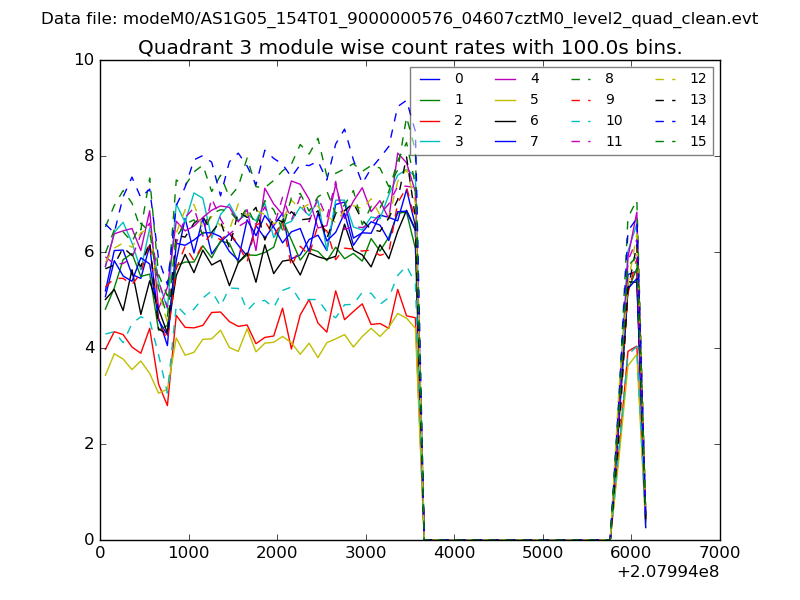
| Module-wise count rates for Quadrant D Data is divided into 100 sec bins |
 |
 |
| Parameter | Plot |
|---|---|
| CZT HV Monitor | 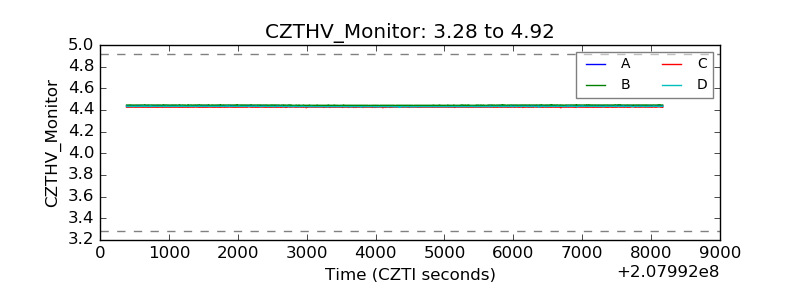 |
| D_VDD | 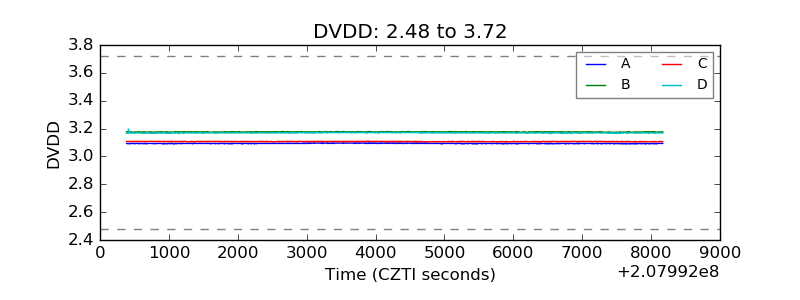 |
| Temperature 1 | 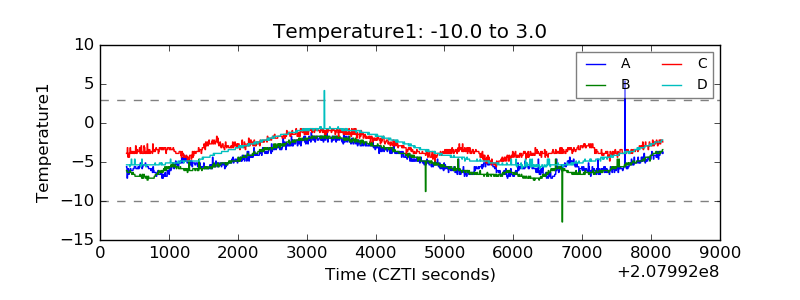 |
| Veto HV Monitor | 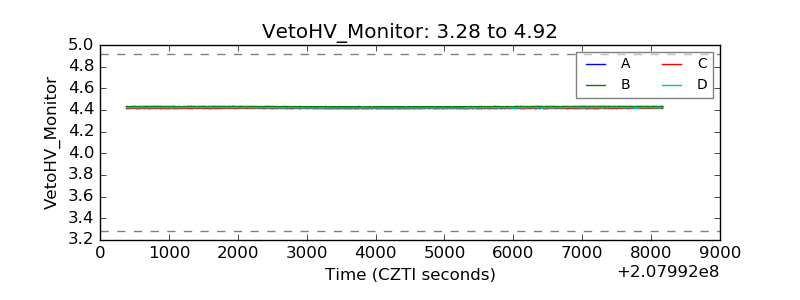 |
| Veto LLD | 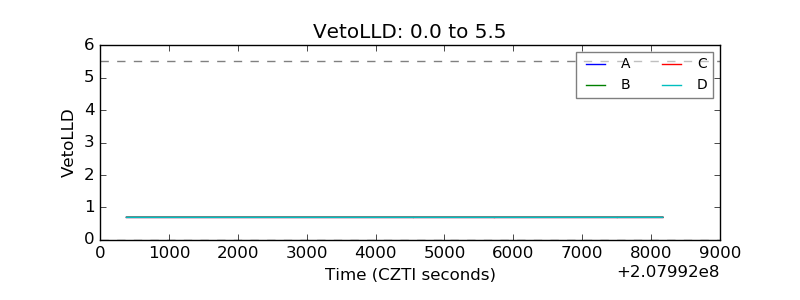 |
| Alpha Counter |  |
| _CPM_Rate | 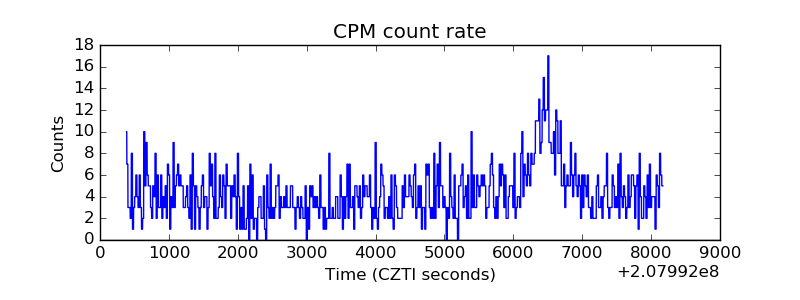 |
| CZT Counter | 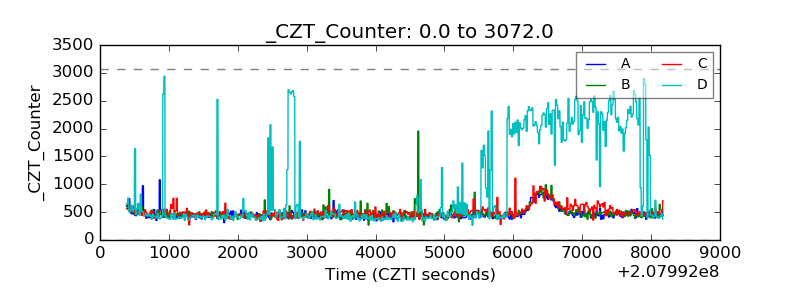 |
| +2.5 Volts monitor | 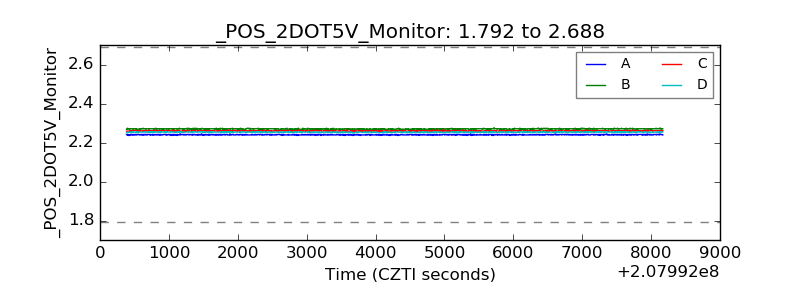 |
| +5 Volts monitor |  |
| _ROLL_ROT | 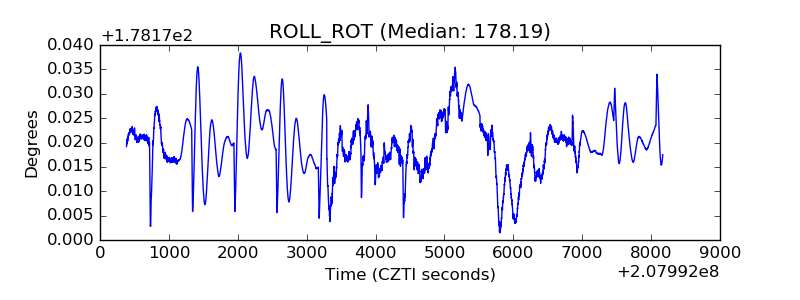 |
| _Roll_DEC | 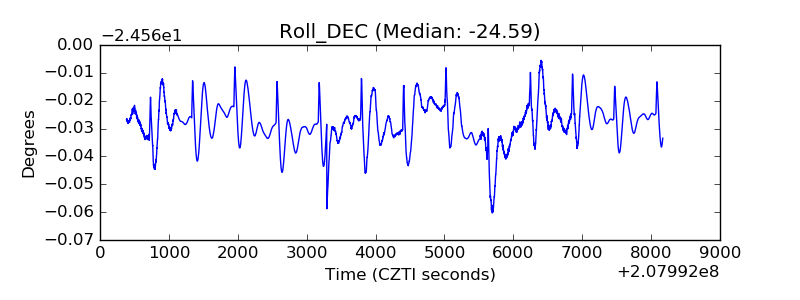 |
| _Roll_RA | 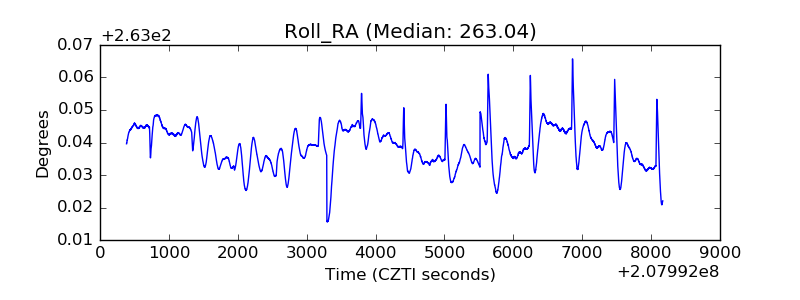 |
| Veto Counter | 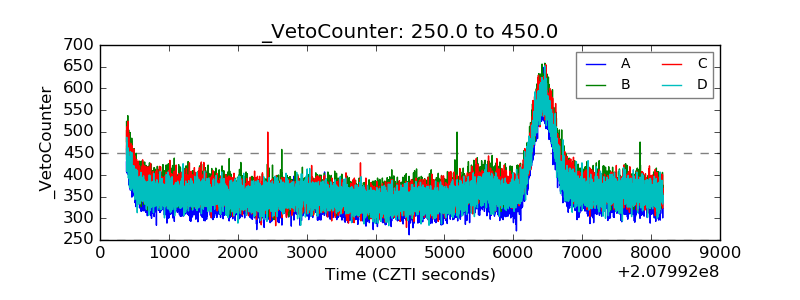 |