| Param | Original file | Final file |
|---|---|---|
| Filename | modeM0/AS1G05_154T01_9000000576_04611cztM0_level2.evt | modeM0/AS1G05_154T01_9000000576_04611cztM0_level2_quad_clean.evt |
| Size (bytes) | 979,381,440 | 121,449,600 |
| Size | 934.0 MB | 115.8 MB |
| Events in quadrant A | 5,723,812 | 766,533 |
| Events in quadrant B | 6,089,509 | 764,979 |
| Events in quadrant C | 5,692,060 | 767,597 |
| Events in quadrant D | 11,357,603 | 562,128 |
| Mode SS | |||
|---|---|---|---|
| Quadrant | BADHDUFLAG | Total packets | Discarded packets |
| A | 0 | 334 | 94 |
| B | 0 | 338 | 98 |
| C | 0 | 337 | 97 |
| D | 0 | 338 | 102 |
| Mode M9 | |||
|---|---|---|---|
| Quadrant | BADHDUFLAG | Total packets | Discarded packets |
| A | 0 | 19 | 4 |
| B | 0 | 19 | 4 |
| C | 0 | 18 | 3 |
| D | 0 | 17 | 1 |
| Mode M0 | |||
|---|---|---|---|
| Quadrant | BADHDUFLAG | Total packets | Discarded packets |
| A | 0 | 34334 | 9278 |
| B | 0 | 35765 | 10036 |
| C | 0 | 34004 | 9494 |
| D | 0 | 52000 | 9932 |
| Quadrant | Total seconds | Saturated seconds | Saturation percentage |
|---|---|---|---|
| A | 11785 | 183 | 1.552821% |
| B | 11773 | 235 | 1.996093% |
| C | 11797 | 86 | 0.728999% |
| D | 11787 | 2560 | 21.718843% |
Noise dominated data is calculated using 1-second bins in cleaned event files. If a bin has >2000 counts, and if more than 50% of those come from <1% of pixels, then it is considered to be noise-dominated and hence unusable.
| Quadrant | # 1 sec bins | Bins with >0 counts | Bins with >2000 counts | High rate bins dominated by noise | Noise dominated (total time) | Noise dominated (detector-on time) | Marked lightcurve |
|---|---|---|---|---|---|---|---|
| A | 20089 | 11964 | 29 | 29 | 0.14% | 0.24% | 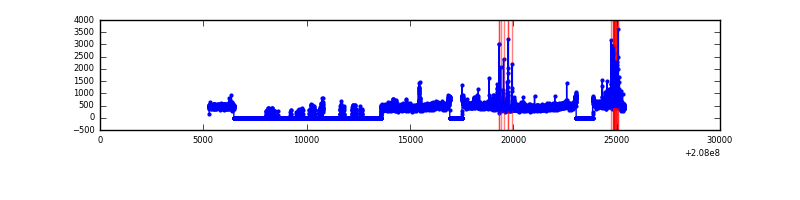 |
| B | 20089 | 11942 | 64 | 64 | 0.32% | 0.54% | 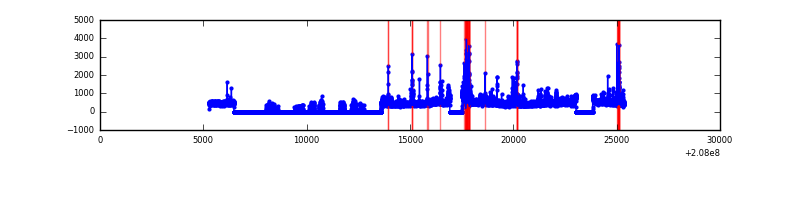 |
| C | 20089 | 11968 | 0 | 0 | 0.00% | 0.00% | 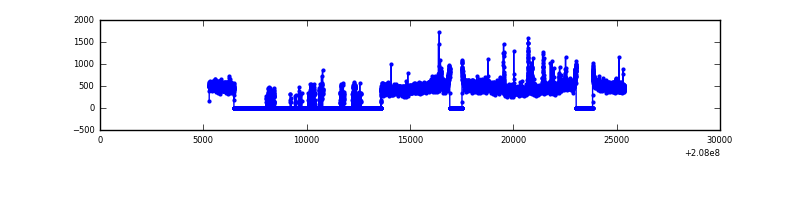 |
| D | 20089 | 11984 | 2093 | 2093 | 10.42% | 17.46% | 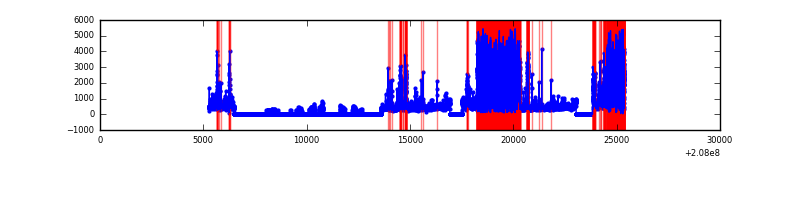 |
Top three noisy pixels from each quadrant. If the there are fewer than three noisy pixels in the level2.evt file, extra rows are filled as -1
| Pixel properties | Quadrant properties | ||||||
|---|---|---|---|---|---|---|---|
| Quadrant | DetID | PixID | Counts | Sigma | Mean | Median | Sigma |
| A | 0 | 118 | 195809 | 690.16 | 1373 | 1341 | 281.8 |
| A | 8 | 15 | 151991 | 534.65 | 1373 | 1341 | 281.8 |
| A | 0 | 226 | 32035 | 108.93 | 1373 | 1341 | 281.8 |
| B | 14 | 167 | 185117 | 689.7 | 1382 | 1349 | 266.4 |
| B | 10 | 16 | 179640 | 669.14 | 1382 | 1349 | 266.4 |
| B | 15 | 204 | 117911 | 437.47 | 1382 | 1349 | 266.4 |
| C | 14 | 48 | 352069 | 1117.86 | 1333 | 1335 | 313.8 |
| C | 7 | 247 | 59894 | 186.64 | 1333 | 1335 | 313.8 |
| C | 9 | 54 | 48929 | 151.69 | 1333 | 1335 | 313.8 |
| D | 8 | 112 | 6030905 | 21498.21 | 1155 | 1121 | 280.5 |
| D | 13 | 235 | 463180 | 1647.4 | 1155 | 1121 | 280.5 |
| D | 12 | 217 | 104103 | 367.17 | 1155 | 1121 | 280.5 |
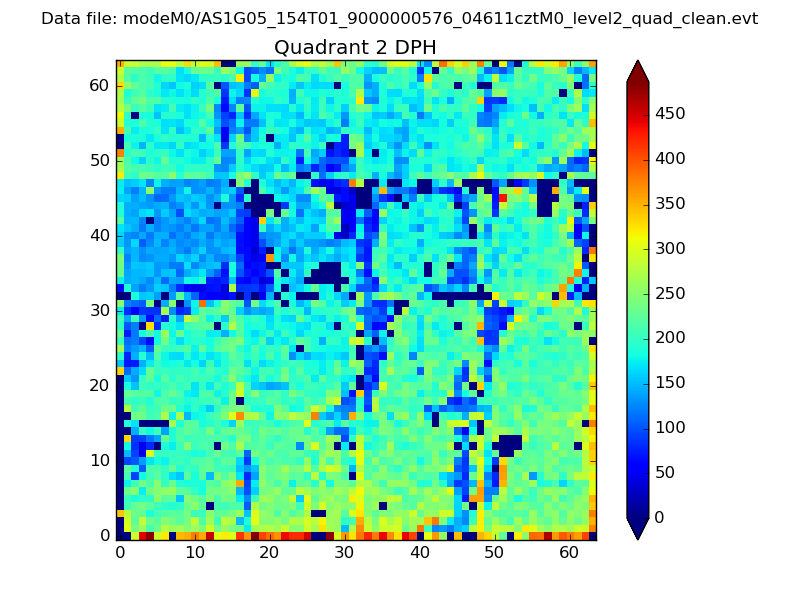
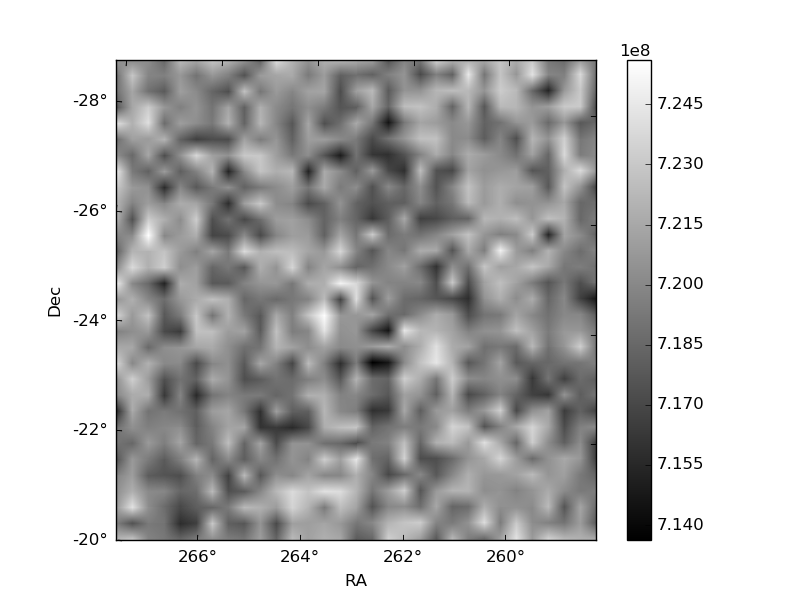
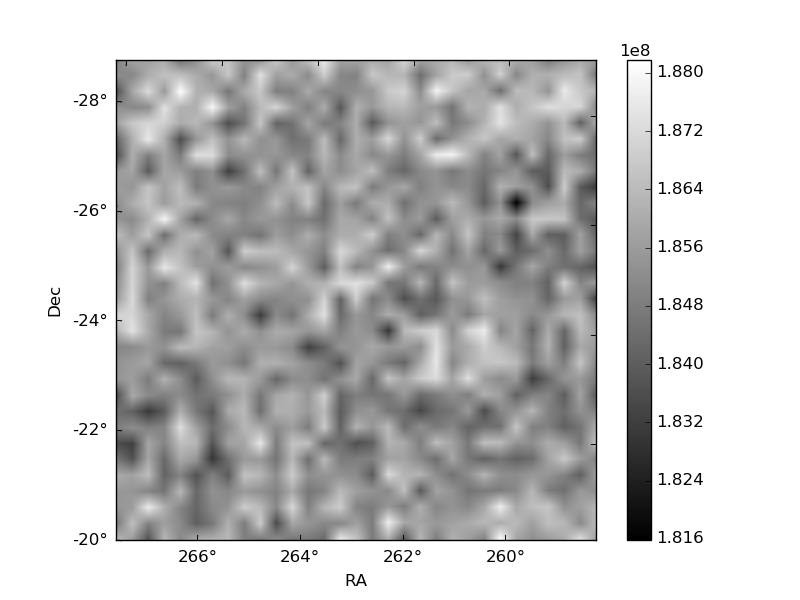
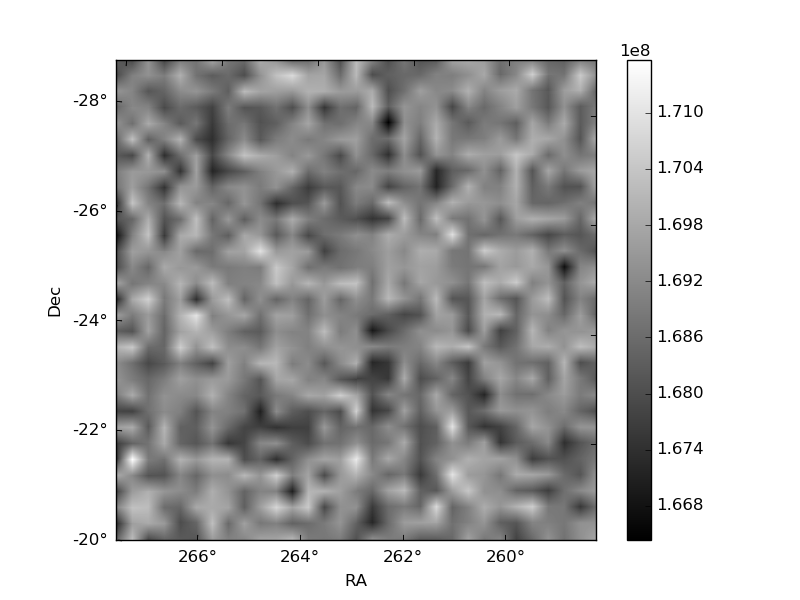
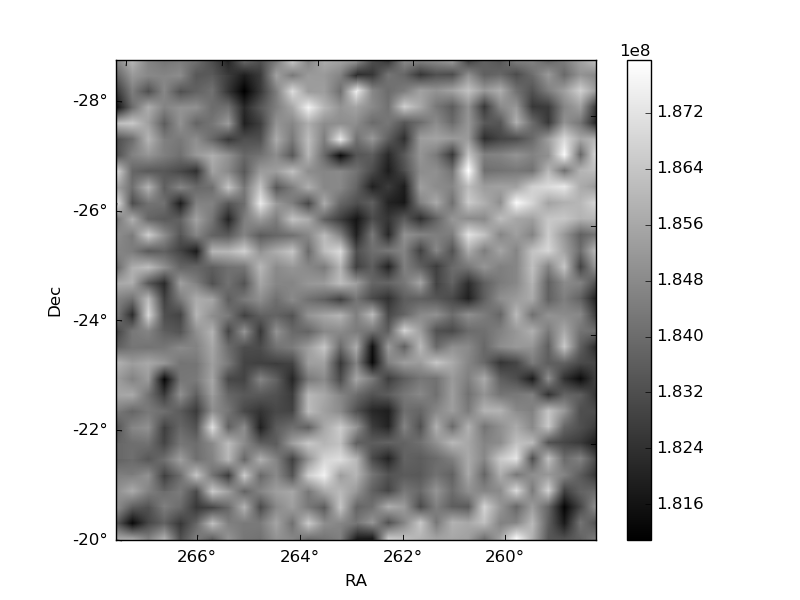
Histogram calculated using DETX and DETY for each event in the final _common_clean file
| Quadrant A | 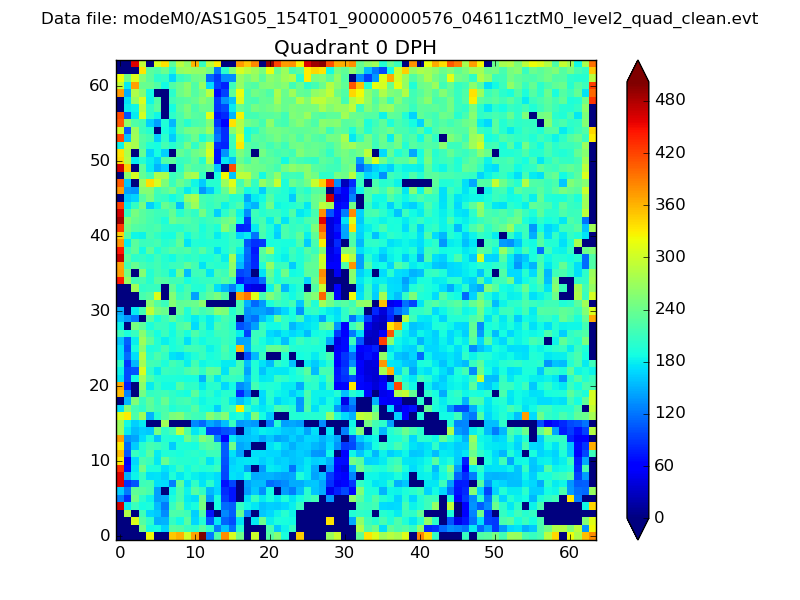 |
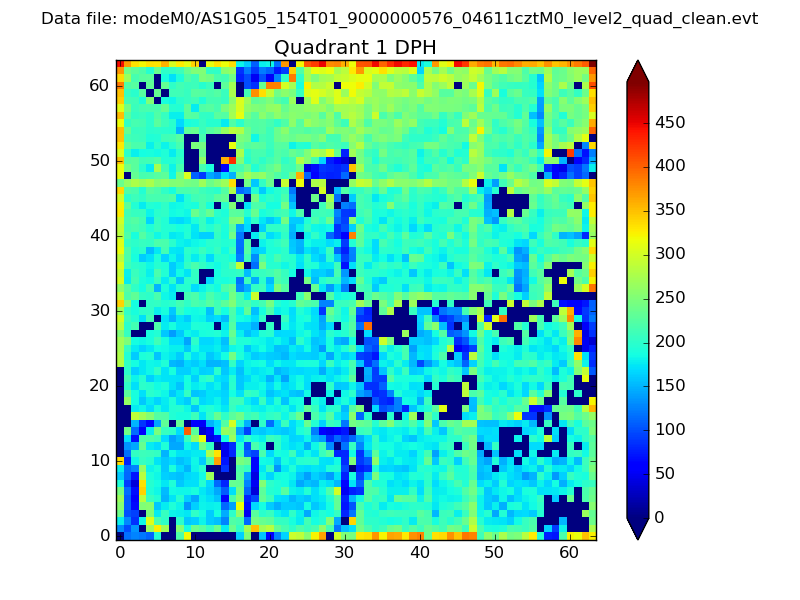 |
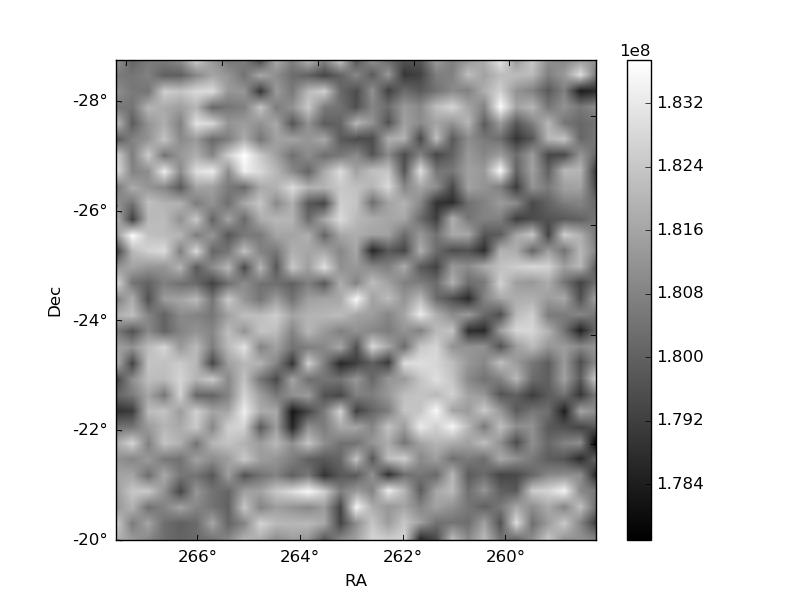
Quadrant B |
|---|---|---|---|
| Quadrant D | 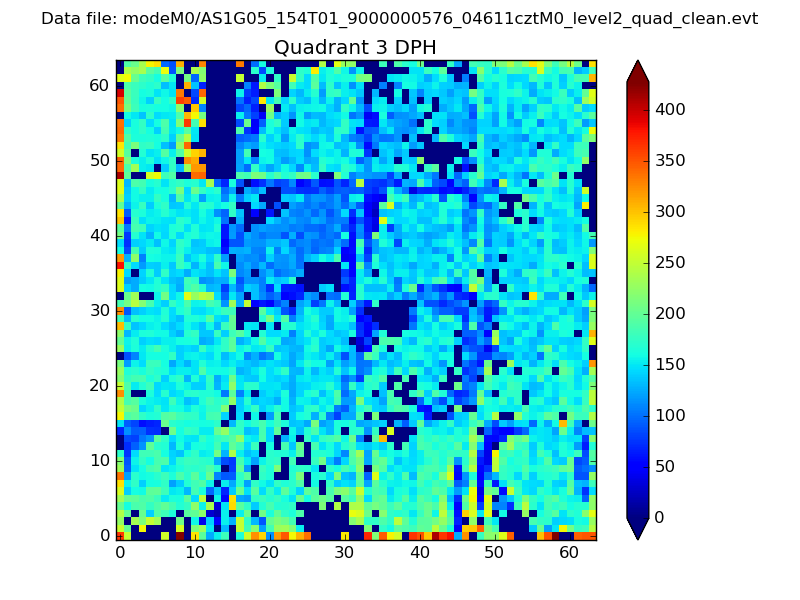 |
 |
Quadrant C |
| Plot type | Count rate plots | Images |
|---|---|---|
| Comparison with Poisson distribution Blue bars denote a histogram of data divided into 1 sec bins. Red curve is a Poisson curve with rate = median count rate of data. |
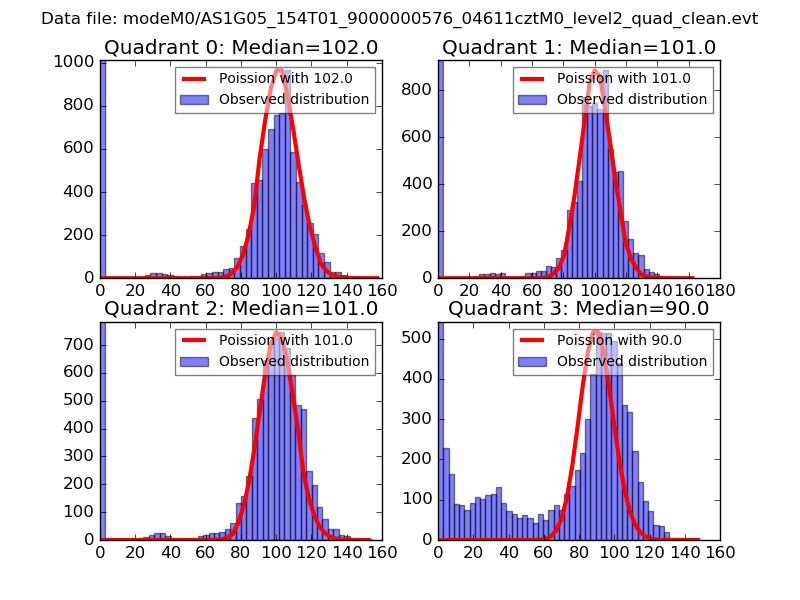 |
 |
| Quadrant-wise count rates Data is divided into 100 sec bins |
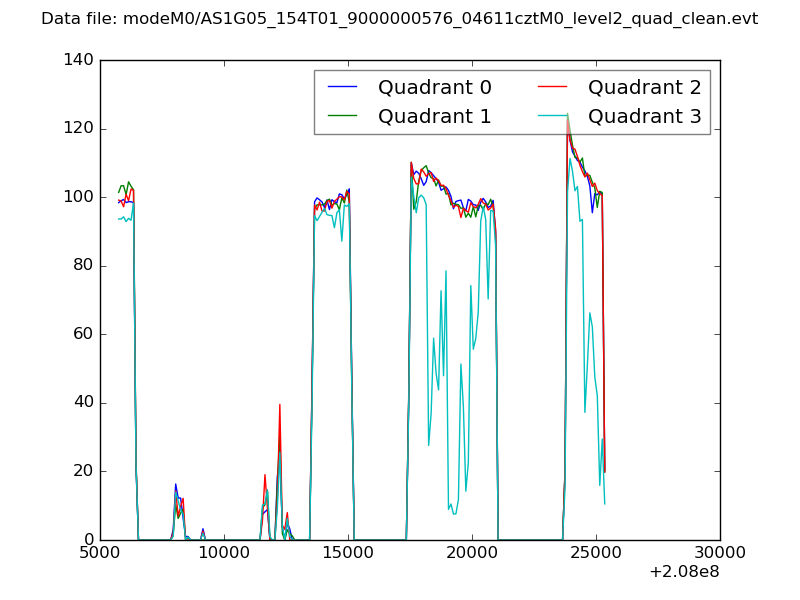 |
|
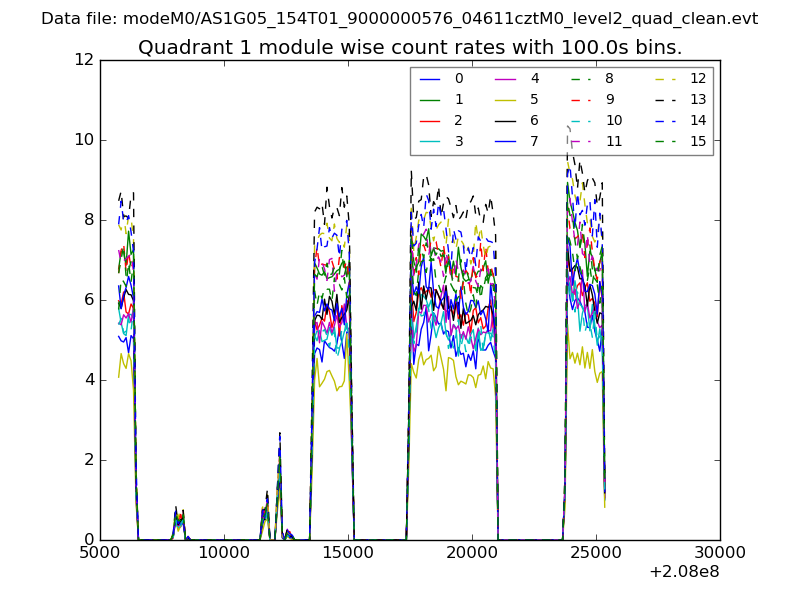
| Module-wise count rates for Quadrant A Data is divided into 100 sec bins |
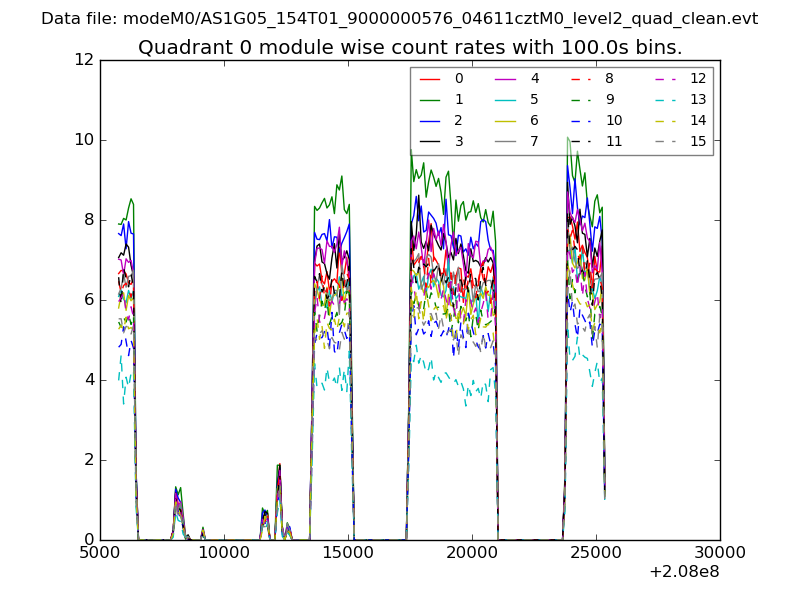 |
 |
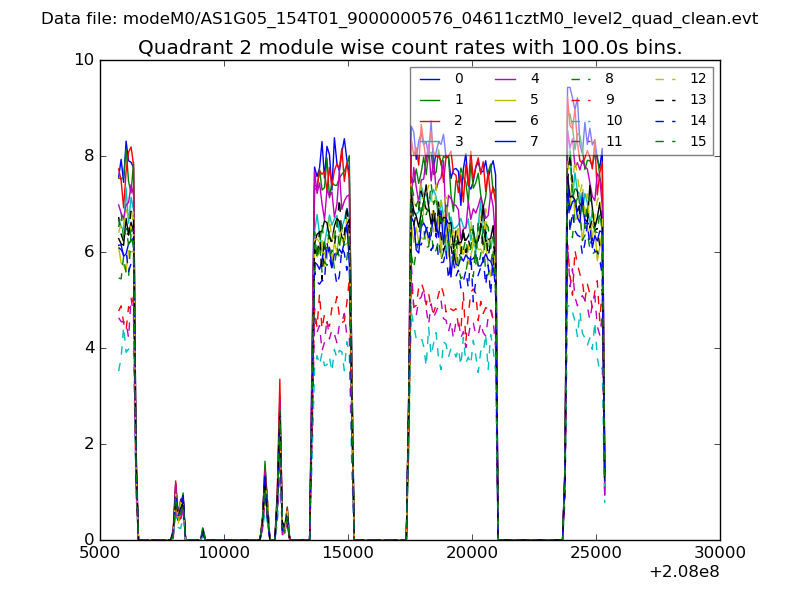
| Module-wise count rates for Quadrant B Data is divided into 100 sec bins |
 |
 |
| Module-wise count rates for Quadrant C Data is divided into 100 sec bins |
 |
 |
| Module-wise count rates for Quadrant D Data is divided into 100 sec bins |
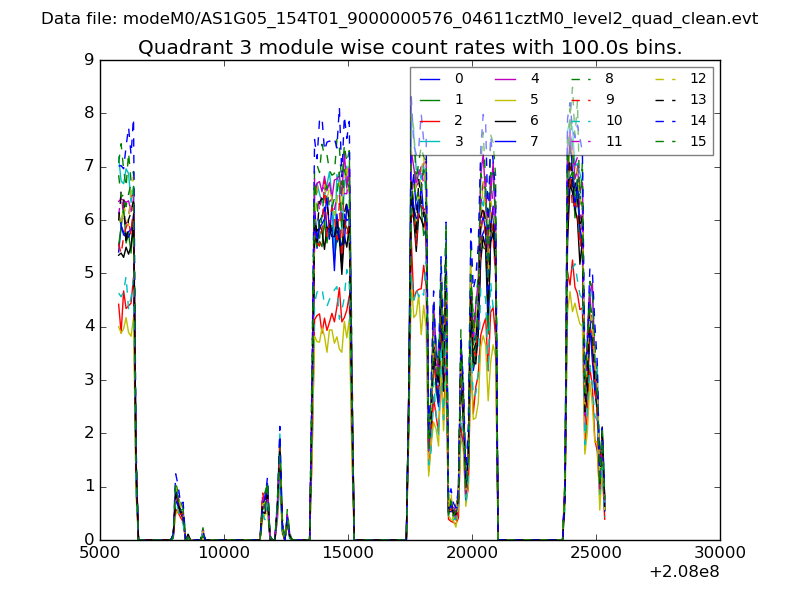 |
 |
| Parameter | Plot |
|---|---|
| CZT HV Monitor | 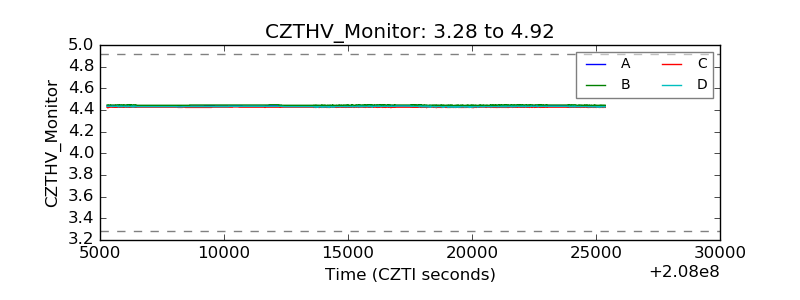 |
| D_VDD | 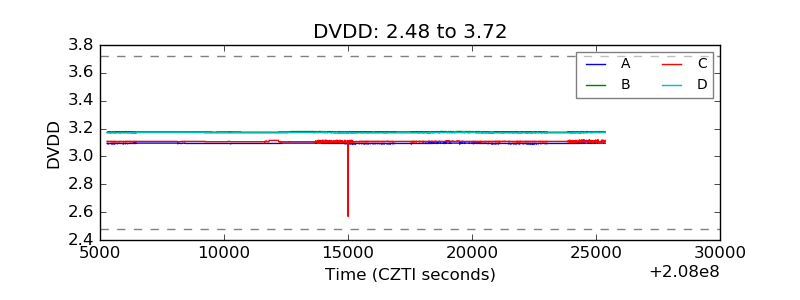 |
| Temperature 1 | 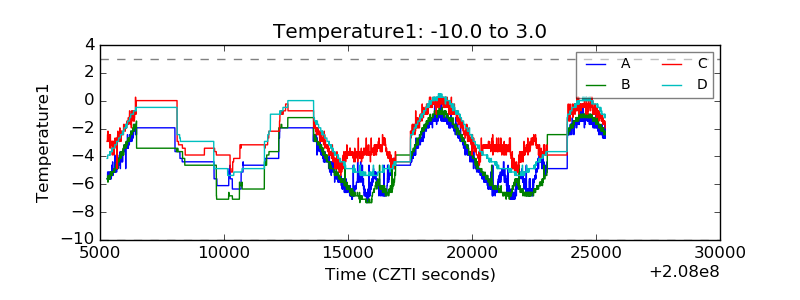 |
| Veto HV Monitor | 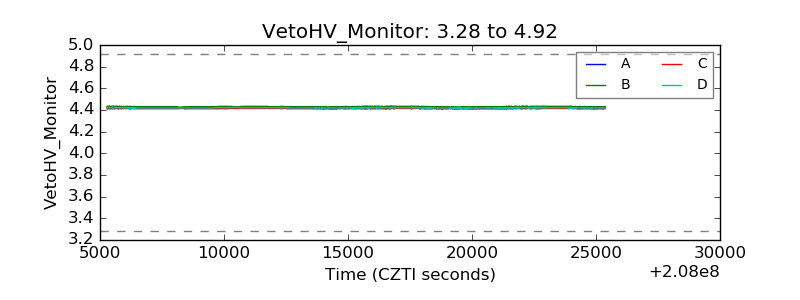 |
| Veto LLD | 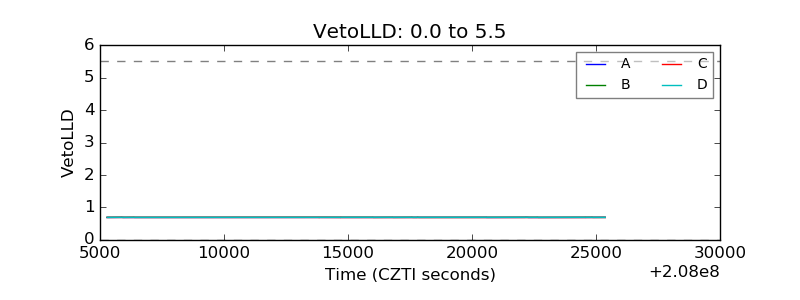 |
| Alpha Counter | 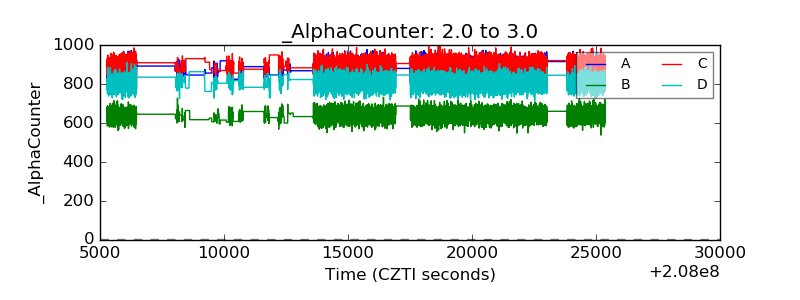 |
| _CPM_Rate | 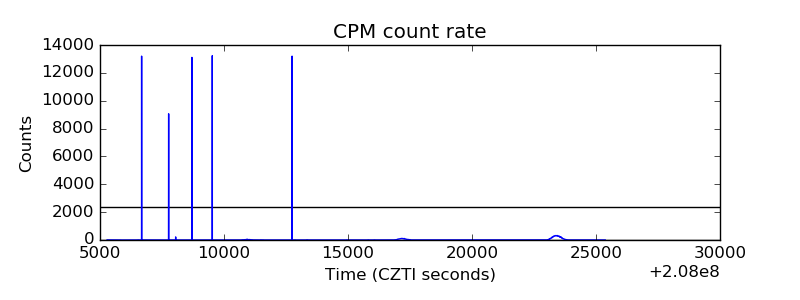 |
| CZT Counter | 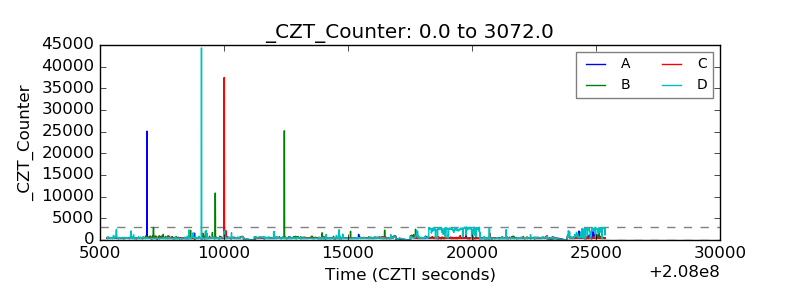 |
| +2.5 Volts monitor |  |
| +5 Volts monitor |  |
| _ROLL_ROT | 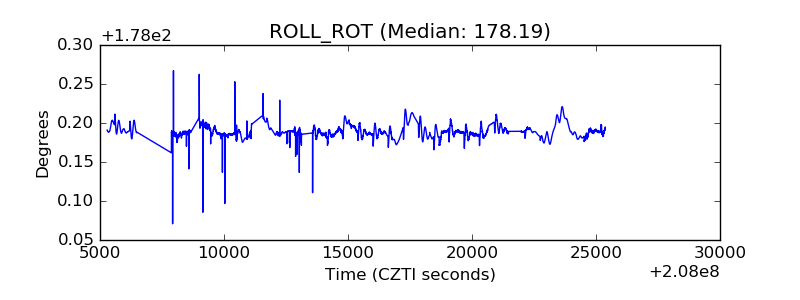 |
| _Roll_DEC |  |
| _Roll_RA | 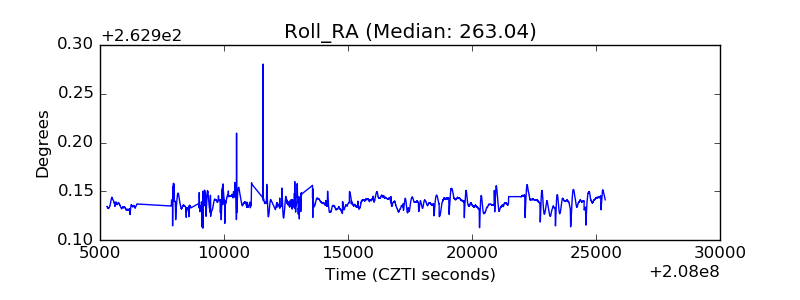 |
| Veto Counter | 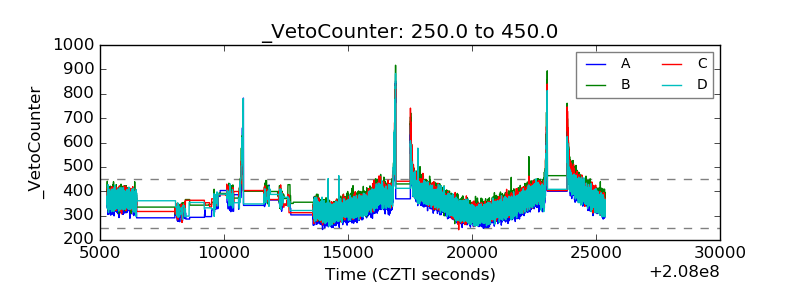 |