| Param | Original file | Final file |
|---|---|---|
| Filename | modeM0/AS1G05_154T01_9000000576_04612cztM0_level2.evt | modeM0/AS1G05_154T01_9000000576_04612cztM0_level2_quad_clean.evt |
| Size (bytes) | 1,894,348,800 | 244,517,760 |
| Size | 1.8 GB | 233.2 MB |
| Events in quadrant A | 10,915,498 | 1,539,665 |
| Events in quadrant B | 12,066,678 | 1,530,485 |
| Events in quadrant C | 10,930,480 | 1,533,116 |
| Events in quadrant D | 21,919,153 | 1,231,920 |
| Mode SS | |||
|---|---|---|---|
| Quadrant | BADHDUFLAG | Total packets | Discarded packets |
| A | 0 | 462 | 0 |
| B | 0 | 462 | 0 |
| C | 0 | 462 | 0 |
| D | 0 | 462 | 0 |
| Mode M9 | |||
|---|---|---|---|
| Quadrant | BADHDUFLAG | Total packets | Discarded packets |
| A | 0 | 29 | 0 |
| B | 0 | 29 | 0 |
| C | 0 | 29 | 0 |
| D | 0 | 29 | 0 |
| Mode M0 | |||
|---|---|---|---|
| Quadrant | BADHDUFLAG | Total packets | Discarded packets |
| A | 0 | 48216 | 5 |
| B | 0 | 50745 | 4 |
| C | 0 | 47485 | 4 |
| D | 0 | 81289 | 12 |
| Quadrant | Total seconds | Saturated seconds | Saturation percentage |
|---|---|---|---|
| A | 22799 | 338 | 1.482521% |
| B | 22799 | 453 | 1.986929% |
| C | 22799 | 168 | 0.736874% |
| D | 22798 | 4781 | 20.971138% |
Noise dominated data is calculated using 1-second bins in cleaned event files. If a bin has >2000 counts, and if more than 50% of those come from <1% of pixels, then it is considered to be noise-dominated and hence unusable.
| Quadrant | # 1 sec bins | Bins with >0 counts | Bins with >2000 counts | High rate bins dominated by noise | Noise dominated (total time) | Noise dominated (detector-on time) | Marked lightcurve |
|---|---|---|---|---|---|---|---|
| A | 25594 | 22803 | 42 | 42 | 0.16% | 0.18% |  |
| B | 25594 | 22803 | 136 | 136 | 0.53% | 0.60% |  |
| C | 25594 | 22803 | 5 | 5 | 0.02% | 0.02% |  |
| D | 25594 | 22803 | 3864 | 3864 | 15.10% | 16.95% |  |
Top three noisy pixels from each quadrant. If the there are fewer than three noisy pixels in the level2.evt file, extra rows are filled as -1
| Pixel properties | Quadrant properties | ||||||
|---|---|---|---|---|---|---|---|
| Quadrant | DetID | PixID | Counts | Sigma | Mean | Median | Sigma |
| A | 8 | 15 | 345948 | 636.68 | 2638 | 2582 | 539.3 |
| A | 0 | 118 | 295322 | 542.81 | 2638 | 2582 | 539.3 |
| A | 0 | 226 | 54017 | 95.37 | 2638 | 2582 | 539.3 |
| B | 15 | 204 | 423146 | 826.23 | 2656 | 2596 | 509.0 |
| B | 14 | 167 | 397296 | 775.45 | 2656 | 2596 | 509.0 |
| B | 10 | 16 | 287272 | 559.29 | 2656 | 2596 | 509.0 |
| C | 14 | 48 | 676868 | 1129.83 | 2551 | 2557 | 596.8 |
| C | 9 | 54 | 136447 | 224.34 | 2551 | 2557 | 596.8 |
| C | 7 | 247 | 66773 | 107.6 | 2551 | 2557 | 596.8 |
| D | 8 | 112 | 11892323 | 22012.65 | 2230 | 2164 | 540.2 |
| D | 13 | 235 | 711528 | 1313.27 | 2230 | 2164 | 540.2 |
| D | 2 | 136 | 240510 | 441.26 | 2230 | 2164 | 540.2 |
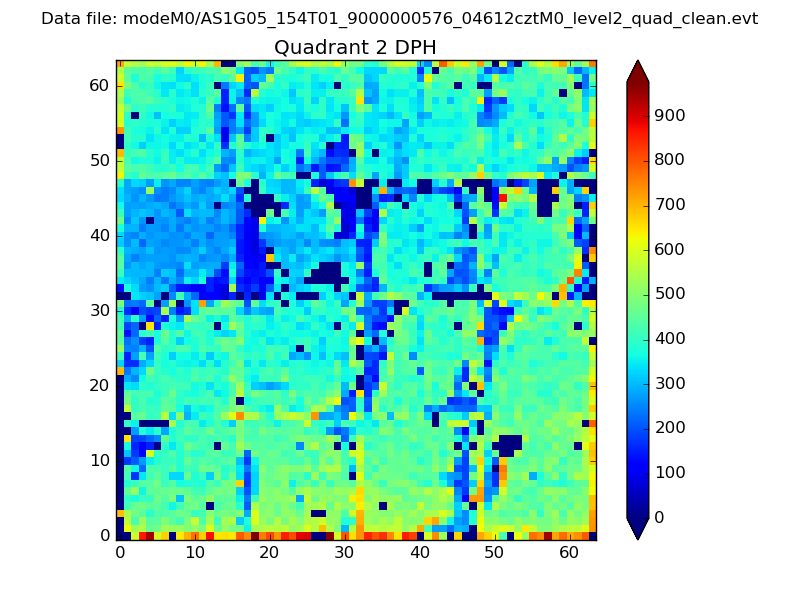
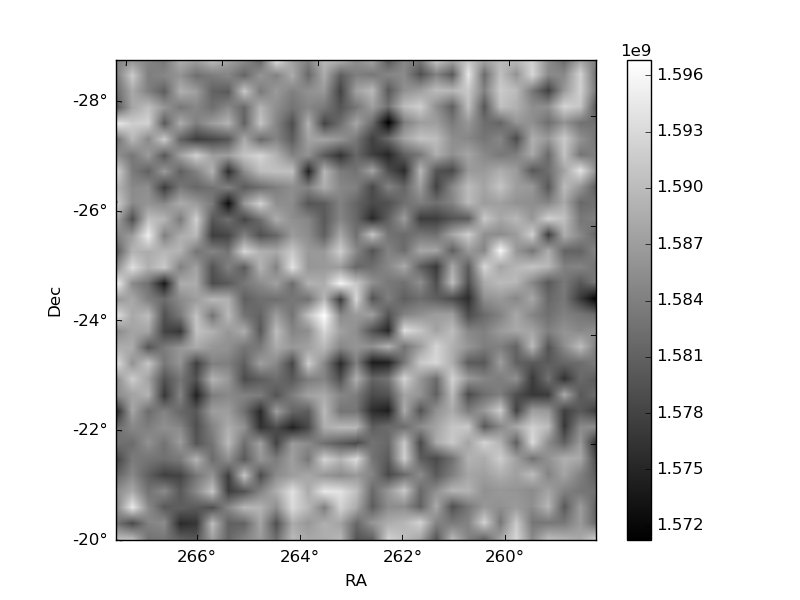
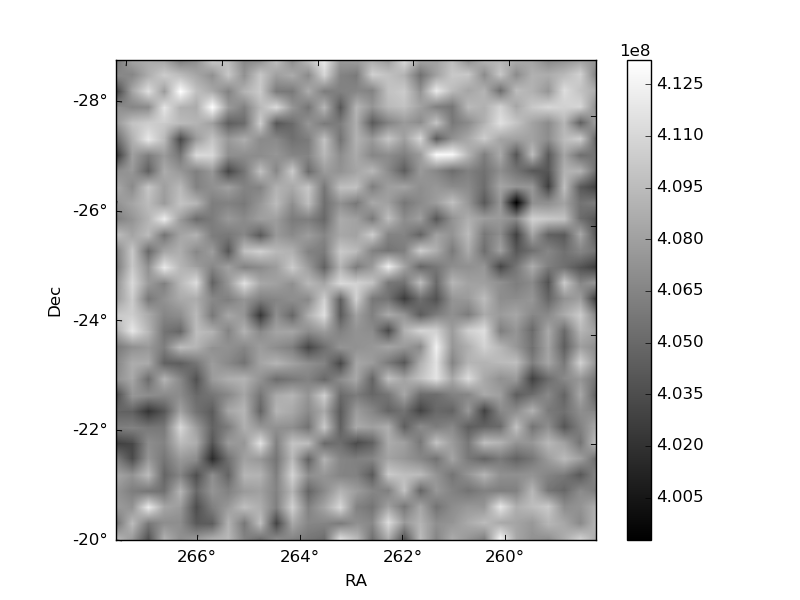
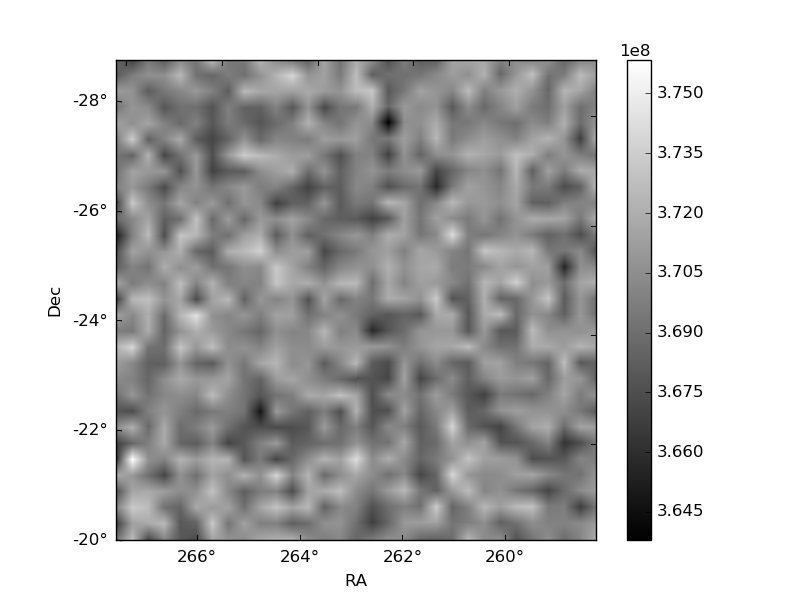
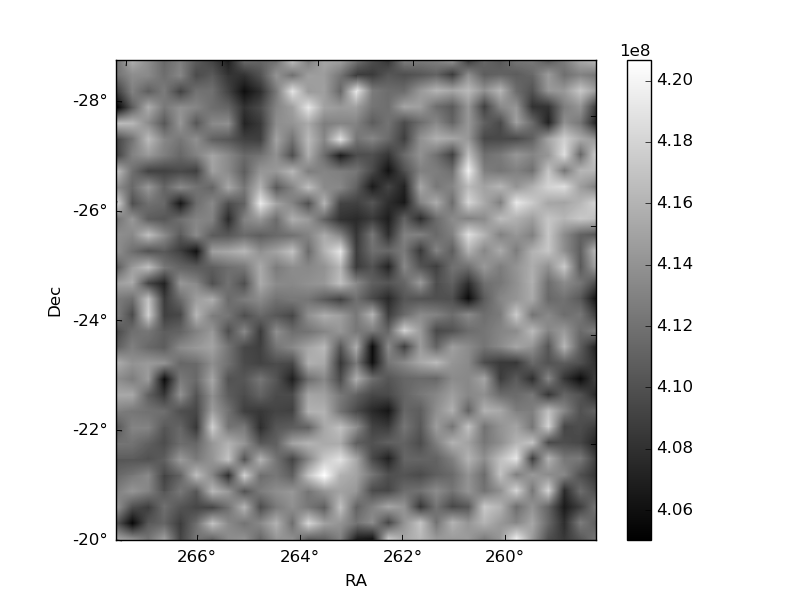
Histogram calculated using DETX and DETY for each event in the final _common_clean file
| Quadrant A | 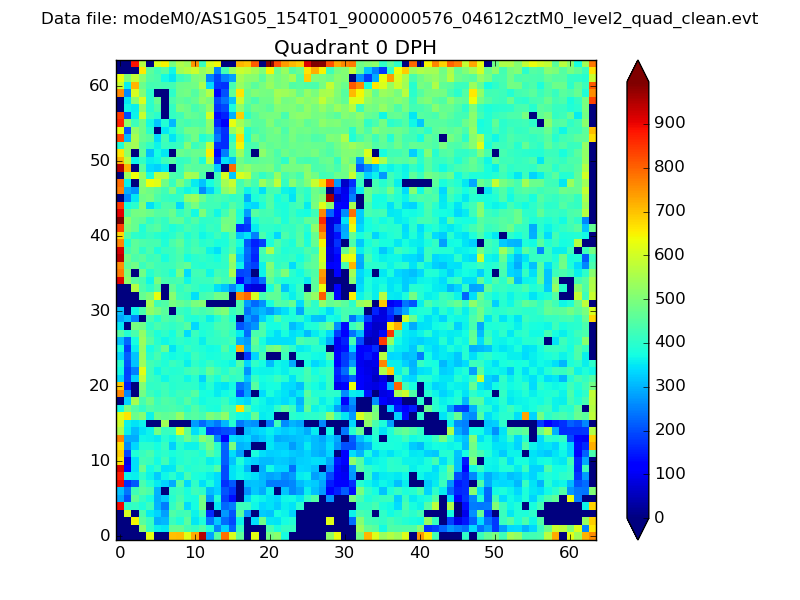 |
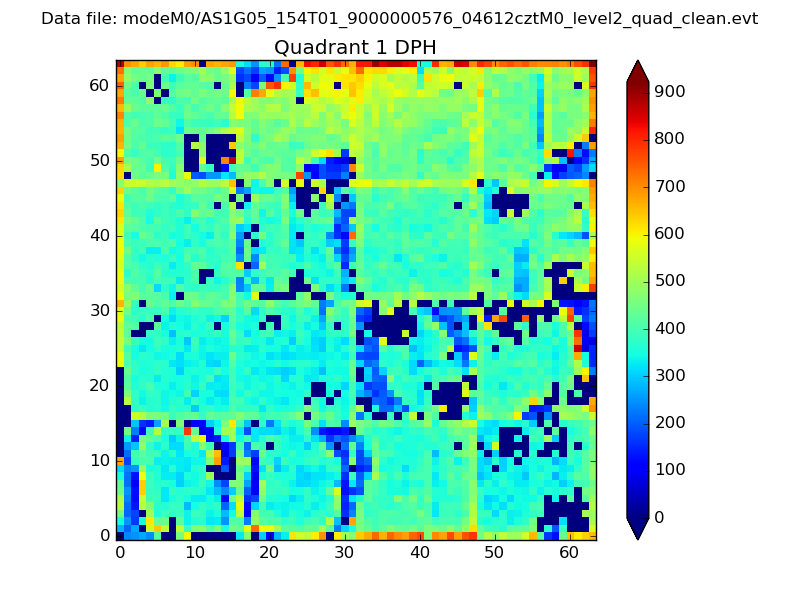 |
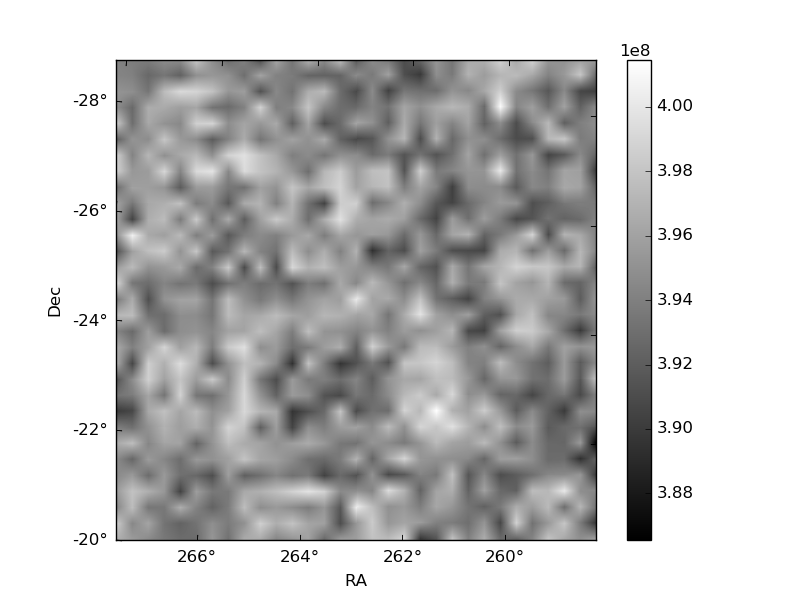
Quadrant B |
|---|---|---|---|
| Quadrant D | 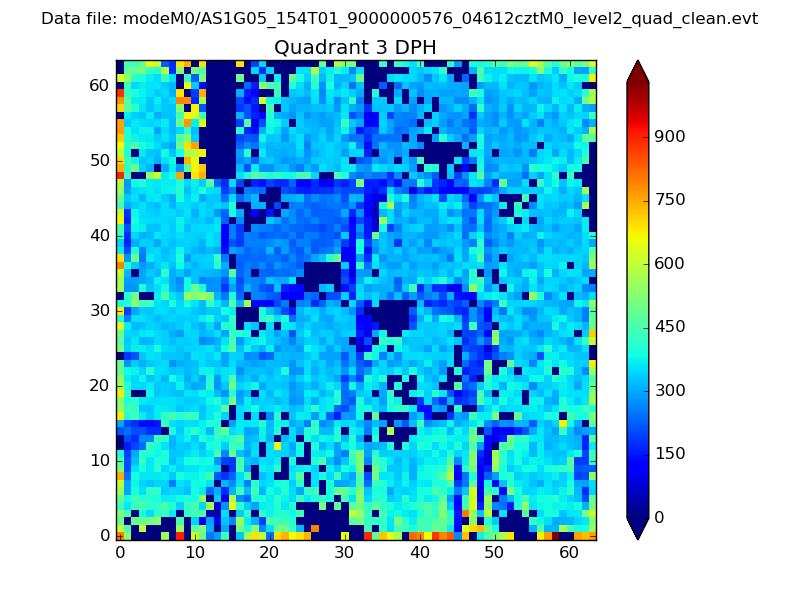 |
 |
Quadrant C |
| Plot type | Count rate plots | Images |
|---|---|---|
| Comparison with Poisson distribution Blue bars denote a histogram of data divided into 1 sec bins. Red curve is a Poisson curve with rate = median count rate of data. |
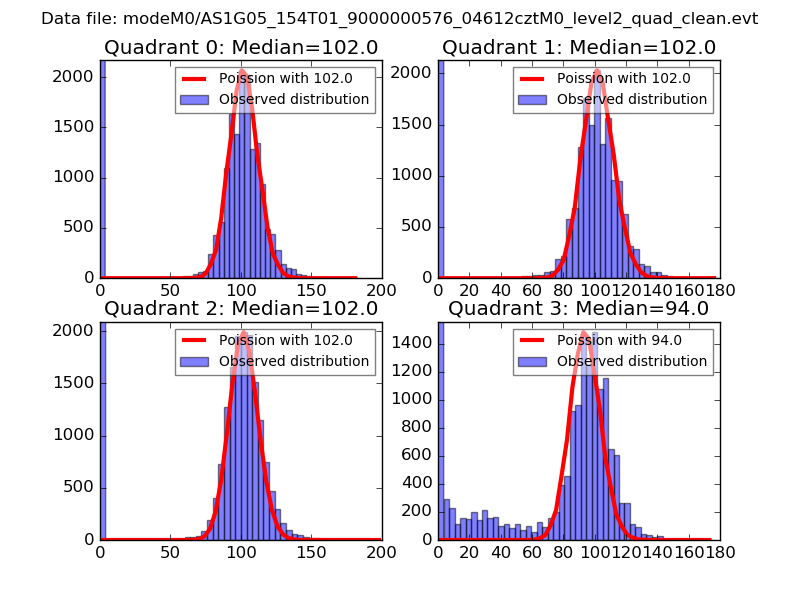 |
 |
| Quadrant-wise count rates Data is divided into 100 sec bins |
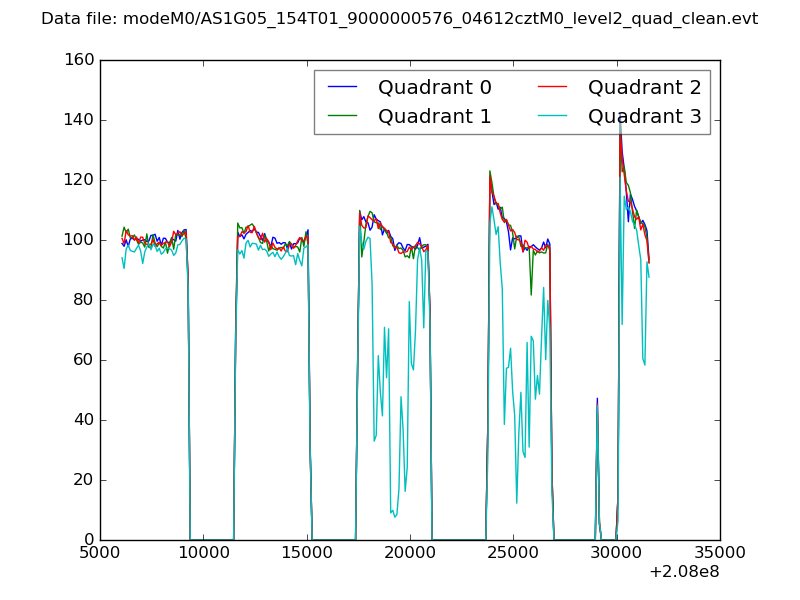 |
|
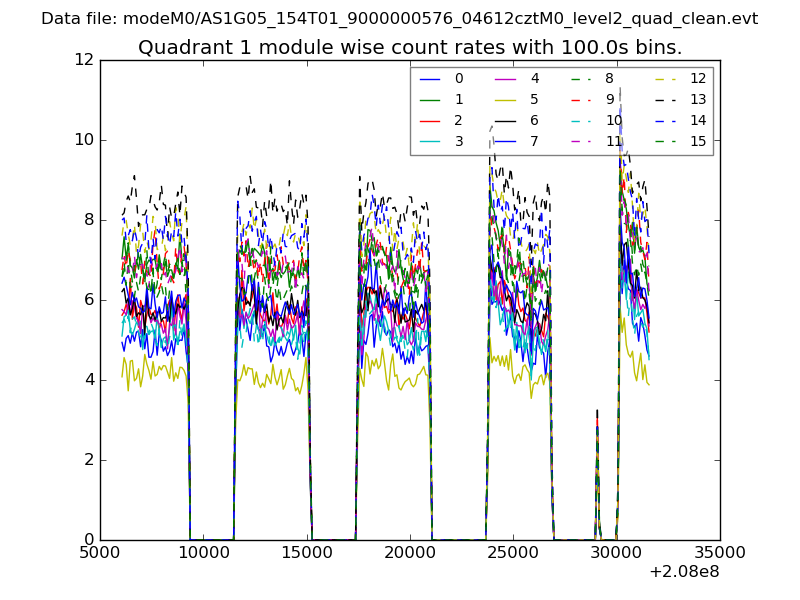
| Module-wise count rates for Quadrant A Data is divided into 100 sec bins |
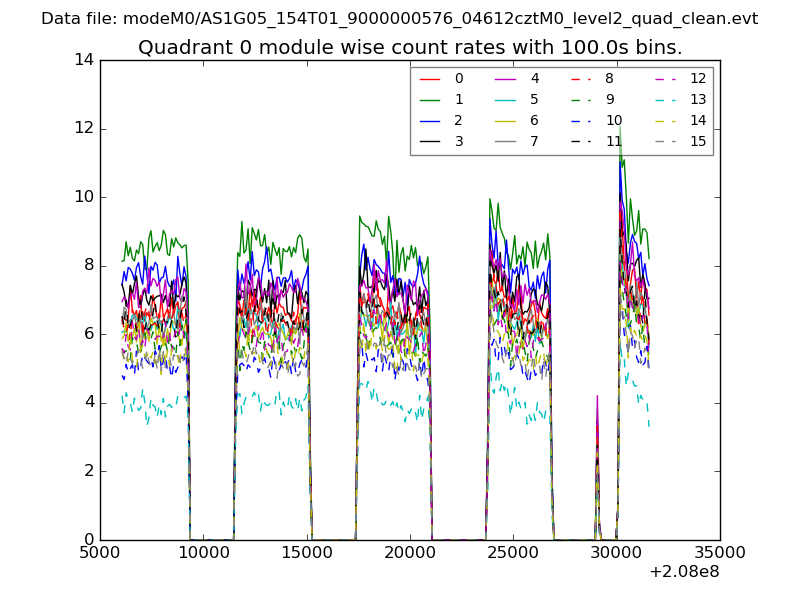 |
 |
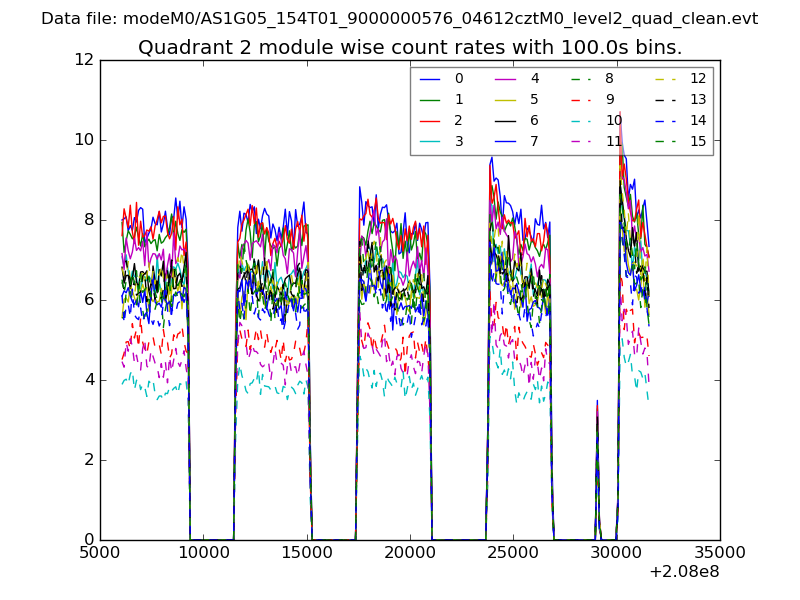
| Module-wise count rates for Quadrant B Data is divided into 100 sec bins |
 |
 |
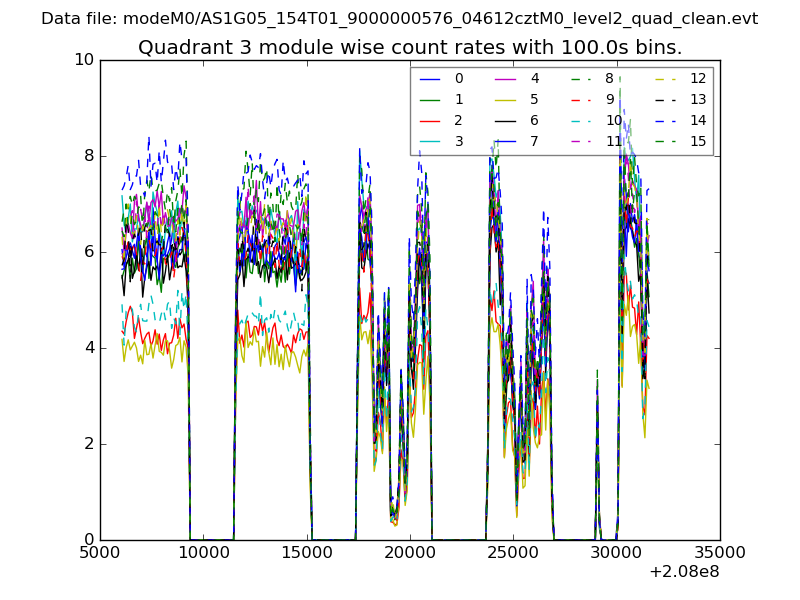
| Module-wise count rates for Quadrant C Data is divided into 100 sec bins |
 |
 |
| Module-wise count rates for Quadrant D Data is divided into 100 sec bins |
 |
 |
| Parameter | Plot |
|---|---|
| CZT HV Monitor | 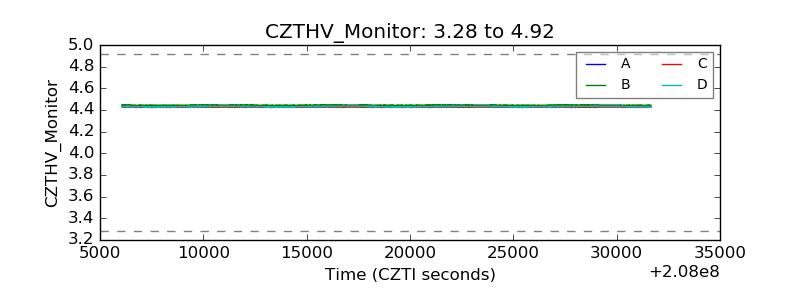 |
| D_VDD | 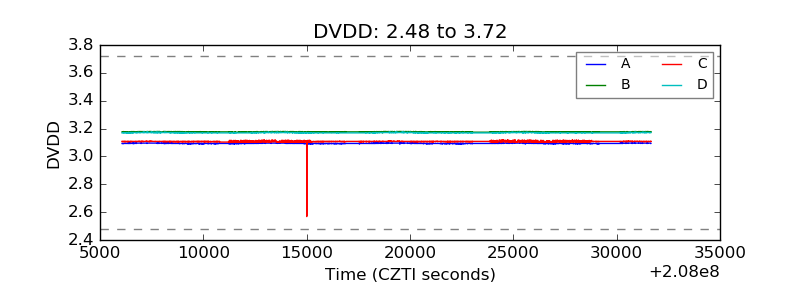 |
| Temperature 1 | 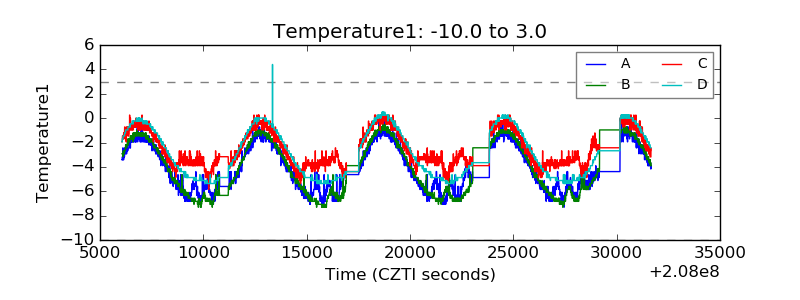 |
| Veto HV Monitor | 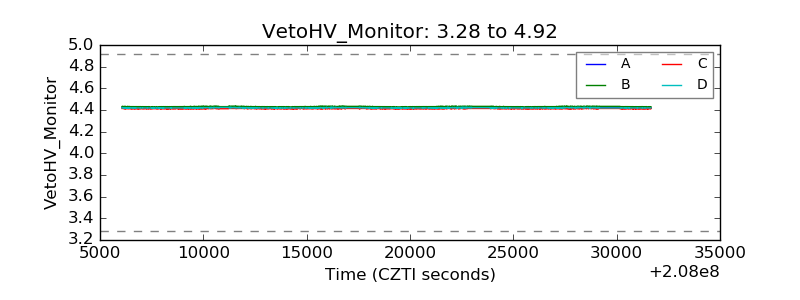 |
| Veto LLD | 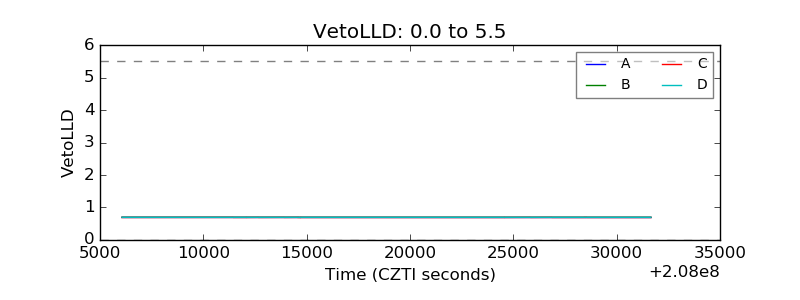 |
| Alpha Counter | 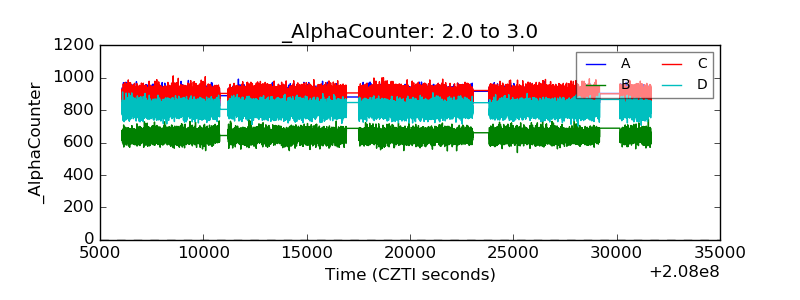 |
| _CPM_Rate | 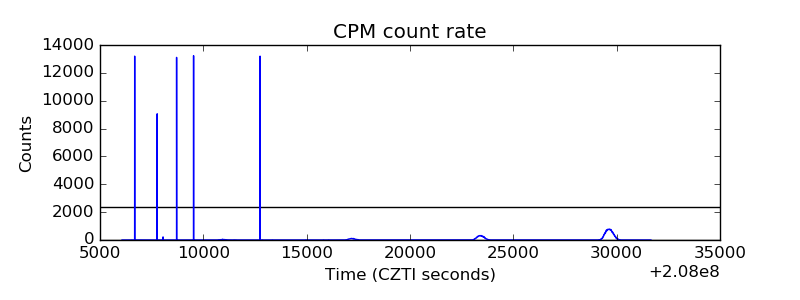 |
| CZT Counter | 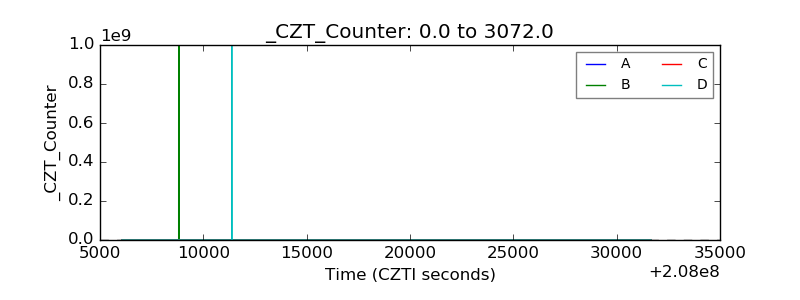 |
| +2.5 Volts monitor |  |
| +5 Volts monitor | 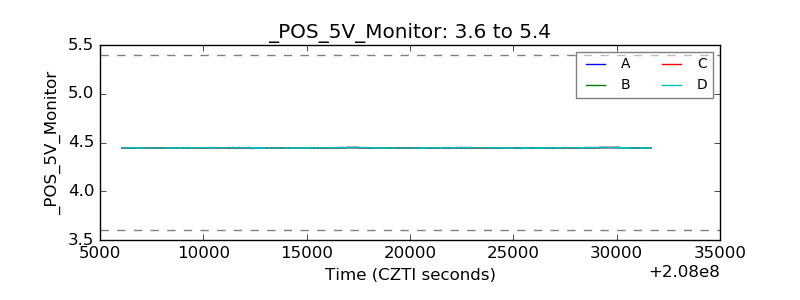 |
| _ROLL_ROT | 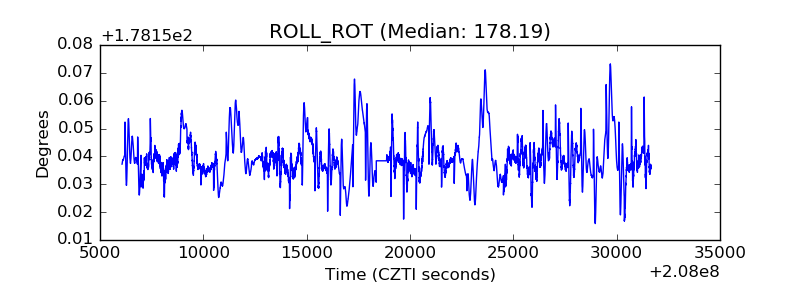 |
| _Roll_DEC | 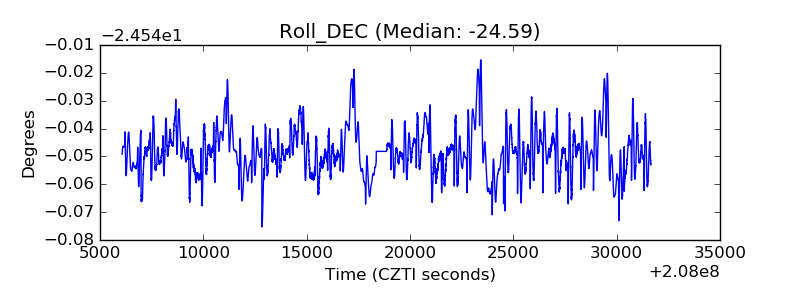 |
| _Roll_RA | 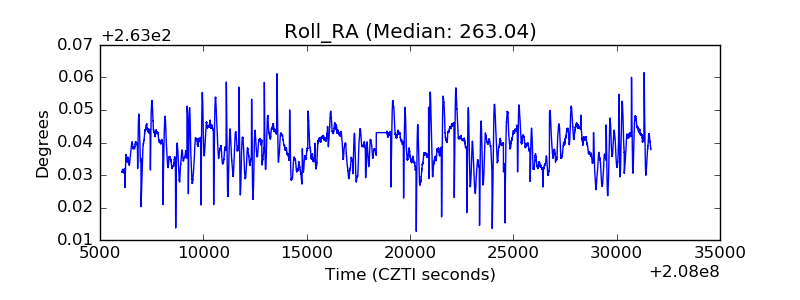 |
| Veto Counter | 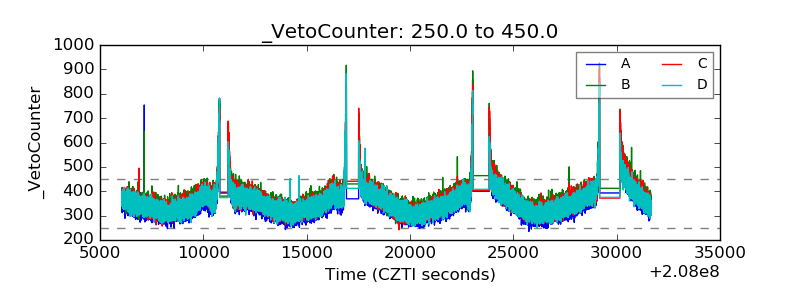 |