| Param | Original file | Final file |
|---|---|---|
| Filename | modeM0/AS1G05_154T01_9000000576_04614cztM0_level2.evt | modeM0/AS1G05_154T01_9000000576_04614cztM0_level2_quad_clean.evt |
| Size (bytes) | 568,612,800 | 76,256,640 |
| Size | 542.3 MB | 72.7 MB |
| Events in quadrant A | 3,574,081 | 478,308 |
| Events in quadrant B | 4,264,481 | 480,592 |
| Events in quadrant C | 3,308,254 | 480,057 |
| Events in quadrant D | 5,631,933 | 415,334 |
| Mode SS | |||
|---|---|---|---|
| Quadrant | BADHDUFLAG | Total packets | Discarded packets |
| A | 0 | 132 | 0 |
| B | 0 | 132 | 0 |
| C | 0 | 132 | 0 |
| D | 0 | 132 | 0 |
| Mode M9 | |||
|---|---|---|---|
| Quadrant | BADHDUFLAG | Total packets | Discarded packets |
| A | 0 | 14 | 0 |
| B | 0 | 14 | 0 |
| C | 0 | 14 | 0 |
| D | 0 | 15 | 0 |
| Mode M0 | |||
|---|---|---|---|
| Quadrant | BADHDUFLAG | Total packets | Discarded packets |
| A | 0 | 15141 | 3 |
| B | 0 | 16965 | 2 |
| C | 0 | 14101 | 2 |
| D | 0 | 21247 | 2 |
| Quadrant | Total seconds | Saturated seconds | Saturation percentage |
|---|---|---|---|
| A | 6513 | 200 | 3.070782% |
| B | 6513 | 328 | 5.036082% |
| C | 6513 | 28 | 0.429909% |
| D | 6513 | 845 | 12.974052% |
Noise dominated data is calculated using 1-second bins in cleaned event files. If a bin has >2000 counts, and if more than 50% of those come from <1% of pixels, then it is considered to be noise-dominated and hence unusable.
| Quadrant | # 1 sec bins | Bins with >0 counts | Bins with >2000 counts | High rate bins dominated by noise | Noise dominated (total time) | Noise dominated (detector-on time) | Marked lightcurve |
|---|---|---|---|---|---|---|---|
| A | 7638 | 6514 | 81 | 81 | 1.06% | 1.24% | 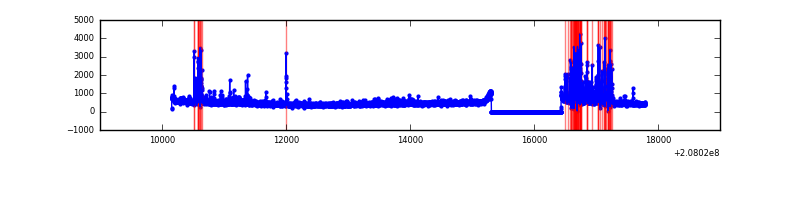 |
| B | 7638 | 6514 | 217 | 217 | 2.84% | 3.33% | 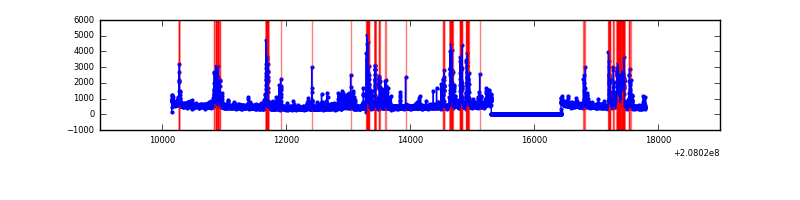 |
| C | 7638 | 6514 | 1 | 1 | 0.01% | 0.02% | 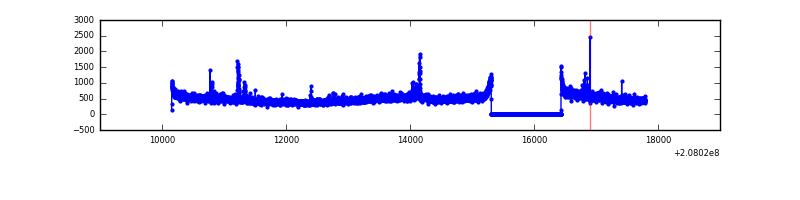 |
| D | 7638 | 6514 | 725 | 725 | 9.49% | 11.13% | 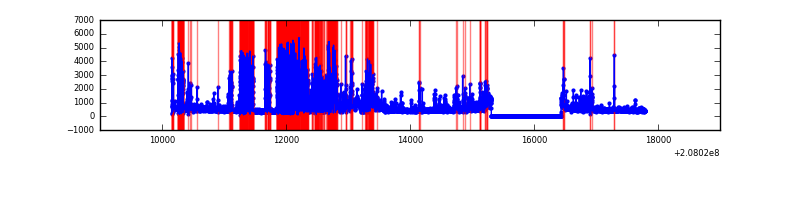 |
Top three noisy pixels from each quadrant. If the there are fewer than three noisy pixels in the level2.evt file, extra rows are filled as -1
| Pixel properties | Quadrant properties | ||||||
|---|---|---|---|---|---|---|---|
| Quadrant | DetID | PixID | Counts | Sigma | Mean | Median | Sigma |
| A | 0 | 118 | 464369 | 2969.1 | 760 | 744 | 156.1 |
| A | 8 | 15 | 114920 | 731.19 | 760 | 744 | 156.1 |
| A | 0 | 226 | 49774 | 313.99 | 760 | 744 | 156.1 |
| B | 10 | 16 | 553560 | 3766.5 | 766 | 747 | 146.8 |
| B | 14 | 167 | 477381 | 3247.47 | 766 | 747 | 146.8 |
| B | 5 | 200 | 77525 | 523.11 | 766 | 747 | 146.8 |
| C | 14 | 48 | 313261 | 1798.71 | 742 | 746 | 173.7 |
| C | 9 | 54 | 59015 | 335.37 | 742 | 746 | 173.7 |
| C | 7 | 247 | 25750 | 143.91 | 742 | 746 | 173.7 |
| D | 8 | 112 | 2520832 | 14887.4 | 689 | 670 | 169.3 |
| D | 13 | 235 | 258643 | 1523.93 | 689 | 670 | 169.3 |
| D | 2 | 136 | 97284 | 570.73 | 689 | 670 | 169.3 |
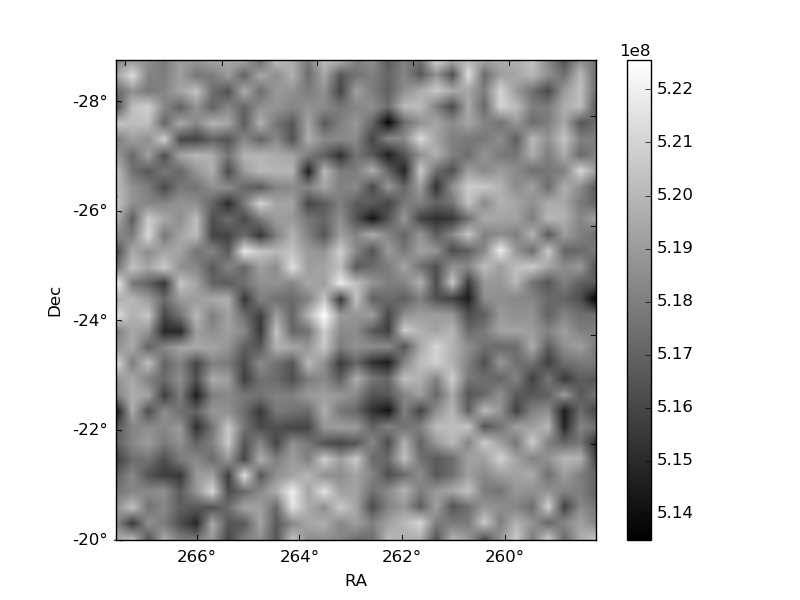
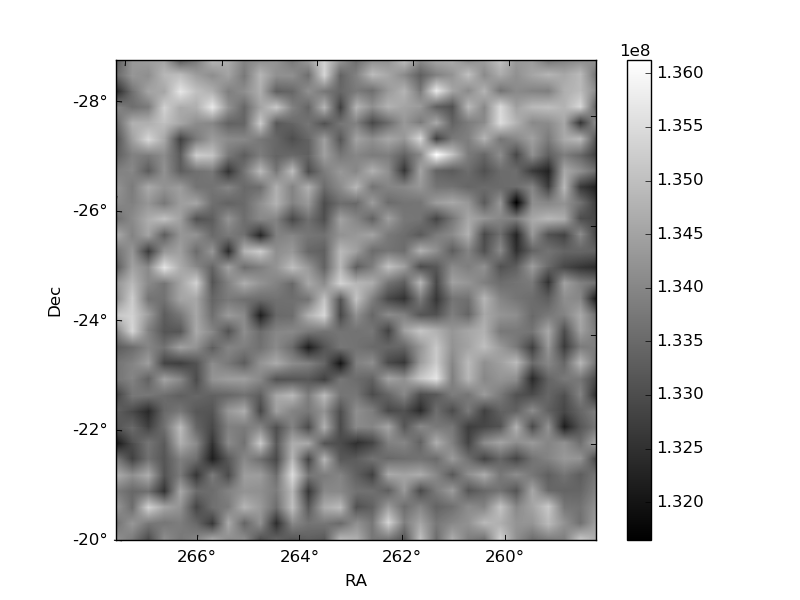
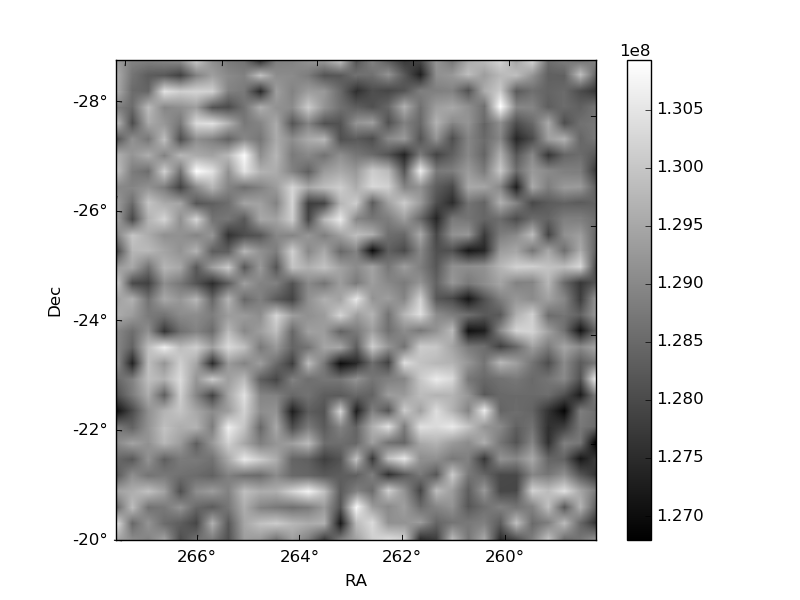
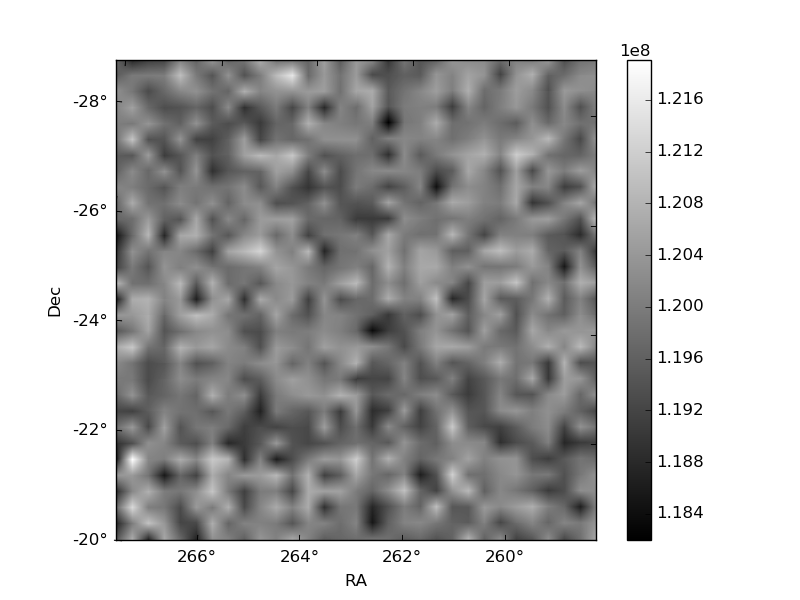
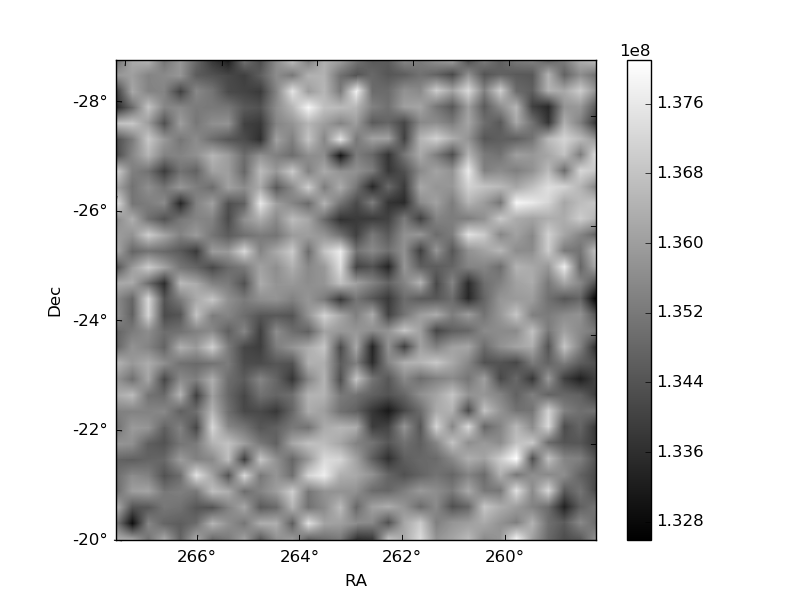
Histogram calculated using DETX and DETY for each event in the final _common_clean file
| Quadrant A | 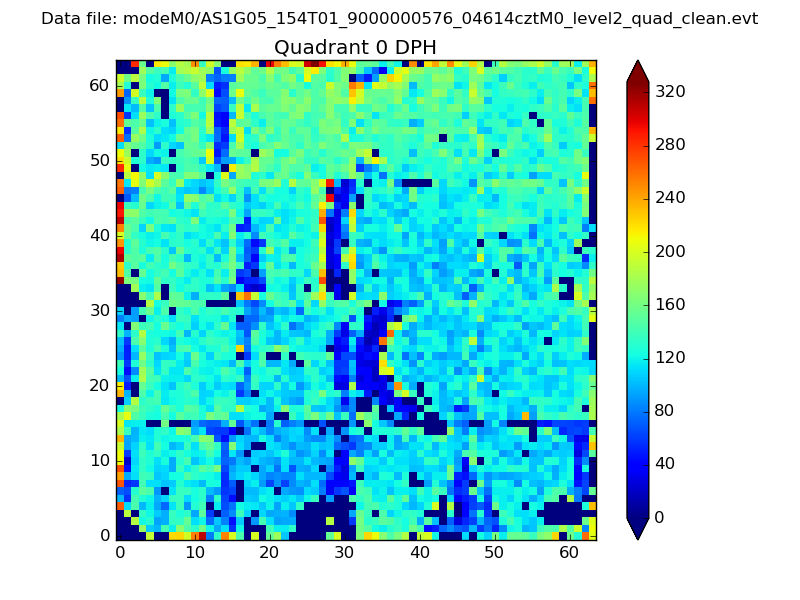 |
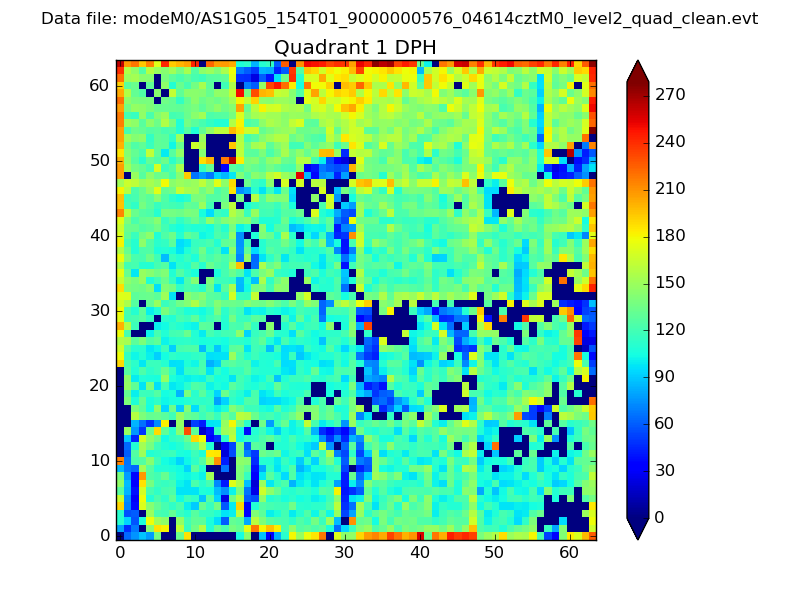 |
Quadrant B |
|---|---|---|---|
| Quadrant D | 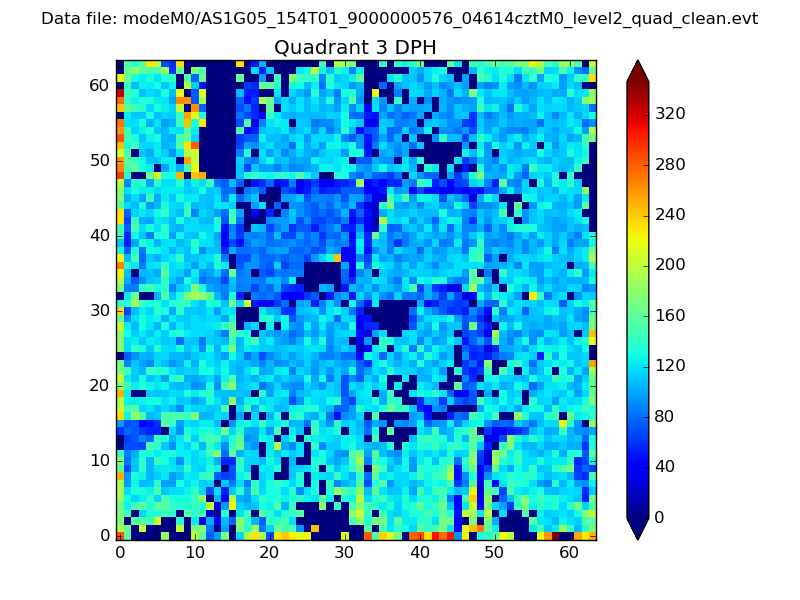 |
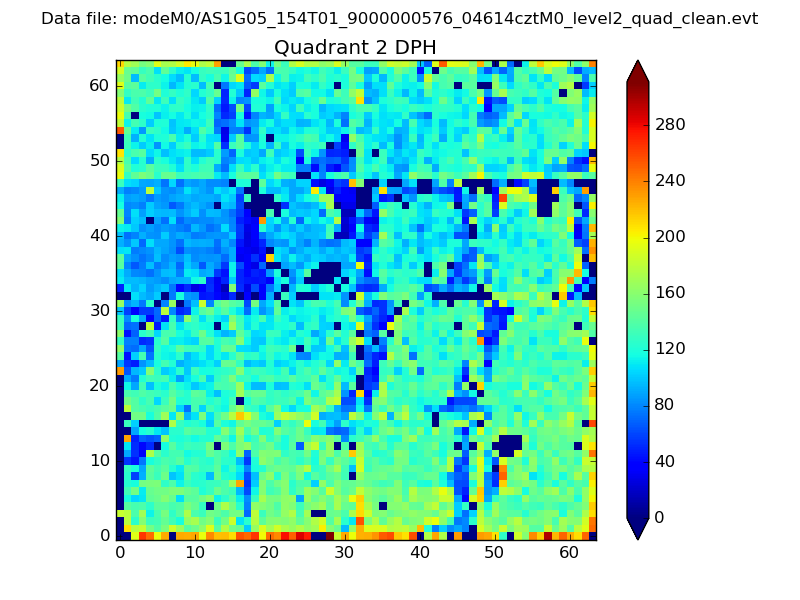 |
Quadrant C |
| Plot type | Count rate plots | Images |
|---|---|---|
| Comparison with Poisson distribution Blue bars denote a histogram of data divided into 1 sec bins. Red curve is a Poisson curve with rate = median count rate of data. |
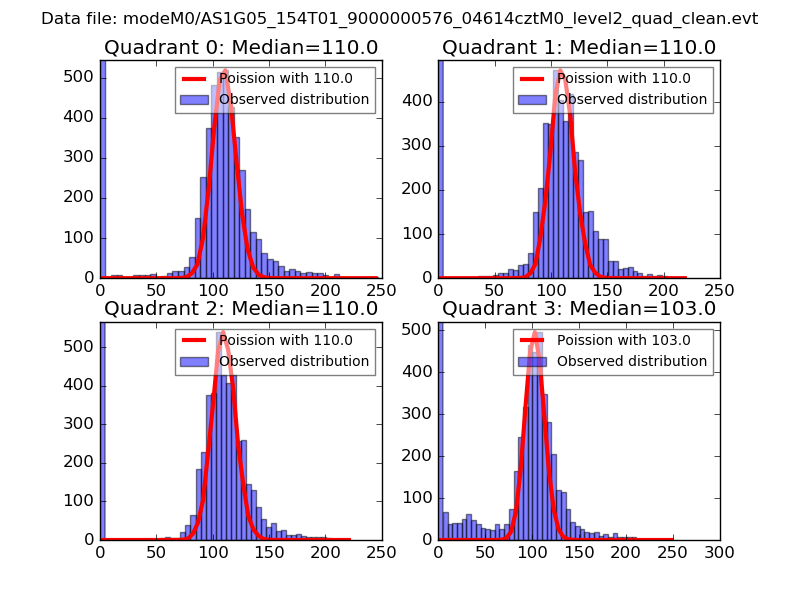 |
 |
| Quadrant-wise count rates Data is divided into 100 sec bins |
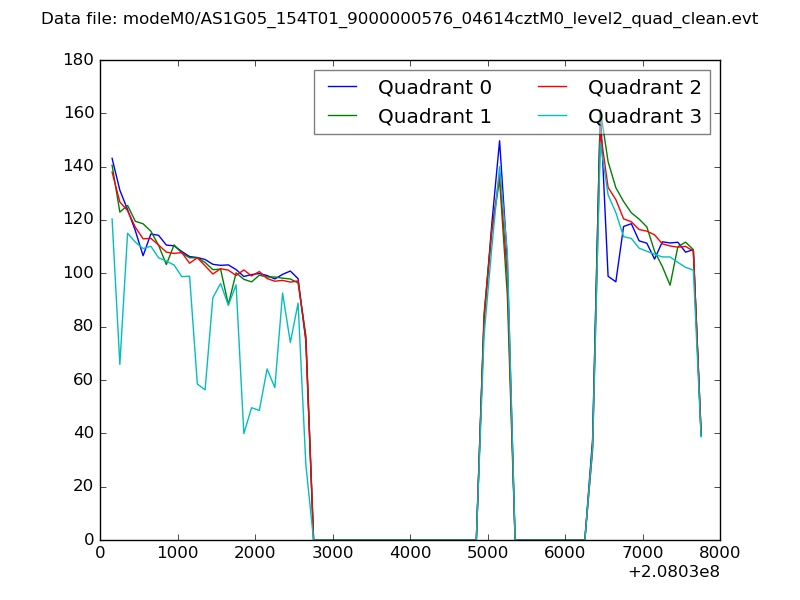 |
|
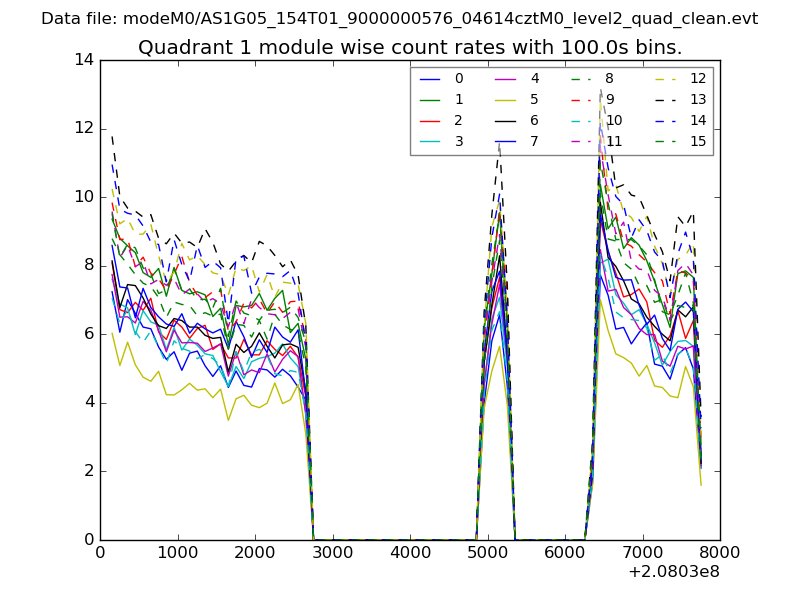
| Module-wise count rates for Quadrant A Data is divided into 100 sec bins |
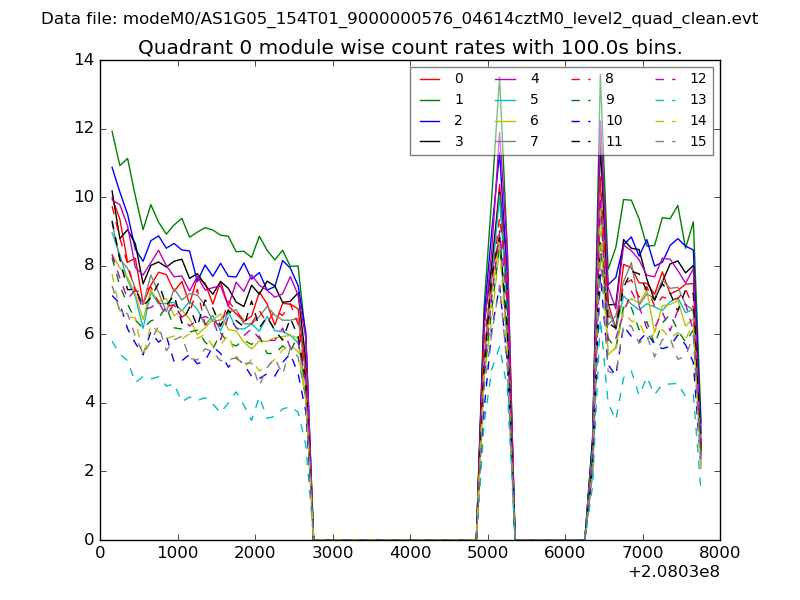 |
 |
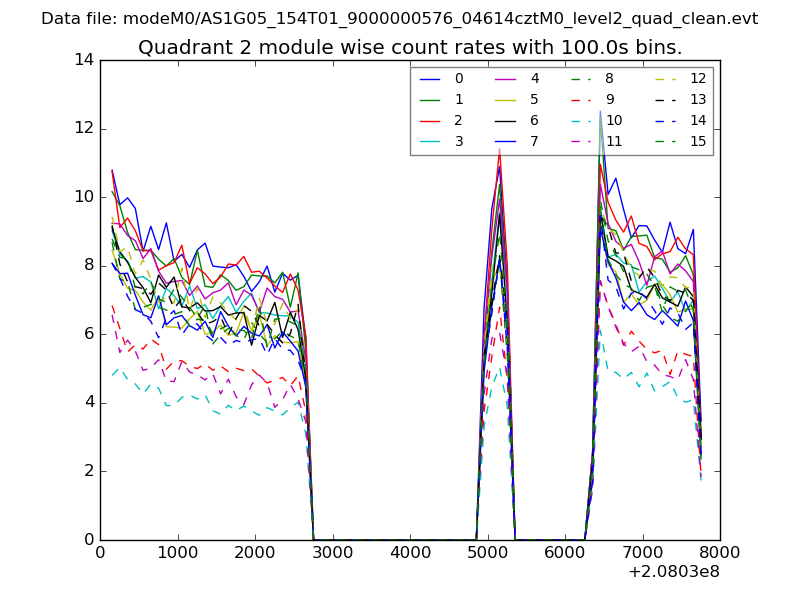
| Module-wise count rates for Quadrant B Data is divided into 100 sec bins |
 |
 |
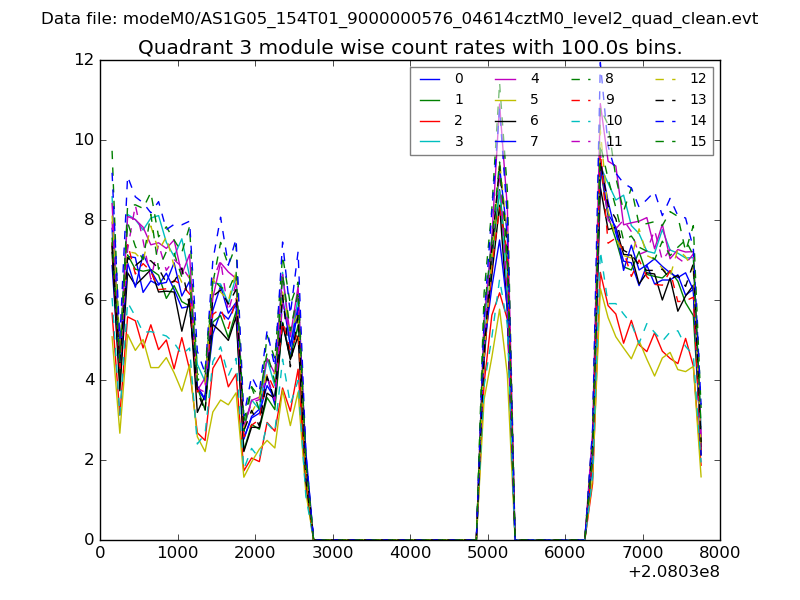
| Module-wise count rates for Quadrant C Data is divided into 100 sec bins |
 |
 |
| Module-wise count rates for Quadrant D Data is divided into 100 sec bins |
 |
 |
| Parameter | Plot |
|---|---|
| CZT HV Monitor | 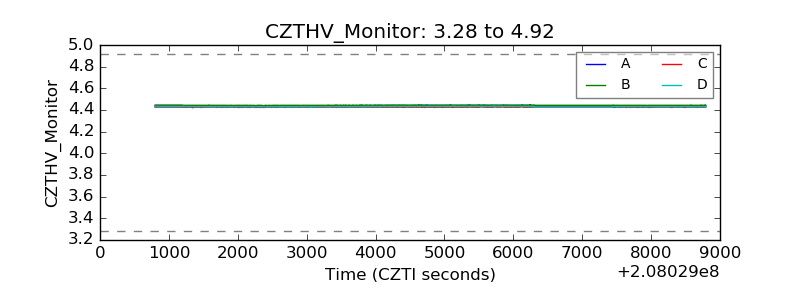 |
| D_VDD | 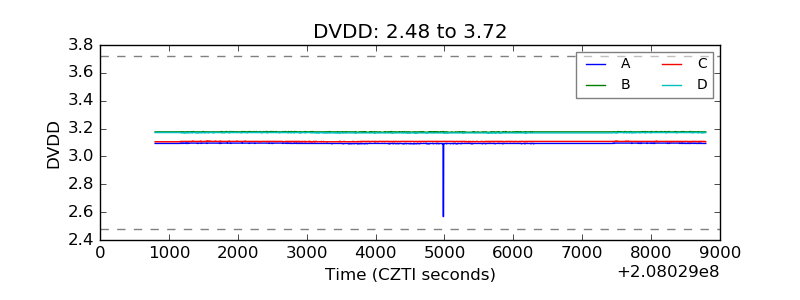 |
| Temperature 1 | 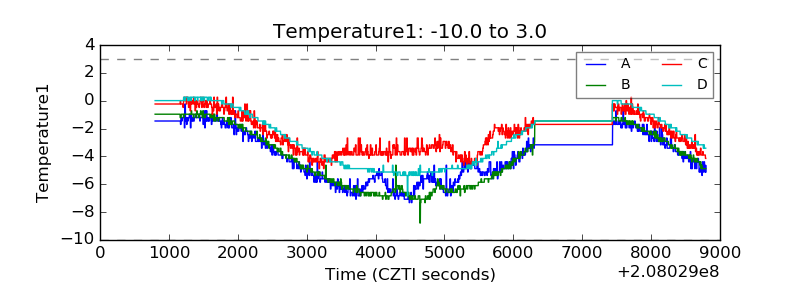 |
| Veto HV Monitor | 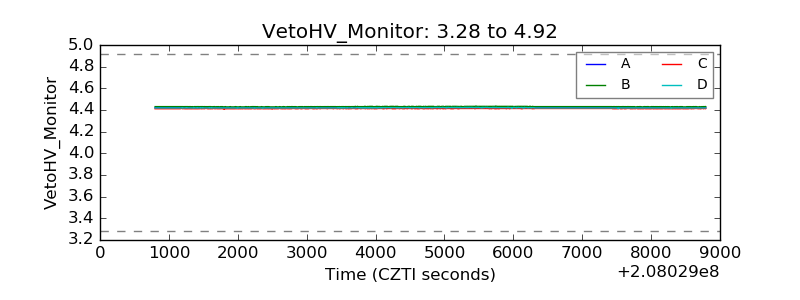 |
| Veto LLD | 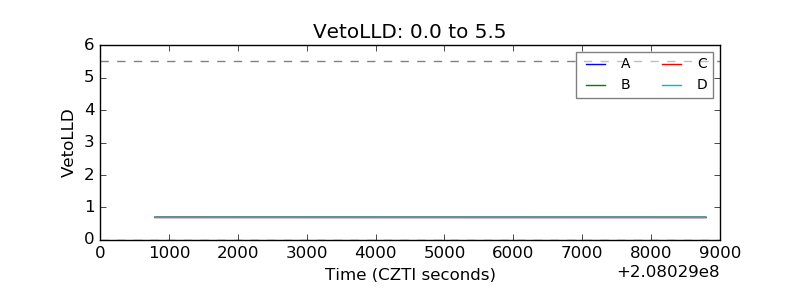 |
| Alpha Counter | 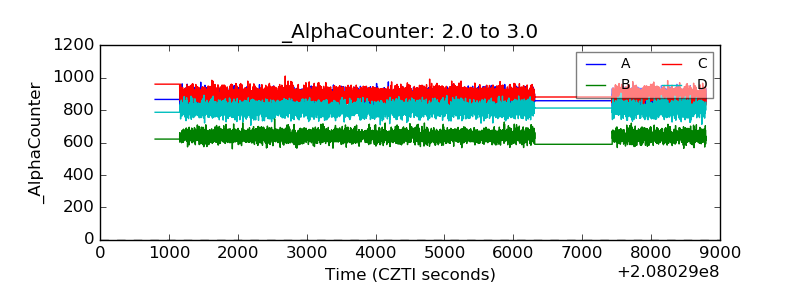 |
| _CPM_Rate | 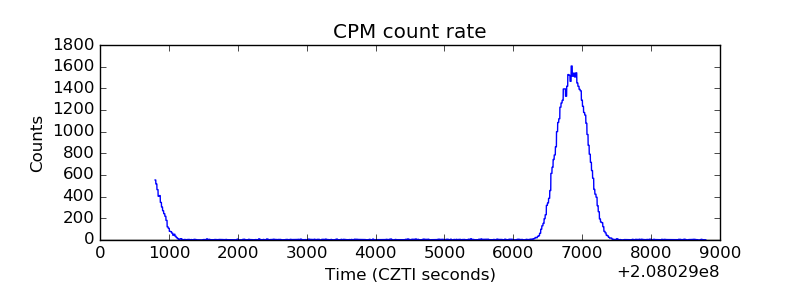 |
| CZT Counter | 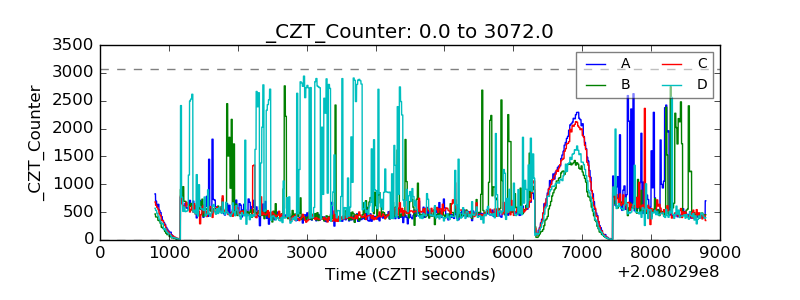 |
| +2.5 Volts monitor | 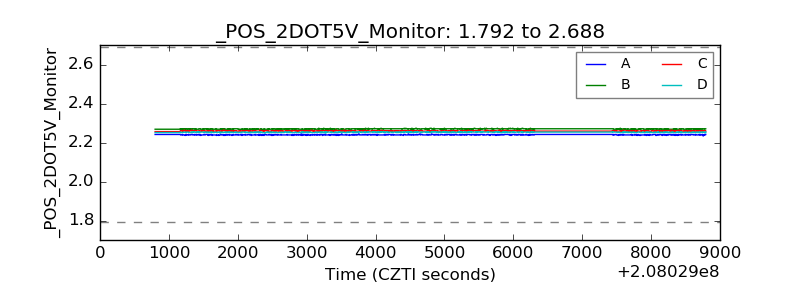 |
| +5 Volts monitor |  |
| _ROLL_ROT | 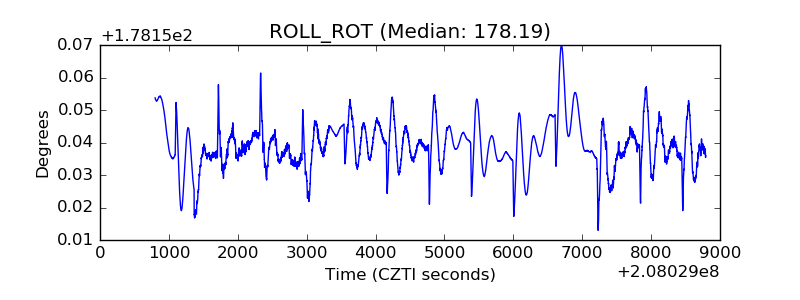 |
| _Roll_DEC | 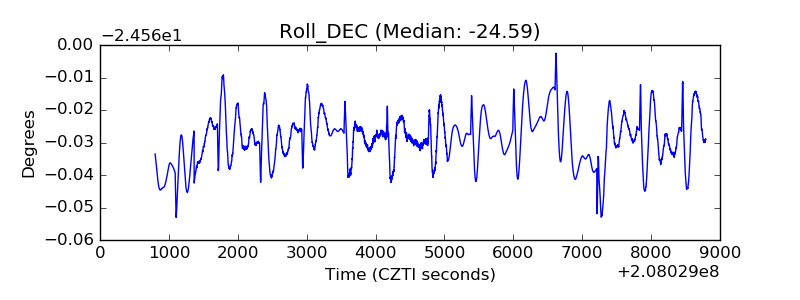 |
| _Roll_RA | 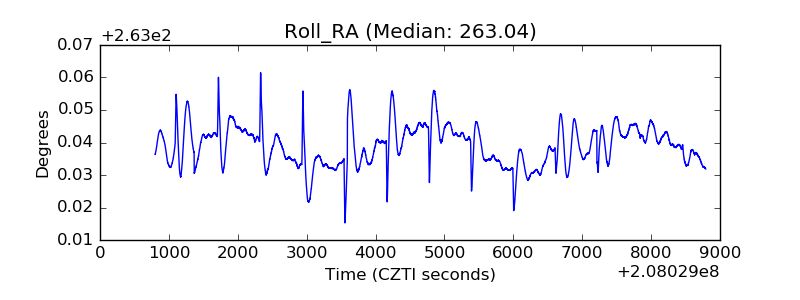 |
| Veto Counter | 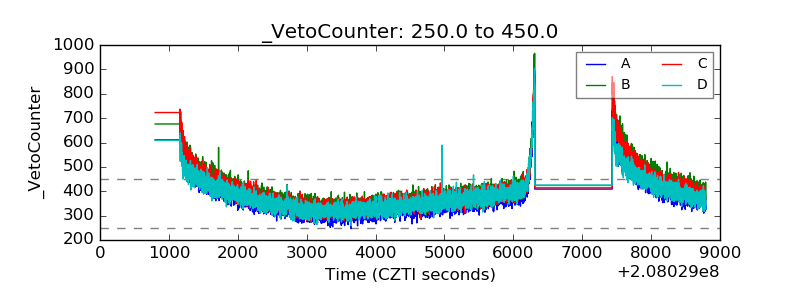 |