| Param | Original file | Final file |
|---|---|---|
| Filename | modeM0/AS1G05_154T01_9000000576_04615cztM0_level2.evt | modeM0/AS1G05_154T01_9000000576_04615cztM0_level2_quad_clean.evt |
| Size (bytes) | 558,901,440 | 73,405,440 |
| Size | 533.0 MB | 70.0 MB |
| Events in quadrant A | 3,362,143 | 460,084 |
| Events in quadrant B | 5,011,473 | 445,946 |
| Events in quadrant C | 3,166,419 | 463,109 |
| Events in quadrant D | 4,964,393 | 418,588 |
| Mode SS | |||
|---|---|---|---|
| Quadrant | BADHDUFLAG | Total packets | Discarded packets |
| A | 0 | 126 | 0 |
| B | 0 | 126 | 0 |
| C | 0 | 126 | 0 |
| D | 0 | 126 | 0 |
| Mode M9 | |||
|---|---|---|---|
| Quadrant | BADHDUFLAG | Total packets | Discarded packets |
| A | 0 | 16 | 0 |
| B | 0 | 16 | 0 |
| C | 0 | 16 | 0 |
| D | 0 | 17 | 0 |
| Mode M0 | |||
|---|---|---|---|
| Quadrant | BADHDUFLAG | Total packets | Discarded packets |
| A | 0 | 14233 | 3 |
| B | 0 | 19127 | 2 |
| C | 0 | 13581 | 2 |
| D | 0 | 19079 | 2 |
| Quadrant | Total seconds | Saturated seconds | Saturation percentage |
|---|---|---|---|
| A | 6226 | 164 | 2.634115% |
| B | 6226 | 625 | 10.038548% |
| C | 6226 | 15 | 0.240925% |
| D | 6226 | 514 | 8.255702% |
Noise dominated data is calculated using 1-second bins in cleaned event files. If a bin has >2000 counts, and if more than 50% of those come from <1% of pixels, then it is considered to be noise-dominated and hence unusable.
| Quadrant | # 1 sec bins | Bins with >0 counts | Bins with >2000 counts | High rate bins dominated by noise | Noise dominated (total time) | Noise dominated (detector-on time) | Marked lightcurve |
|---|---|---|---|---|---|---|---|
| A | 7476 | 6227 | 71 | 71 | 0.95% | 1.14% | 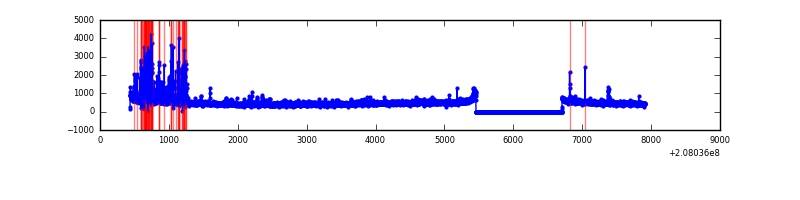 |
| B | 7476 | 6227 | 497 | 497 | 6.65% | 7.98% | 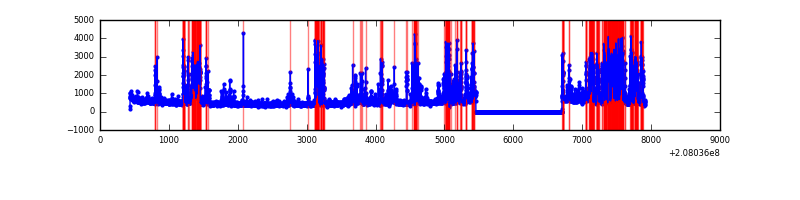 |
| C | 7476 | 6227 | 3 | 3 | 0.04% | 0.05% | 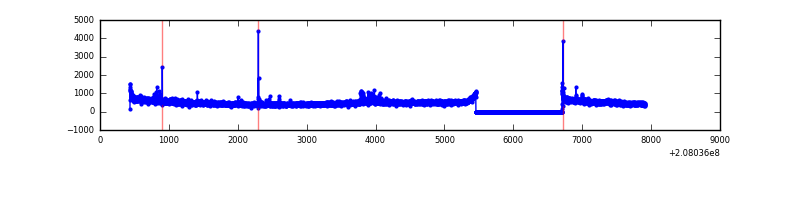 |
| D | 7476 | 6227 | 447 | 447 | 5.98% | 7.18% | 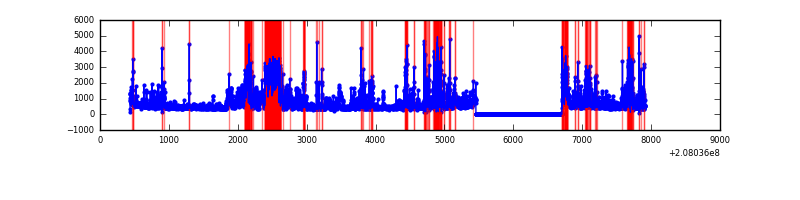 |
Top three noisy pixels from each quadrant. If the there are fewer than three noisy pixels in the level2.evt file, extra rows are filled as -1
| Pixel properties | Quadrant properties | ||||||
|---|---|---|---|---|---|---|---|
| Quadrant | DetID | PixID | Counts | Sigma | Mean | Median | Sigma |
| A | 0 | 118 | 391207 | 2602.63 | 732 | 716 | 150.0 |
| A | 8 | 15 | 86715 | 573.19 | 732 | 716 | 150.0 |
| A | 0 | 226 | 42756 | 280.2 | 732 | 716 | 150.0 |
| B | 14 | 167 | 1237315 | 8882.5 | 727 | 713 | 139.2 |
| B | 10 | 16 | 615581 | 4416.59 | 727 | 713 | 139.2 |
| B | 8 | 3 | 145126 | 1037.32 | 727 | 713 | 139.2 |
| C | 14 | 48 | 267915 | 1583.53 | 719 | 723 | 168.7 |
| C | 9 | 54 | 42126 | 245.38 | 719 | 723 | 168.7 |
| C | 9 | 247 | 27538 | 158.92 | 719 | 723 | 168.7 |
| D | 13 | 235 | 1238148 | 7511.12 | 685 | 666 | 164.8 |
| D | 8 | 112 | 571477 | 3464.64 | 685 | 666 | 164.8 |
| D | 12 | 233 | 255624 | 1547.51 | 685 | 666 | 164.8 |
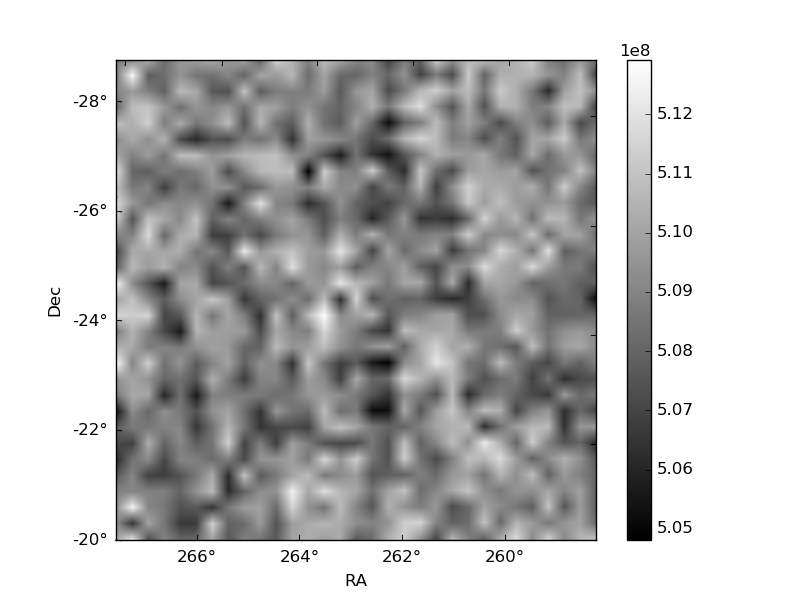
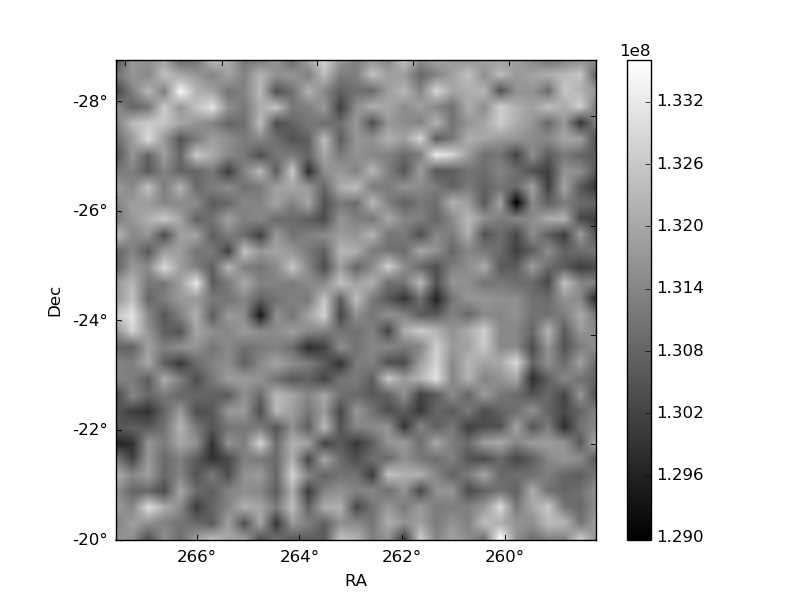
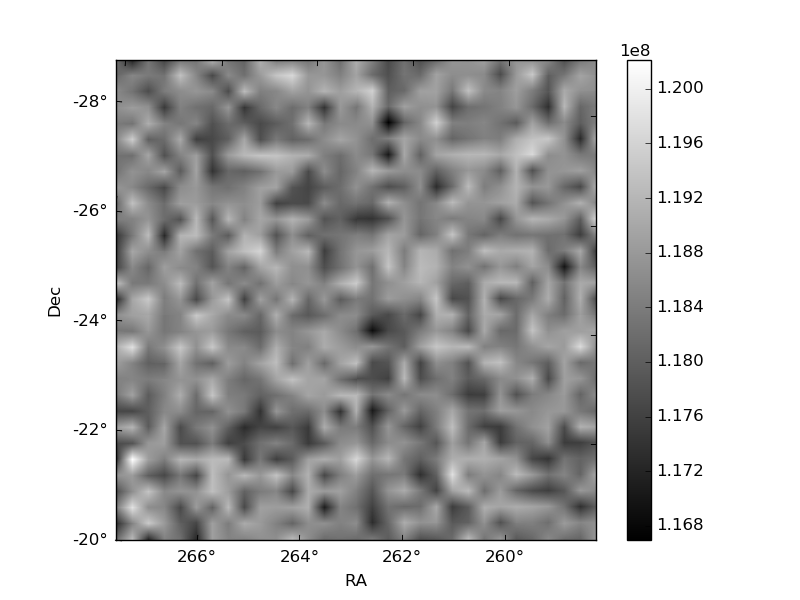
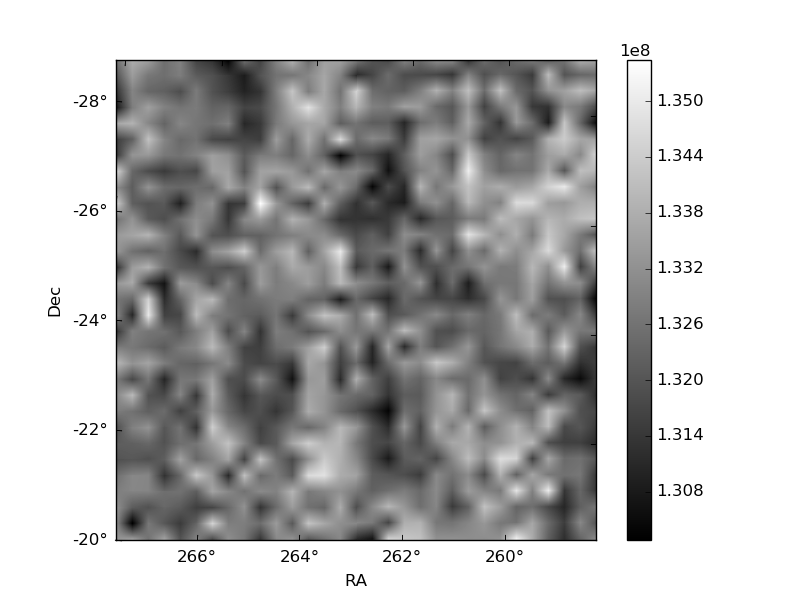
Histogram calculated using DETX and DETY for each event in the final _common_clean file
| Quadrant A | 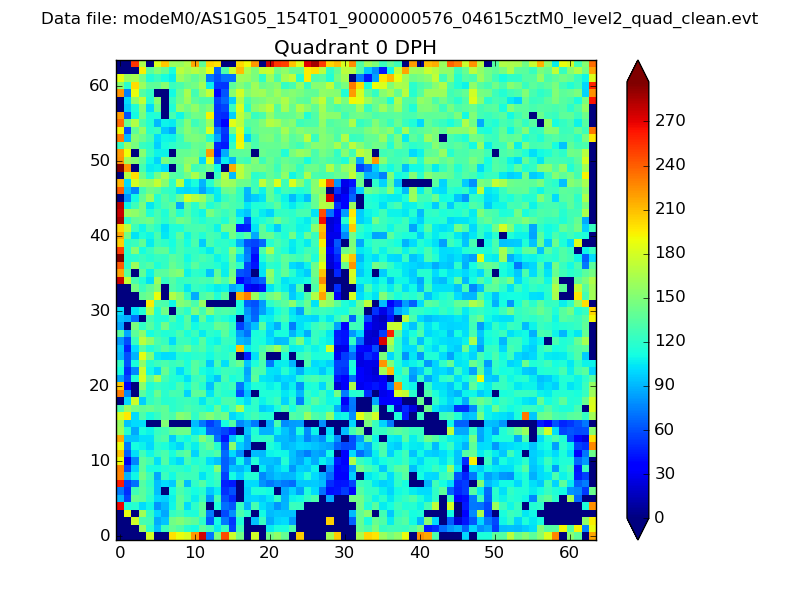 |
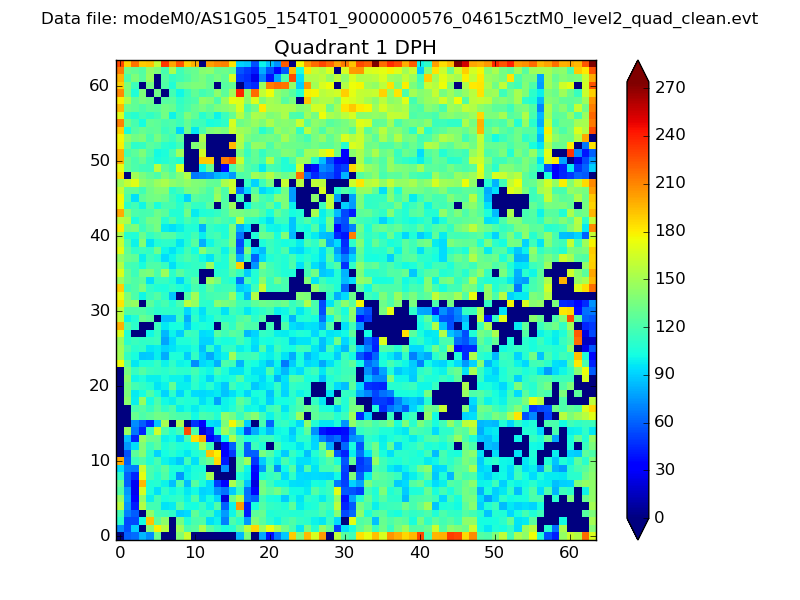 |
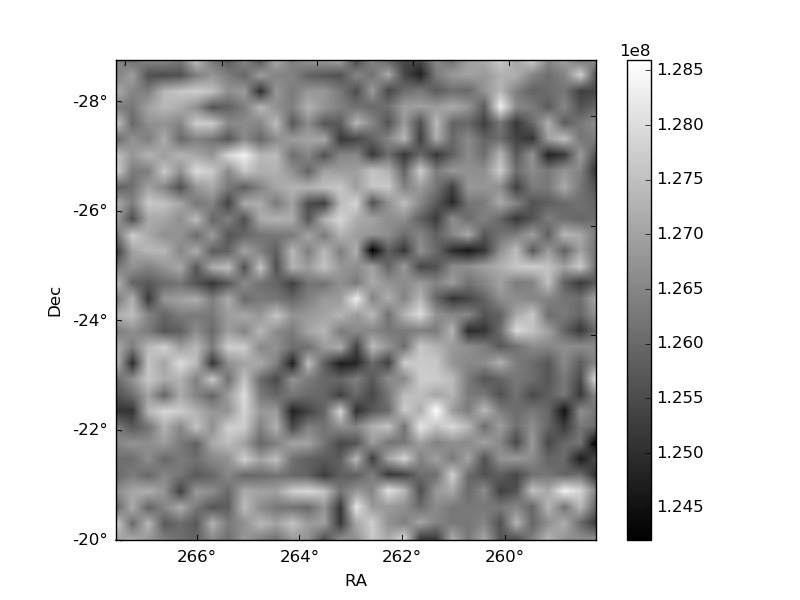
Quadrant B |
|---|---|---|---|
| Quadrant D | 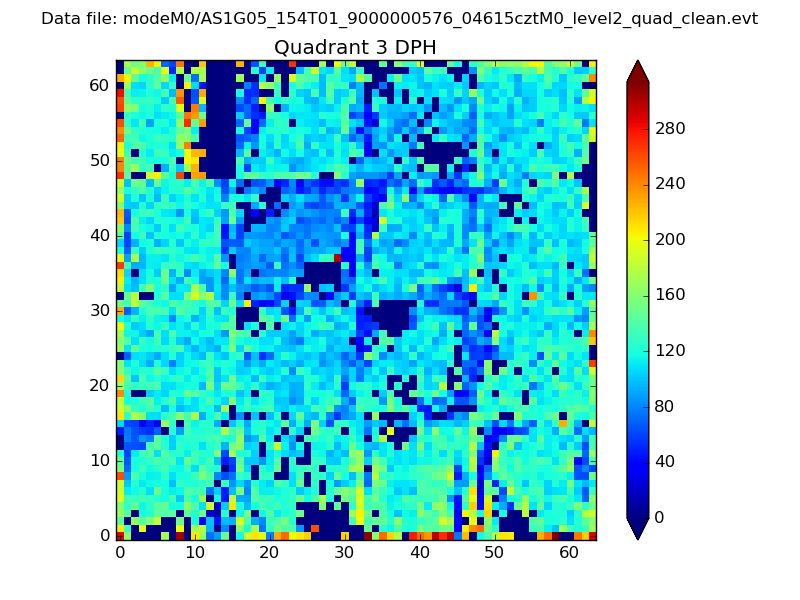 |
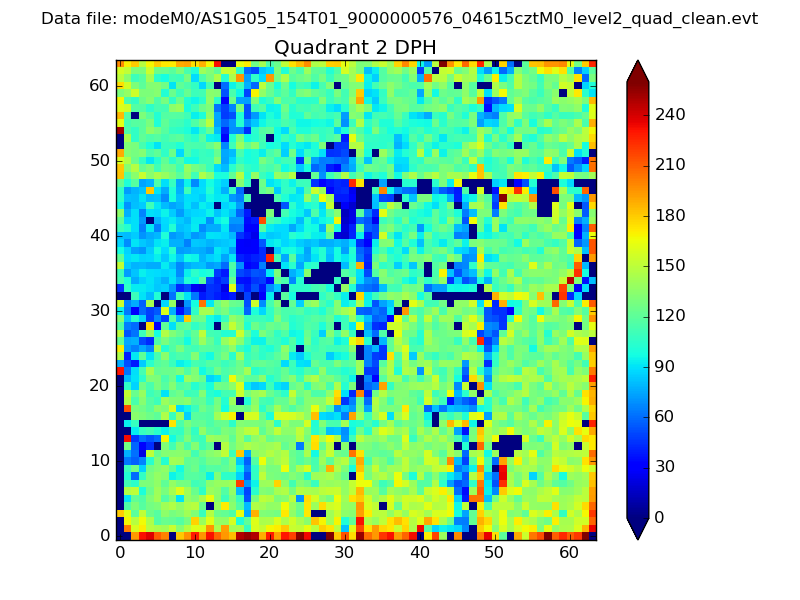 |
Quadrant C |
| Plot type | Count rate plots | Images |
|---|---|---|
| Comparison with Poisson distribution Blue bars denote a histogram of data divided into 1 sec bins. Red curve is a Poisson curve with rate = median count rate of data. |
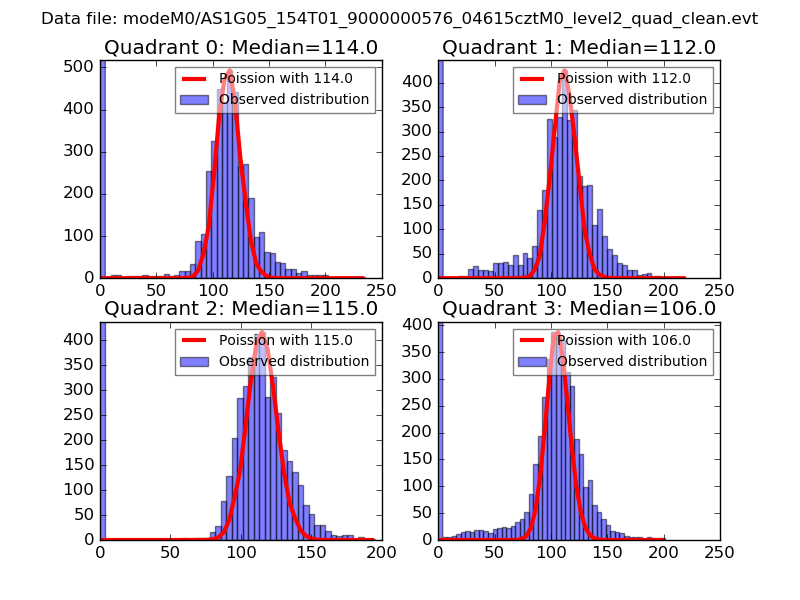 |
 |
| Quadrant-wise count rates Data is divided into 100 sec bins |
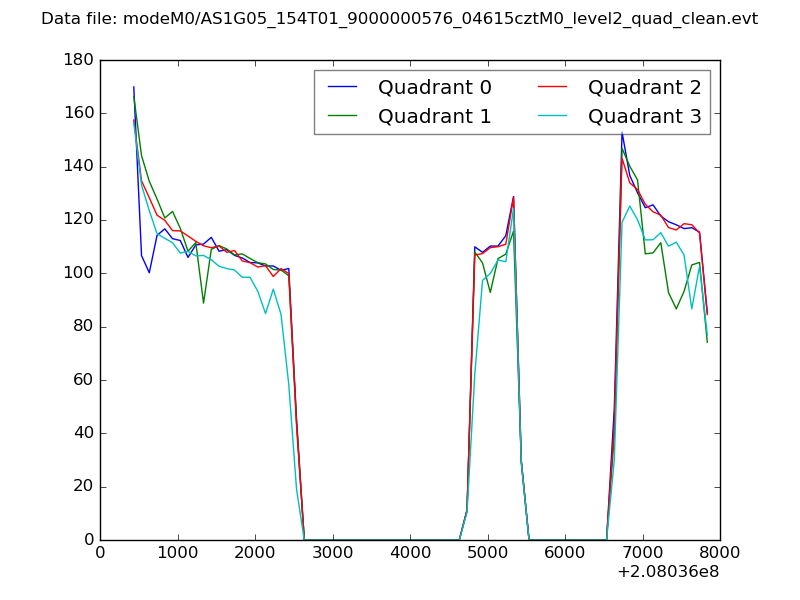 |
|
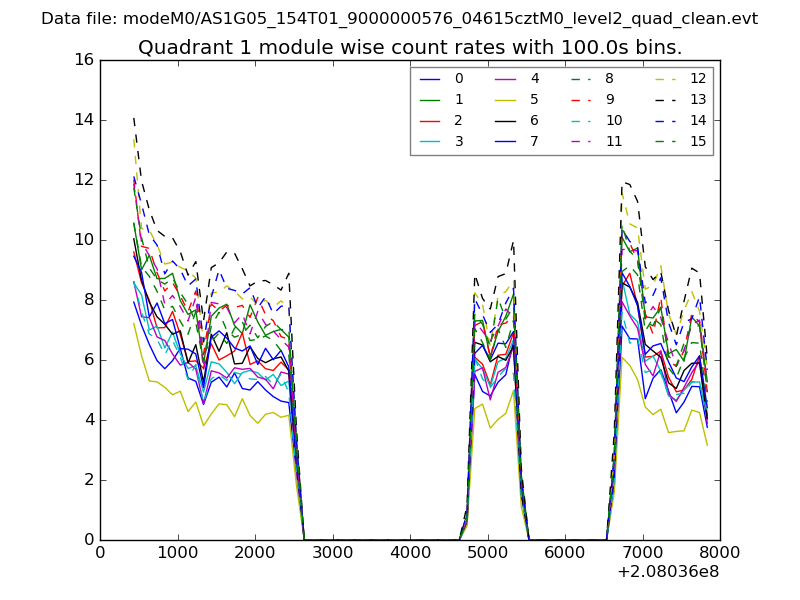
| Module-wise count rates for Quadrant A Data is divided into 100 sec bins |
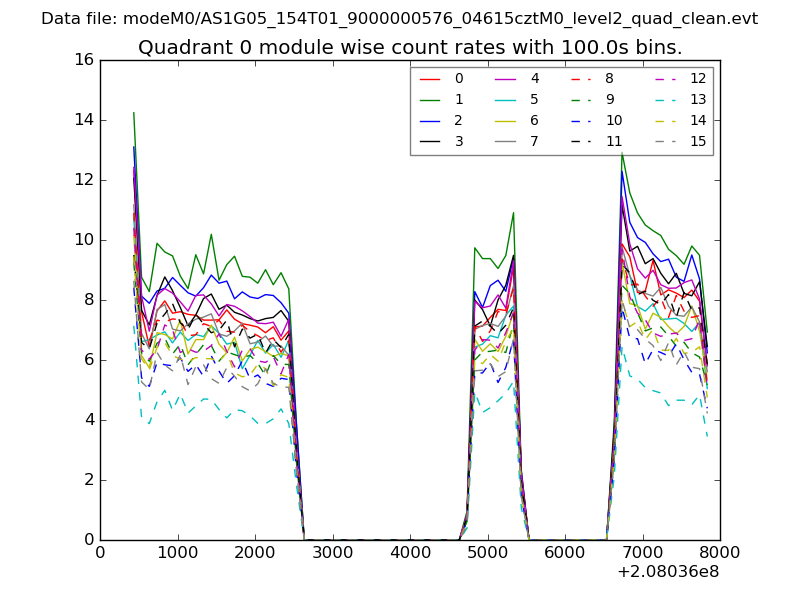 |
 |
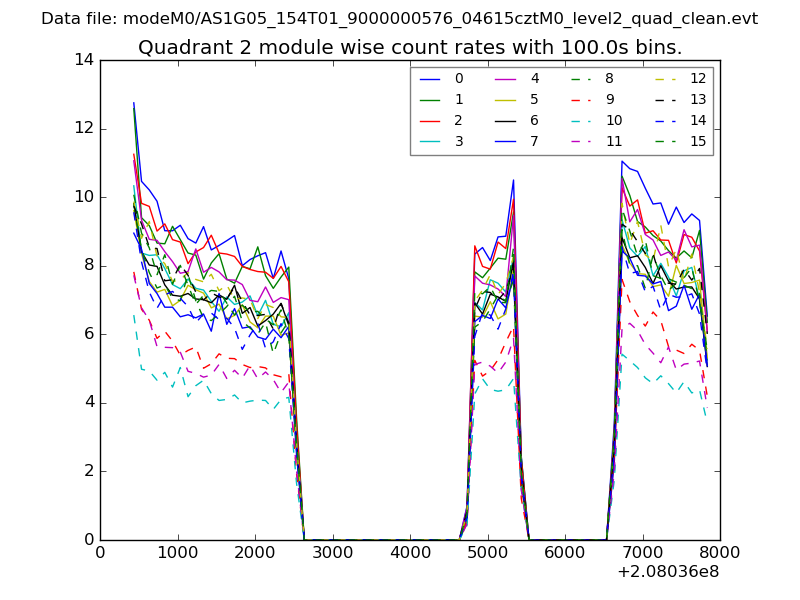
| Module-wise count rates for Quadrant B Data is divided into 100 sec bins |
 |
 |
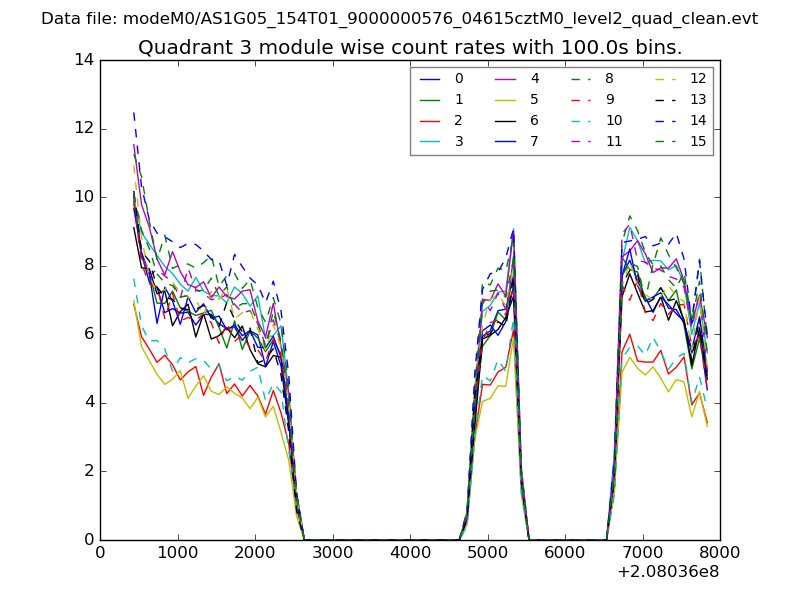
| Module-wise count rates for Quadrant C Data is divided into 100 sec bins |
 |
 |
| Module-wise count rates for Quadrant D Data is divided into 100 sec bins |
 |
 |
| Parameter | Plot |
|---|---|
| CZT HV Monitor | 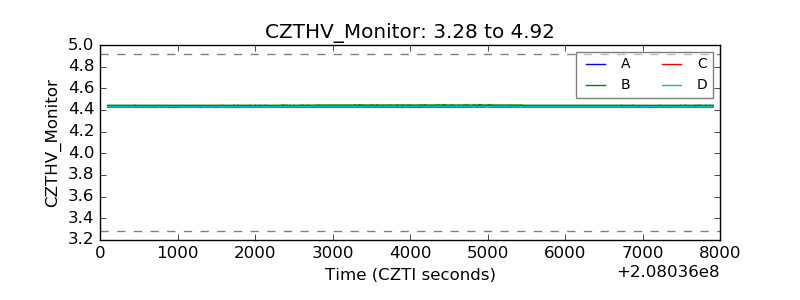 |
| D_VDD | 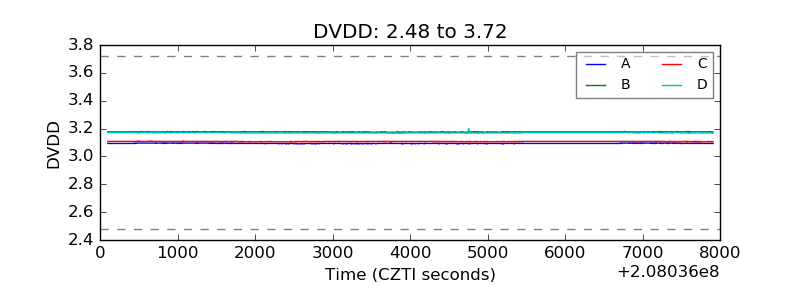 |
| Temperature 1 | 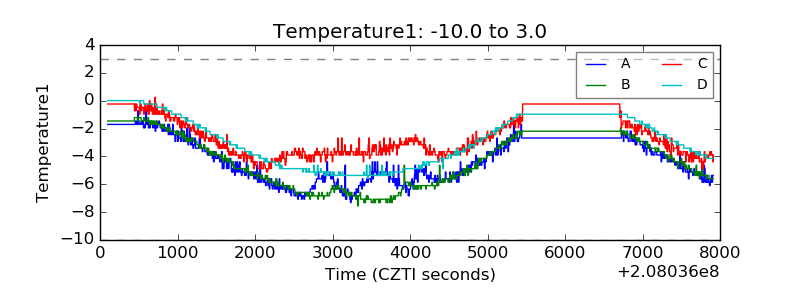 |
| Veto HV Monitor | 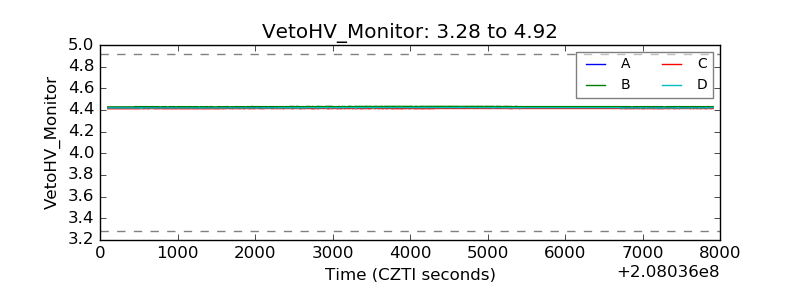 |
| Veto LLD | 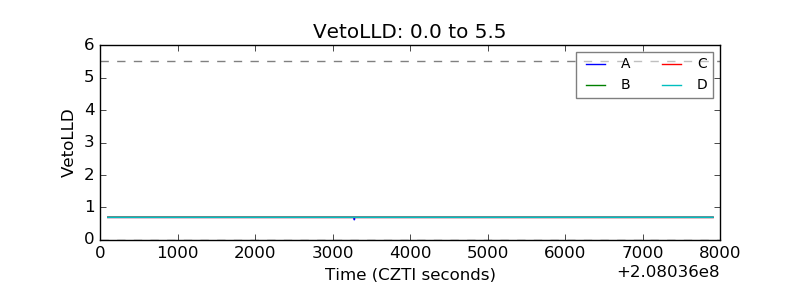 |
| Alpha Counter | 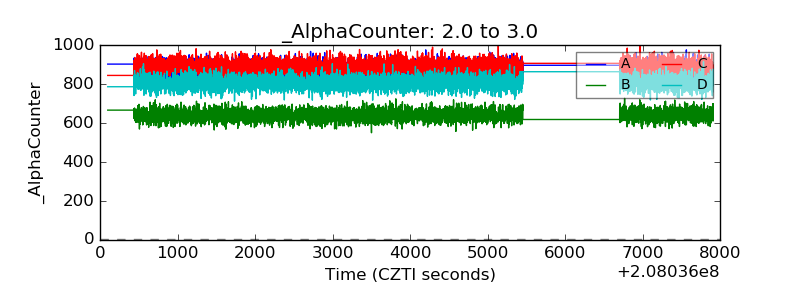 |
| _CPM_Rate | 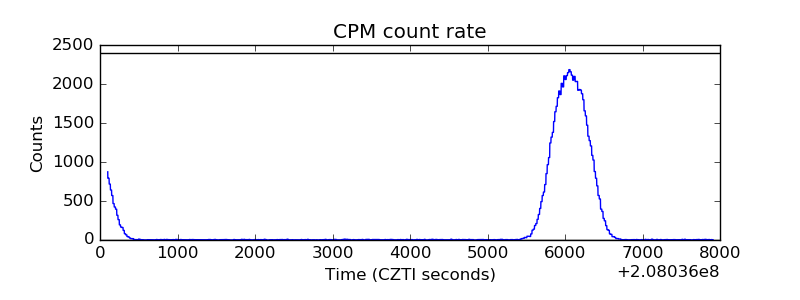 |
| CZT Counter | 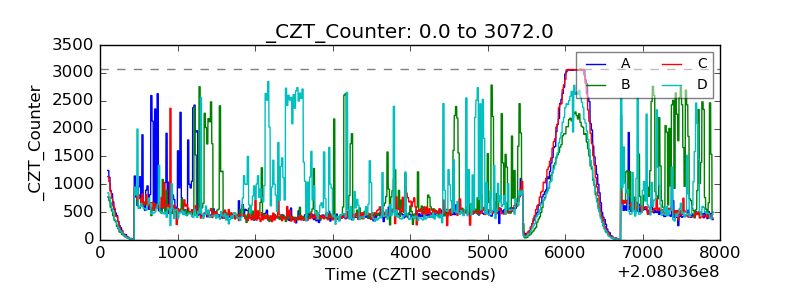 |
| +2.5 Volts monitor | 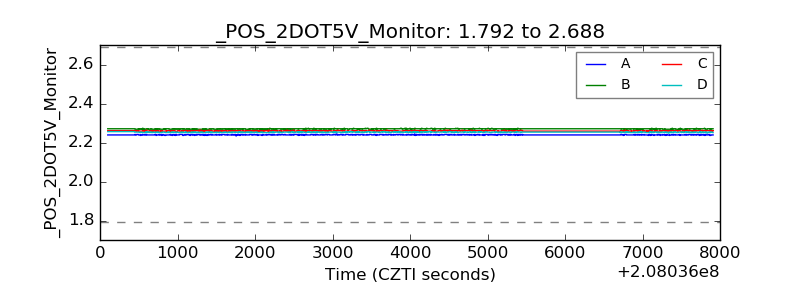 |
| +5 Volts monitor | 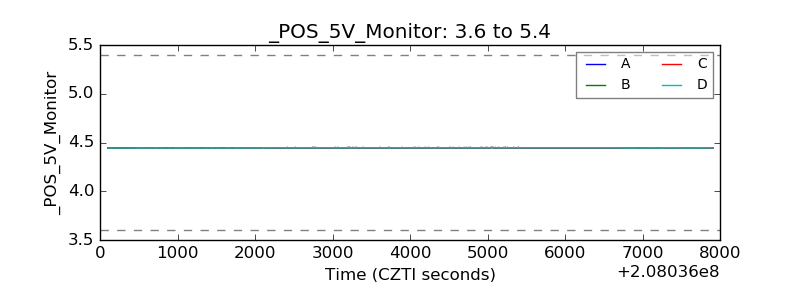 |
| _ROLL_ROT | 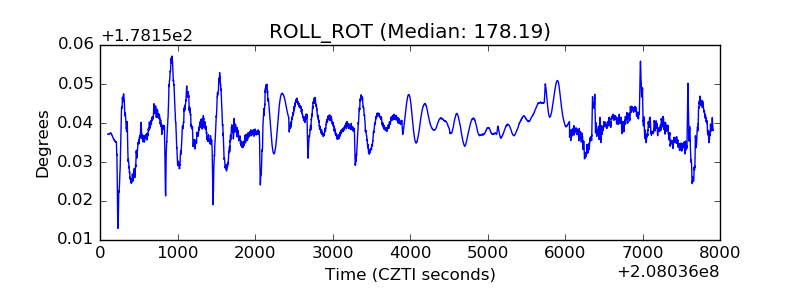 |
| _Roll_DEC | 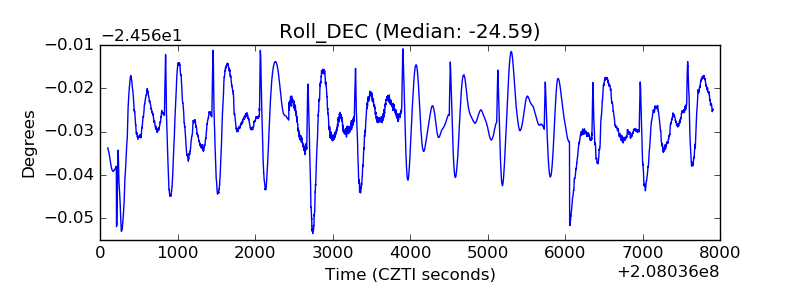 |
| _Roll_RA | 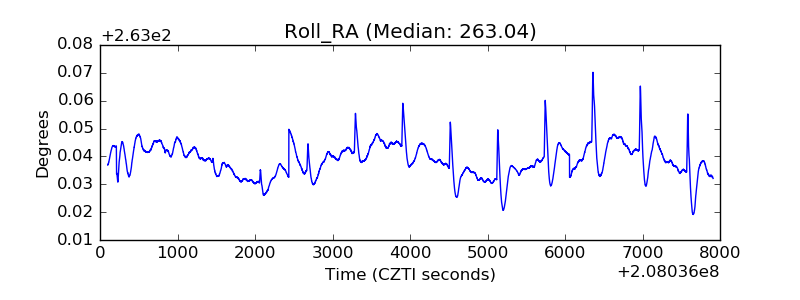 |
| Veto Counter | 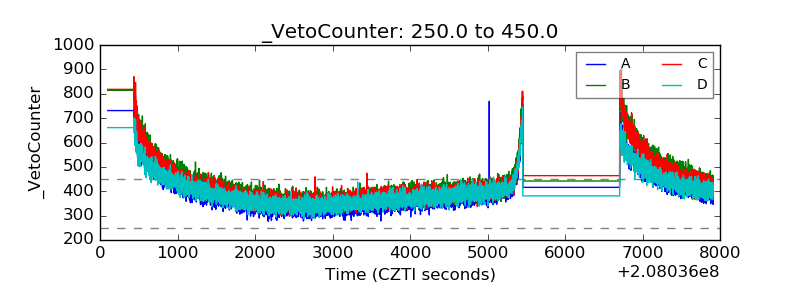 |