| Param | Original file | Final file |
|---|---|---|
| Filename | modeM0/AS1G05_154T01_9000000576_04616cztM0_level2.evt | modeM0/AS1G05_154T01_9000000576_04616cztM0_level2_quad_clean.evt |
| Size (bytes) | 586,336,320 | 75,648,960 |
| Size | 559.2 MB | 72.1 MB |
| Events in quadrant A | 3,169,876 | 484,503 |
| Events in quadrant B | 5,102,063 | 462,137 |
| Events in quadrant C | 3,118,791 | 483,780 |
| Events in quadrant D | 5,941,516 | 422,101 |
| Mode SS | |||
|---|---|---|---|
| Quadrant | BADHDUFLAG | Total packets | Discarded packets |
| A | 0 | 126 | 0 |
| B | 0 | 126 | 0 |
| C | 0 | 126 | 0 |
| D | 0 | 126 | 0 |
| Mode M9 | |||
|---|---|---|---|
| Quadrant | BADHDUFLAG | Total packets | Discarded packets |
| A | 0 | 17 | 0 |
| B | 0 | 17 | 0 |
| C | 0 | 17 | 0 |
| D | 0 | 18 | 0 |
| Mode M0 | |||
|---|---|---|---|
| Quadrant | BADHDUFLAG | Total packets | Discarded packets |
| A | 0 | 13593 | 3 |
| B | 0 | 19297 | 2 |
| C | 0 | 13454 | 2 |
| D | 0 | 21930 | 2 |
| Quadrant | Total seconds | Saturated seconds | Saturation percentage |
|---|---|---|---|
| A | 6275 | 61 | 0.972112% |
| B | 6275 | 751 | 11.968127% |
| C | 6275 | 41 | 0.653386% |
| D | 6275 | 969 | 15.442231% |
Noise dominated data is calculated using 1-second bins in cleaned event files. If a bin has >2000 counts, and if more than 50% of those come from <1% of pixels, then it is considered to be noise-dominated and hence unusable.
| Quadrant | # 1 sec bins | Bins with >0 counts | Bins with >2000 counts | High rate bins dominated by noise | Noise dominated (total time) | Noise dominated (detector-on time) | Marked lightcurve |
|---|---|---|---|---|---|---|---|
| A | 7550 | 6276 | 10 | 10 | 0.13% | 0.16% | 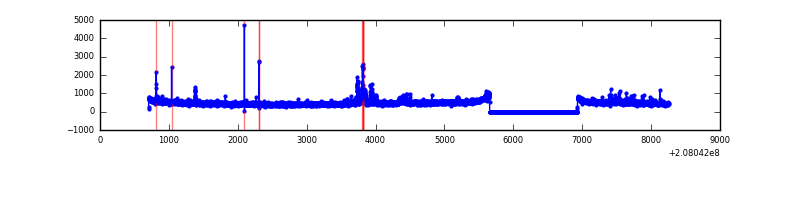 |
| B | 7550 | 6276 | 556 | 556 | 7.36% | 8.86% | 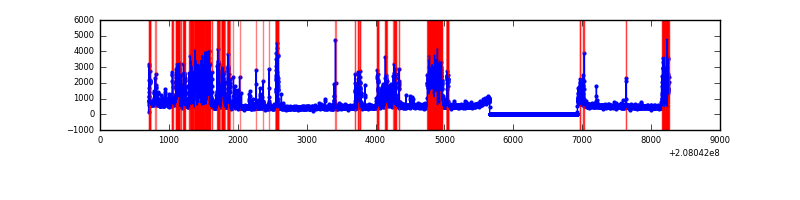 |
| C | 7550 | 6276 | 7 | 7 | 0.09% | 0.11% | 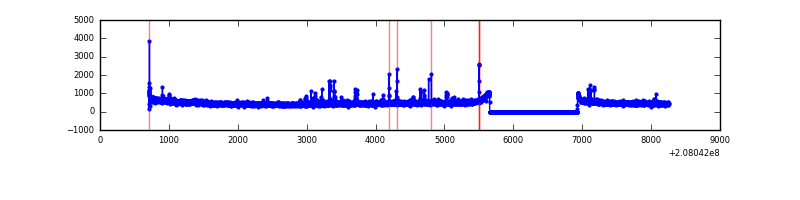 |
| D | 7550 | 6276 | 1002 | 1002 | 13.27% | 15.97% | 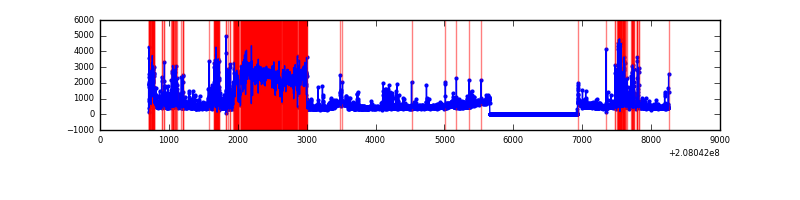 |
Top three noisy pixels from each quadrant. If the there are fewer than three noisy pixels in the level2.evt file, extra rows are filled as -1
| Pixel properties | Quadrant properties | ||||||
|---|---|---|---|---|---|---|---|
| Quadrant | DetID | PixID | Counts | Sigma | Mean | Median | Sigma |
| A | 15 | 174 | 127353 | 808.01 | 763 | 749 | 156.7 |
| A | 13 | 251 | 41846 | 262.29 | 763 | 749 | 156.7 |
| A | 8 | 15 | 37548 | 234.86 | 763 | 749 | 156.7 |
| B | 14 | 167 | 887573 | 6252.34 | 747 | 731 | 141.8 |
| B | 10 | 16 | 777550 | 5476.66 | 747 | 731 | 141.8 |
| B | 5 | 200 | 238527 | 1676.49 | 747 | 731 | 141.8 |
| C | 9 | 247 | 107824 | 618.48 | 741 | 746 | 173.1 |
| C | 14 | 48 | 92493 | 529.93 | 741 | 746 | 173.1 |
| C | 1 | 3 | 14499 | 79.44 | 741 | 746 | 173.1 |
| D | 13 | 235 | 2523365 | 15097.04 | 692 | 672 | 167.1 |
| D | 8 | 112 | 350291 | 2092.29 | 692 | 672 | 167.1 |
| D | 12 | 233 | 265677 | 1585.92 | 692 | 672 | 167.1 |
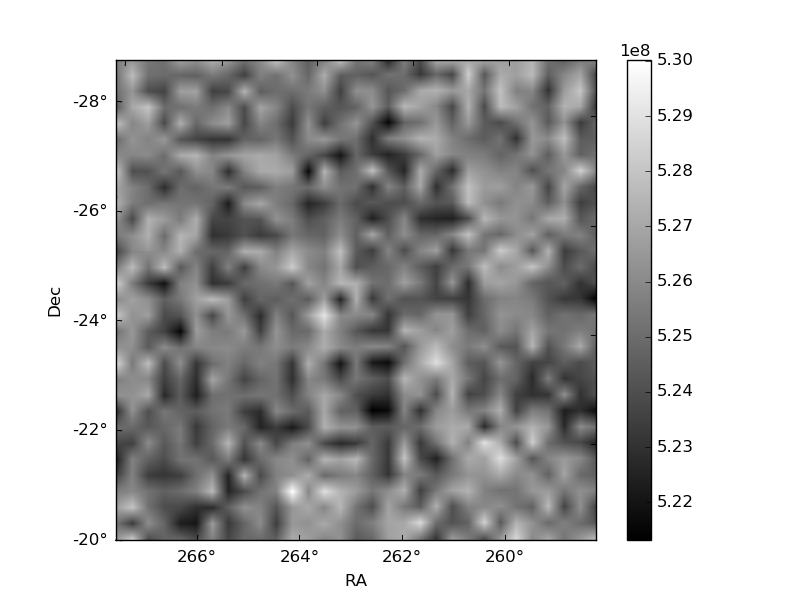
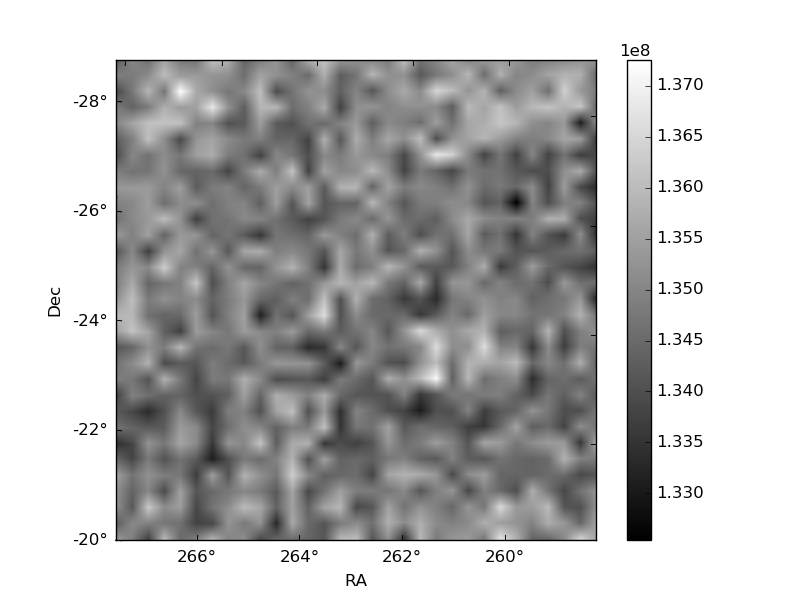
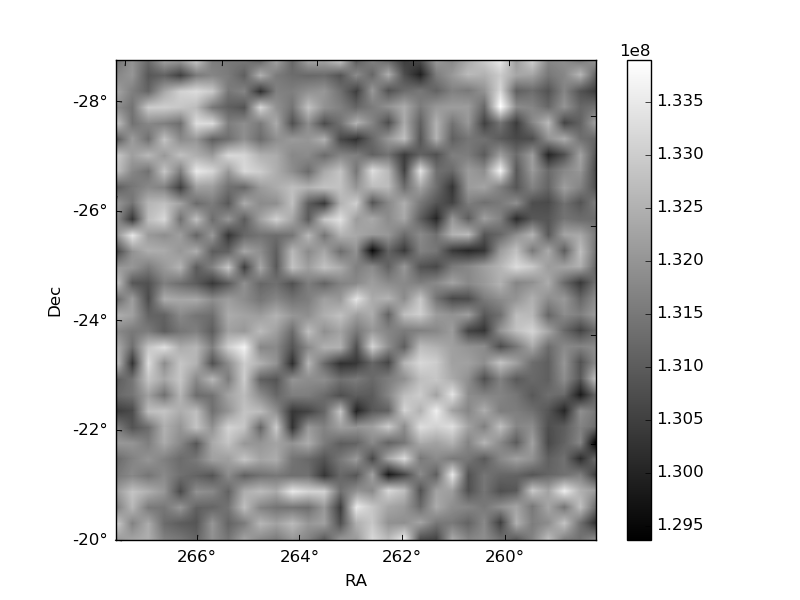
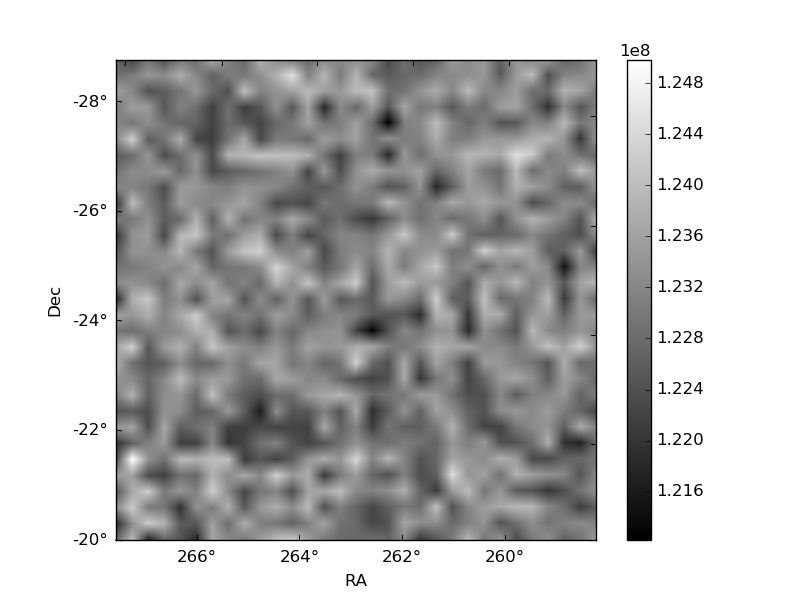
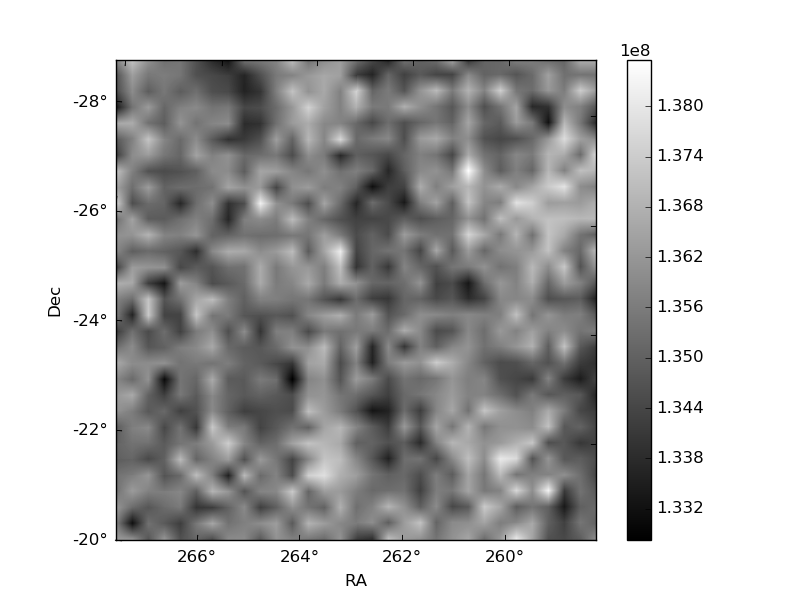
Histogram calculated using DETX and DETY for each event in the final _common_clean file
| Quadrant A | 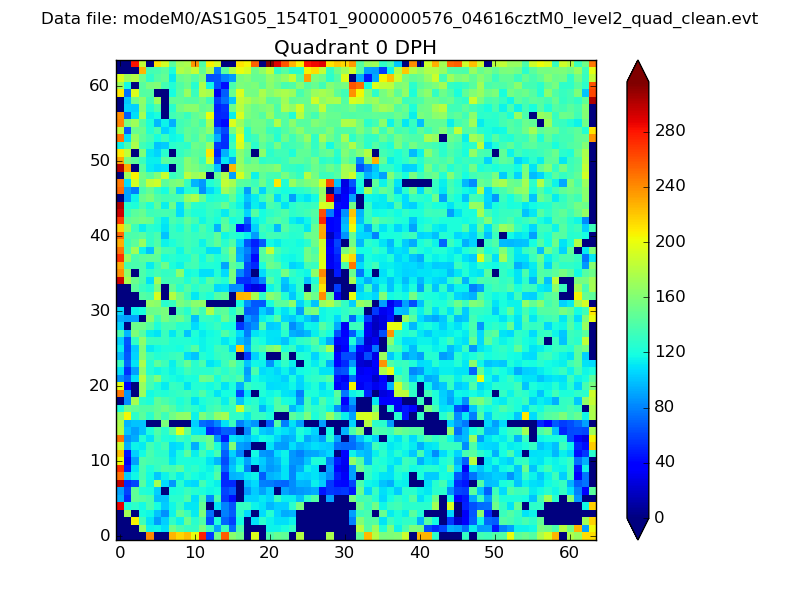 |
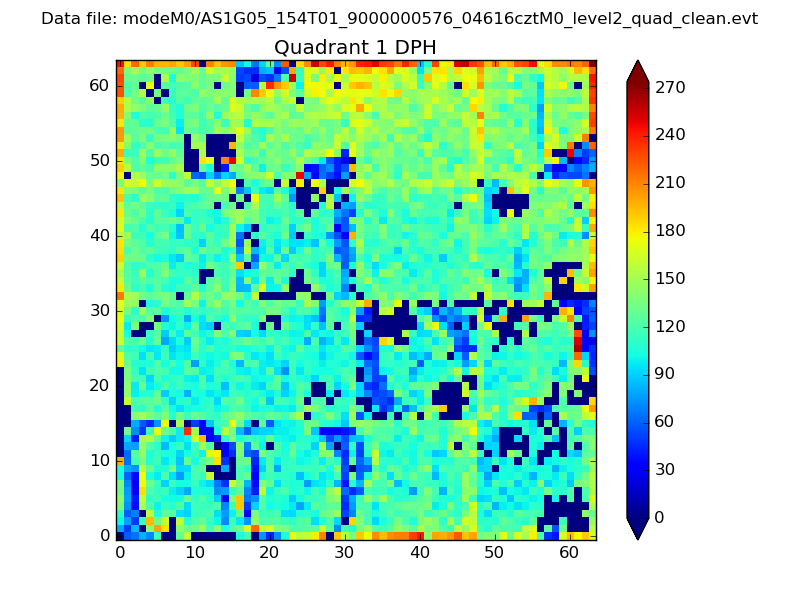 |
Quadrant B |
|---|---|---|---|
| Quadrant D | 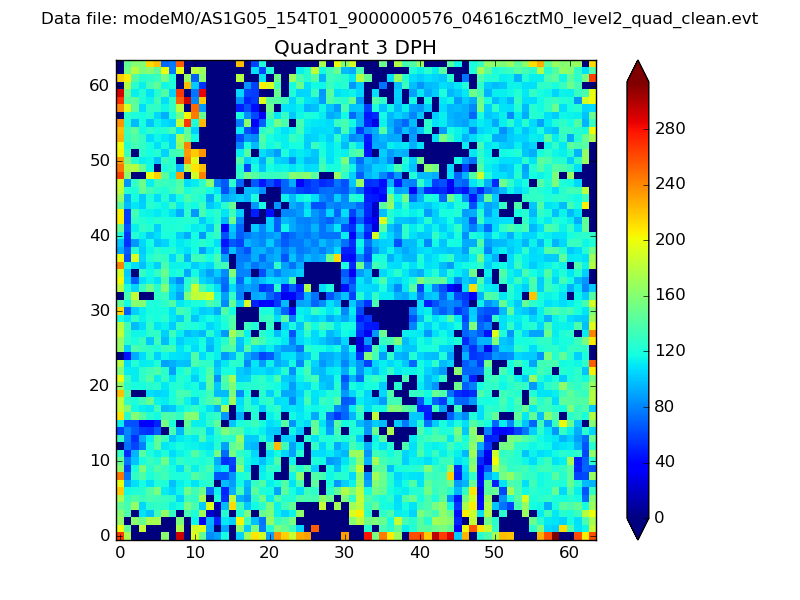 |
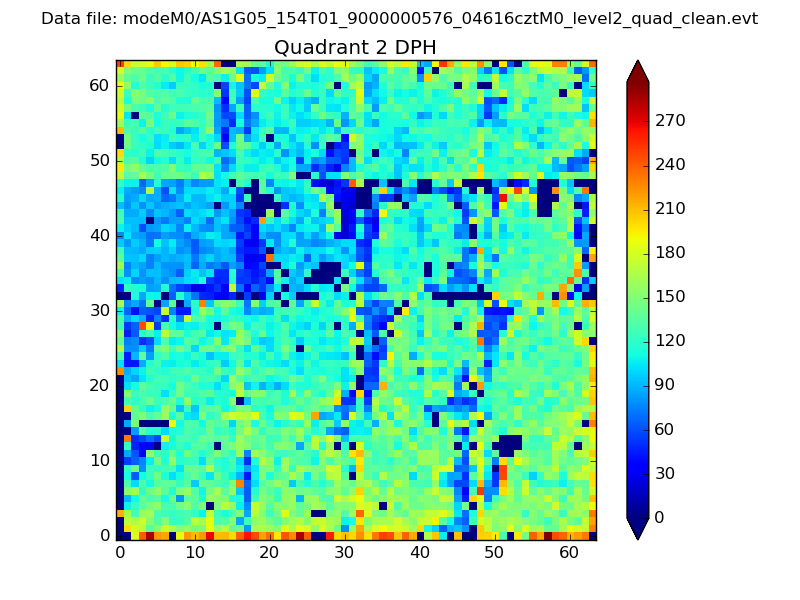 |
Quadrant C |
| Plot type | Count rate plots | Images |
|---|---|---|
| Comparison with Poisson distribution Blue bars denote a histogram of data divided into 1 sec bins. Red curve is a Poisson curve with rate = median count rate of data. |
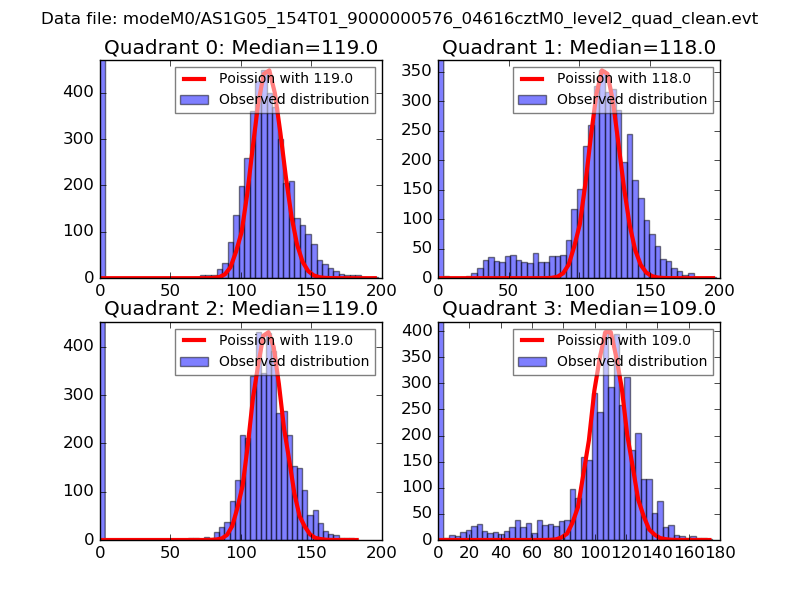 |
 |
| Quadrant-wise count rates Data is divided into 100 sec bins |
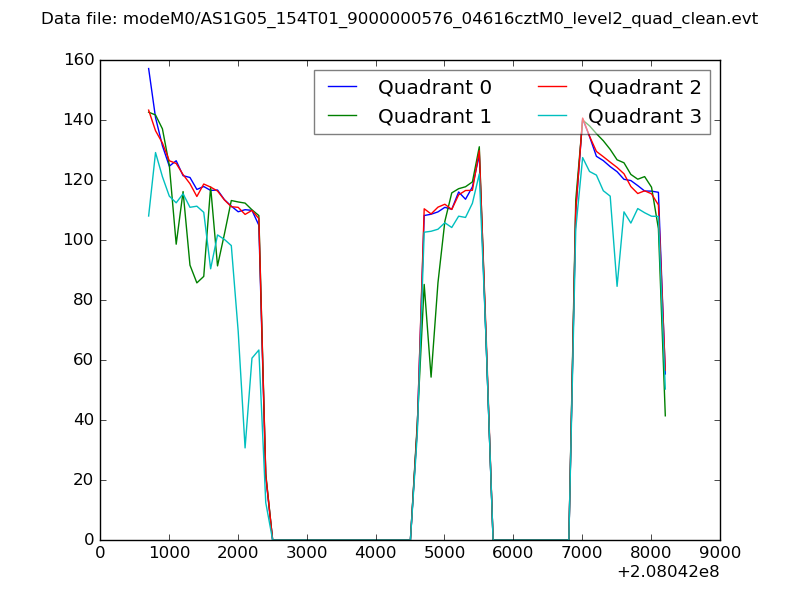 |
|
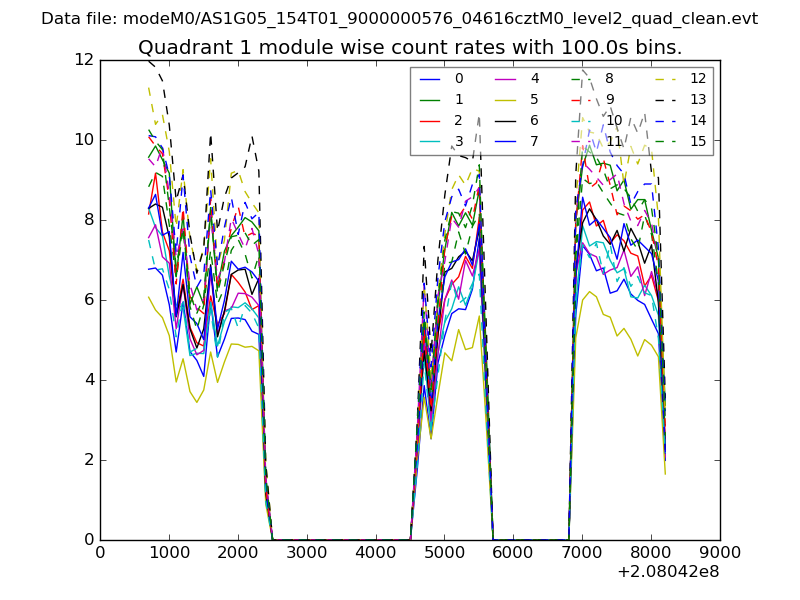
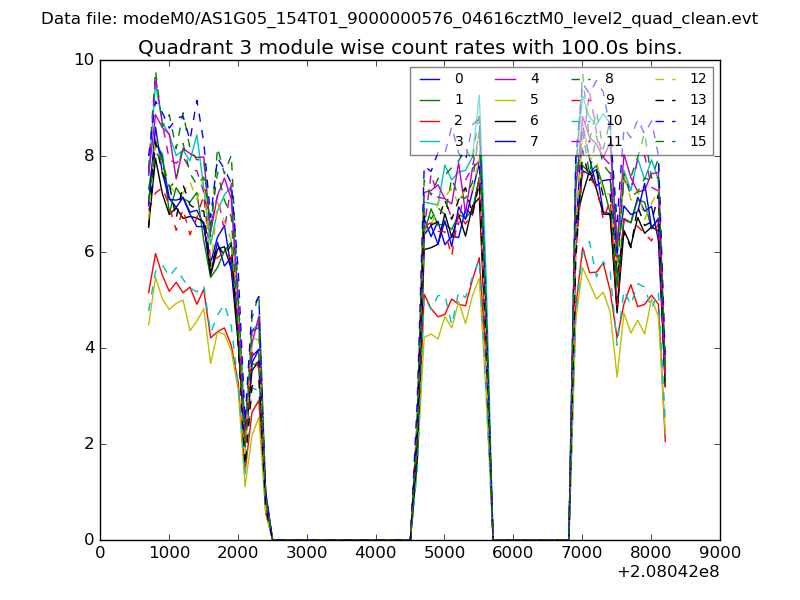
| Module-wise count rates for Quadrant A Data is divided into 100 sec bins |
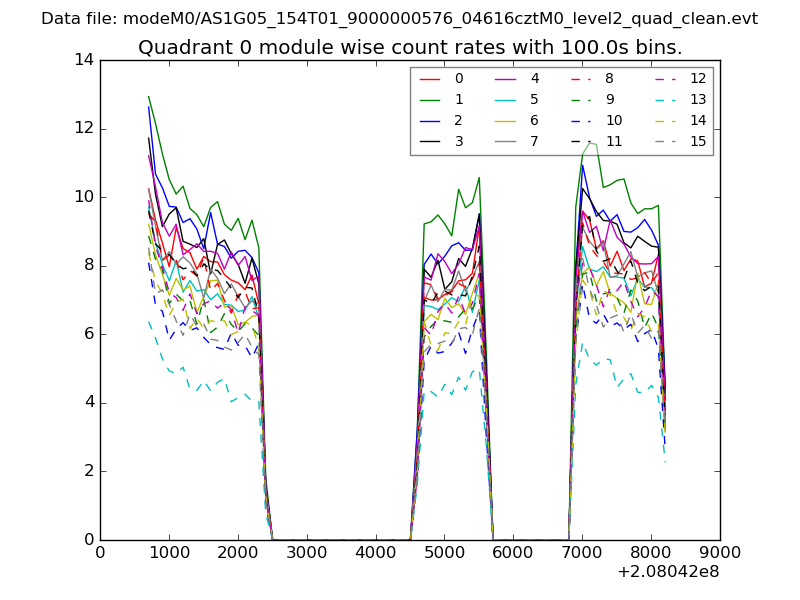 |
 |
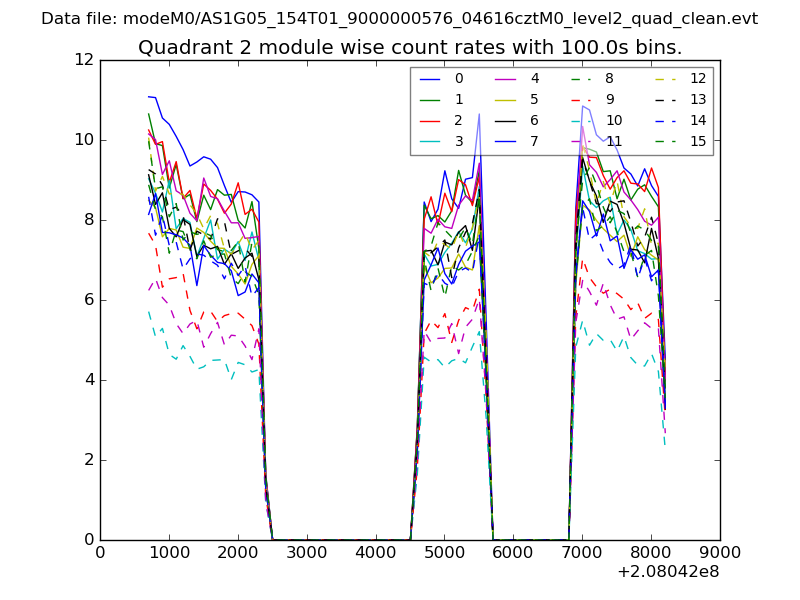
| Module-wise count rates for Quadrant B Data is divided into 100 sec bins |
 |
 |
| Module-wise count rates for Quadrant C Data is divided into 100 sec bins |
 |
 |
| Module-wise count rates for Quadrant D Data is divided into 100 sec bins |
 |
 |
| Parameter | Plot |
|---|---|
| CZT HV Monitor | 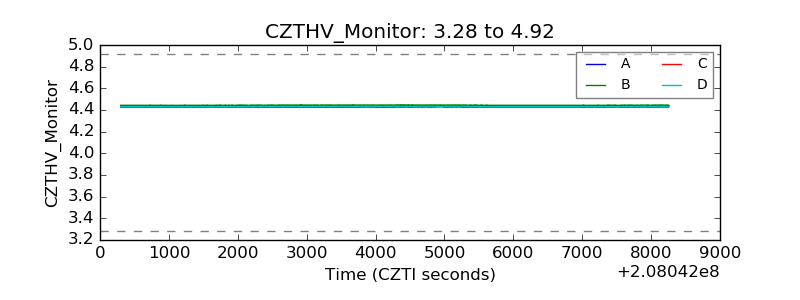 |
| D_VDD | 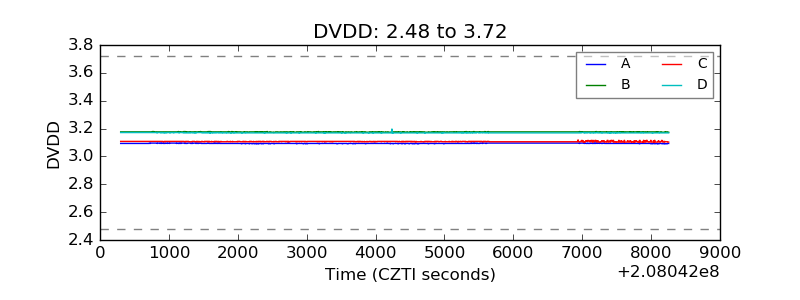 |
| Temperature 1 | 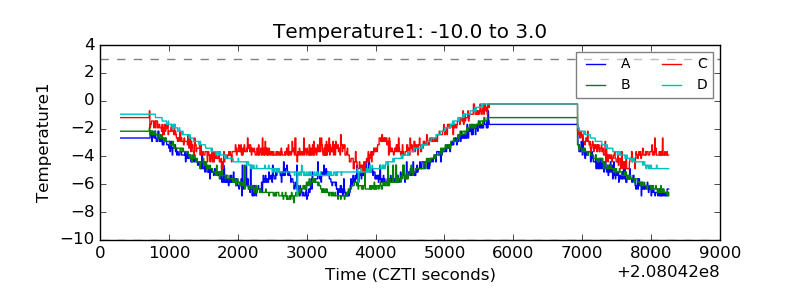 |
| Veto HV Monitor | 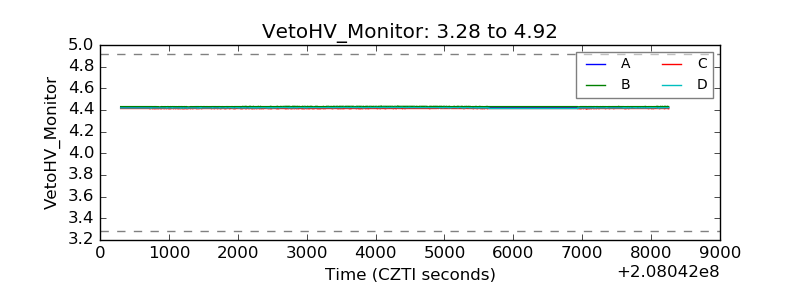 |
| Veto LLD | 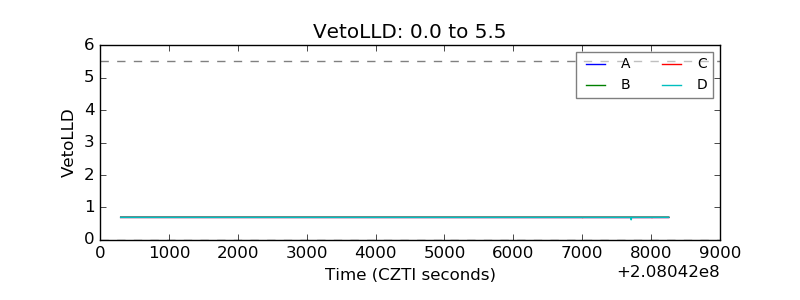 |
| Alpha Counter | 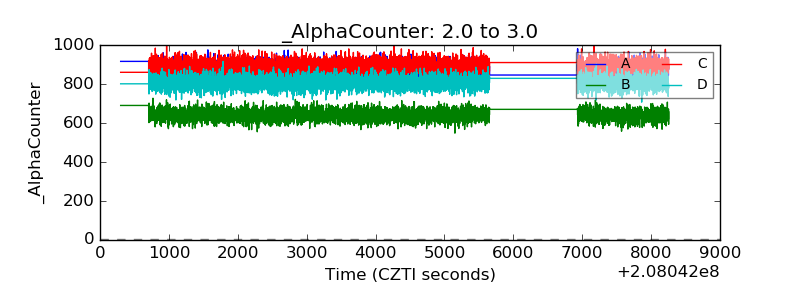 |
| _CPM_Rate | 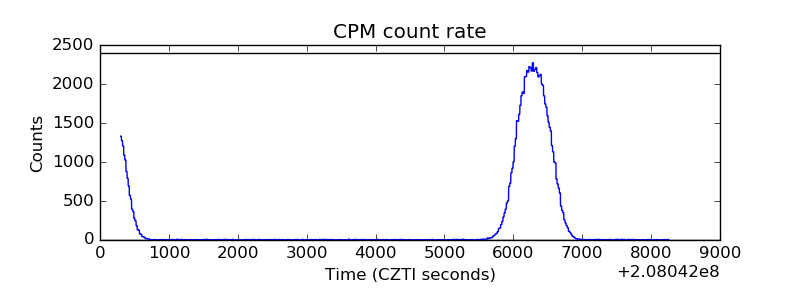 |
| CZT Counter | 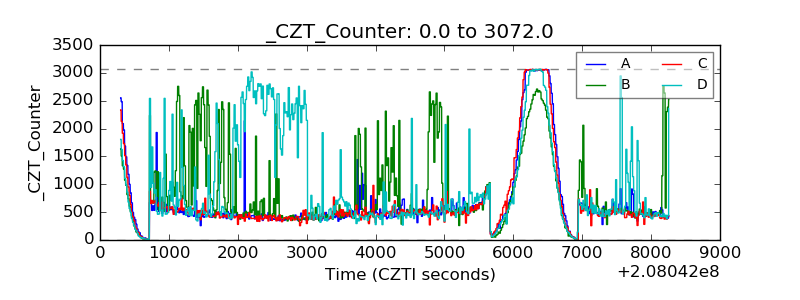 |
| +2.5 Volts monitor |  |
| +5 Volts monitor | 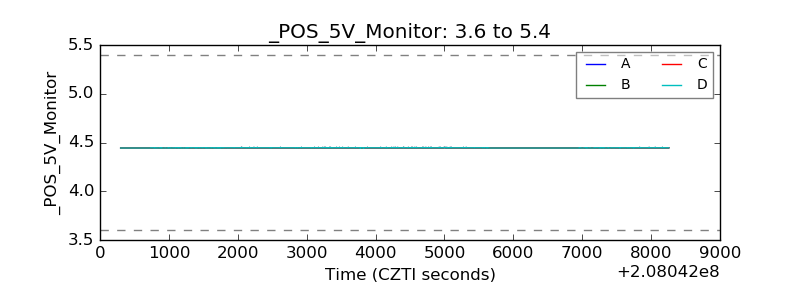 |
| _ROLL_ROT |  |
| _Roll_DEC | 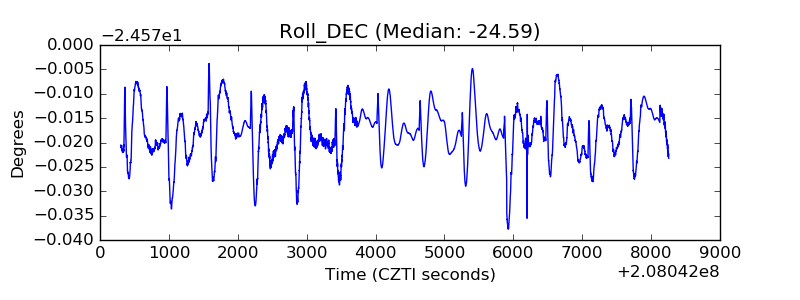 |
| _Roll_RA | 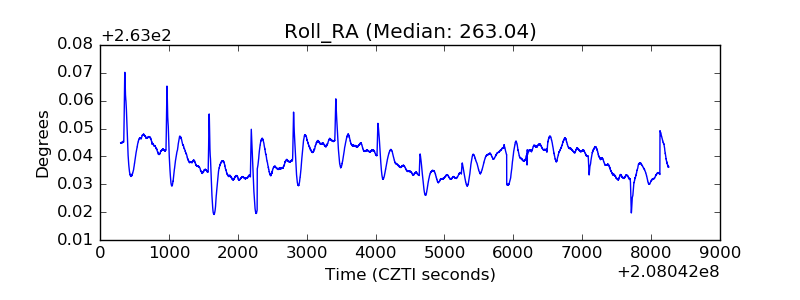 |
| Veto Counter | 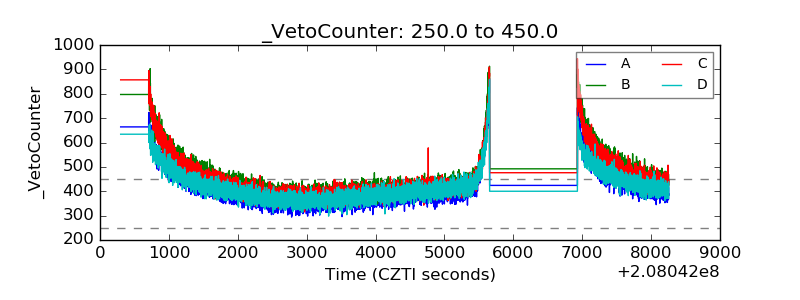 |