| Param | Original file | Final file |
|---|---|---|
| Filename | modeM0/AS1G05_154T01_9000000576_04617cztM0_level2.evt | modeM0/AS1G05_154T01_9000000576_04617cztM0_level2_quad_clean.evt |
| Size (bytes) | 490,176,000 | 70,453,440 |
| Size | 467.5 MB | 67.2 MB |
| Events in quadrant A | 3,080,700 | 432,674 |
| Events in quadrant B | 4,001,976 | 438,306 |
| Events in quadrant C | 3,079,527 | 432,584 |
| Events in quadrant D | 4,260,409 | 395,093 |
| Mode SS | |||
|---|---|---|---|
| Quadrant | BADHDUFLAG | Total packets | Discarded packets |
| A | 0 | 128 | 0 |
| B | 0 | 128 | 0 |
| C | 0 | 128 | 0 |
| D | 0 | 128 | 0 |
| Mode M9 | |||
|---|---|---|---|
| Quadrant | BADHDUFLAG | Total packets | Discarded packets |
| A | 0 | 20 | 0 |
| B | 0 | 20 | 0 |
| C | 0 | 20 | 0 |
| D | 0 | 21 | 0 |
| Mode M0 | |||
|---|---|---|---|
| Quadrant | BADHDUFLAG | Total packets | Discarded packets |
| A | 0 | 13163 | 3 |
| B | 0 | 15769 | 2 |
| C | 0 | 13221 | 2 |
| D | 0 | 17023 | 2 |
| Quadrant | Total seconds | Saturated seconds | Saturation percentage |
|---|---|---|---|
| A | 6216 | 23 | 0.370013% |
| B | 6216 | 278 | 4.472329% |
| C | 6216 | 43 | 0.691763% |
| D | 6216 | 329 | 5.292793% |
Noise dominated data is calculated using 1-second bins in cleaned event files. If a bin has >2000 counts, and if more than 50% of those come from <1% of pixels, then it is considered to be noise-dominated and hence unusable.
| Quadrant | # 1 sec bins | Bins with >0 counts | Bins with >2000 counts | High rate bins dominated by noise | Noise dominated (total time) | Noise dominated (detector-on time) | Marked lightcurve |
|---|---|---|---|---|---|---|---|
| A | 7571 | 6217 | 4 | 4 | 0.05% | 0.06% | 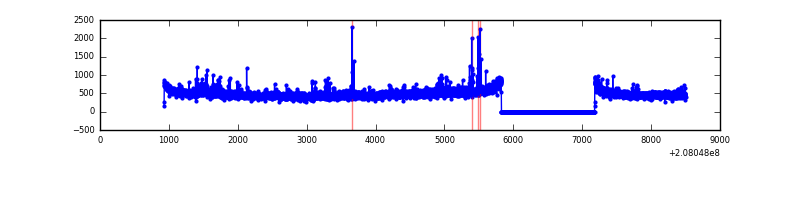 |
| B | 7571 | 6217 | 180 | 180 | 2.38% | 2.90% | 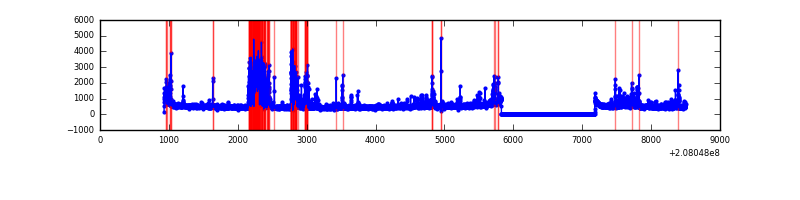 |
| C | 7571 | 6217 | 26 | 26 | 0.34% | 0.42% | 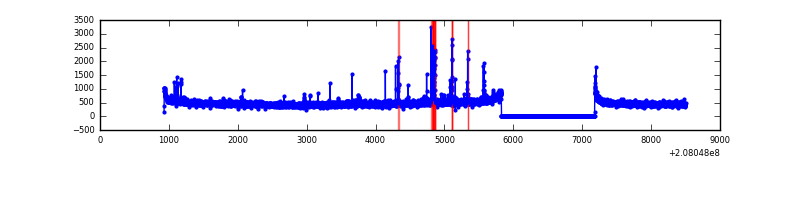 |
| D | 7571 | 6217 | 298 | 298 | 3.94% | 4.79% | 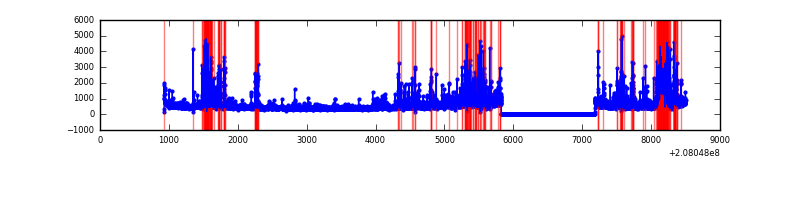 |
Top three noisy pixels from each quadrant. If the there are fewer than three noisy pixels in the level2.evt file, extra rows are filled as -1
| Pixel properties | Quadrant properties | ||||||
|---|---|---|---|---|---|---|---|
| Quadrant | DetID | PixID | Counts | Sigma | Mean | Median | Sigma |
| A | 13 | 251 | 80650 | 517.05 | 757 | 742 | 154.5 |
| A | 8 | 15 | 67696 | 433.23 | 757 | 742 | 154.5 |
| A | 15 | 174 | 9510 | 56.73 | 757 | 742 | 154.5 |
| B | 5 | 200 | 659970 | 4529.65 | 764 | 750 | 145.5 |
| B | 14 | 167 | 172036 | 1176.95 | 764 | 750 | 145.5 |
| B | 10 | 246 | 48025 | 324.84 | 764 | 750 | 145.5 |
| C | 9 | 247 | 147702 | 855.48 | 737 | 743 | 171.8 |
| C | 14 | 48 | 28279 | 160.29 | 737 | 743 | 171.8 |
| C | 8 | 128 | 7324 | 38.31 | 737 | 743 | 171.8 |
| D | 8 | 112 | 758109 | 4450.55 | 707 | 686 | 170.2 |
| D | 13 | 235 | 591716 | 3472.84 | 707 | 686 | 170.2 |
| D | 2 | 136 | 92882 | 541.74 | 707 | 686 | 170.2 |
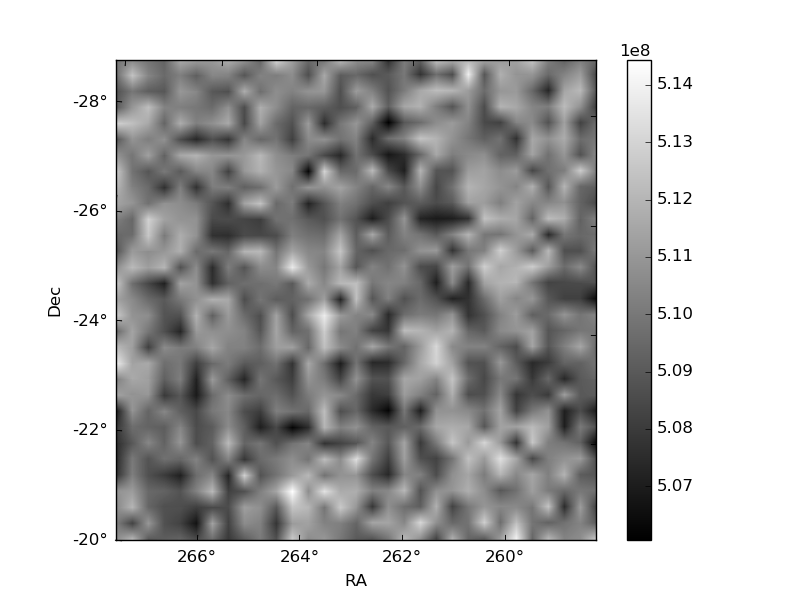
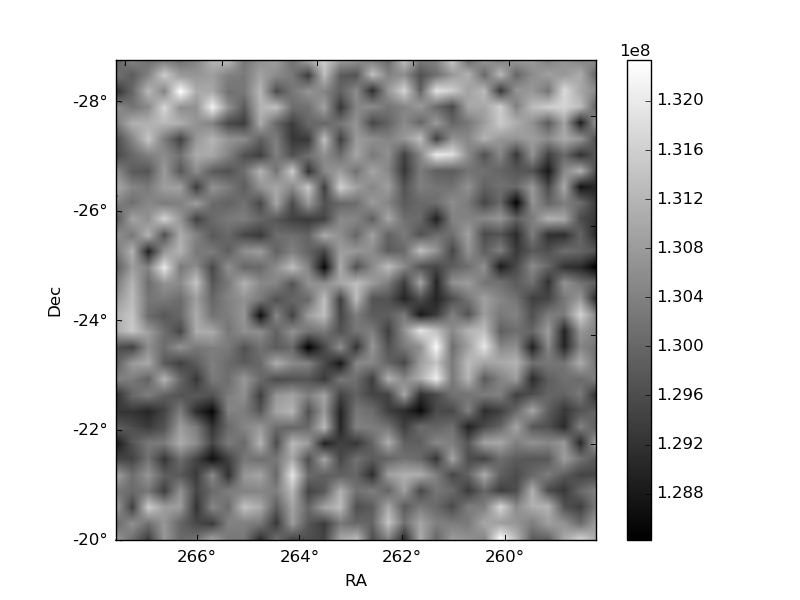
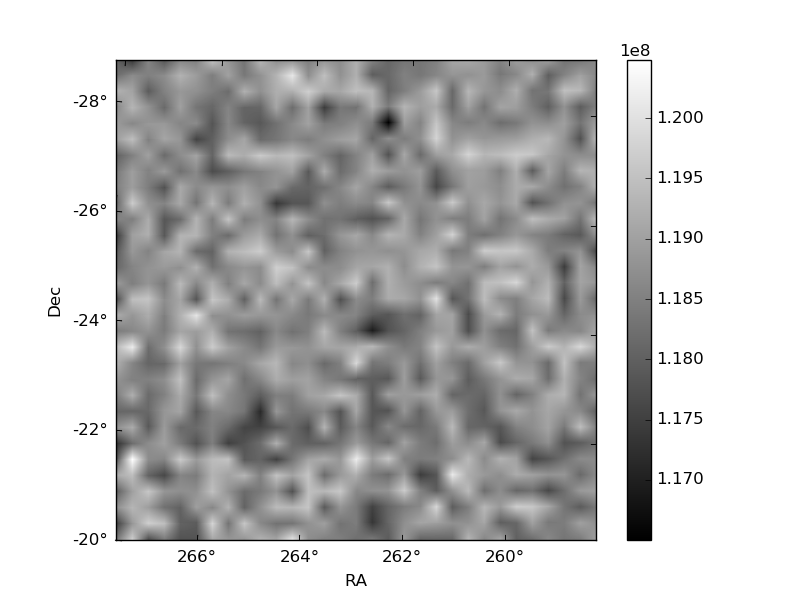
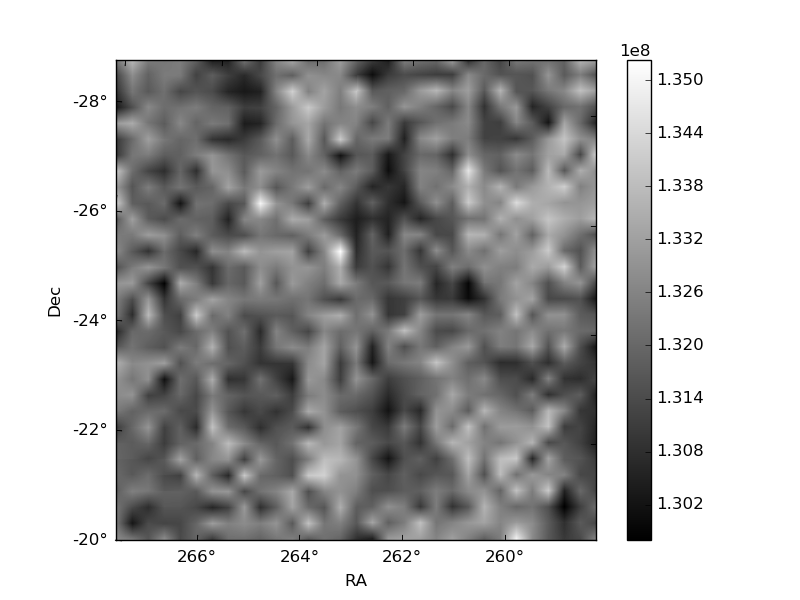
Histogram calculated using DETX and DETY for each event in the final _common_clean file
| Quadrant A | 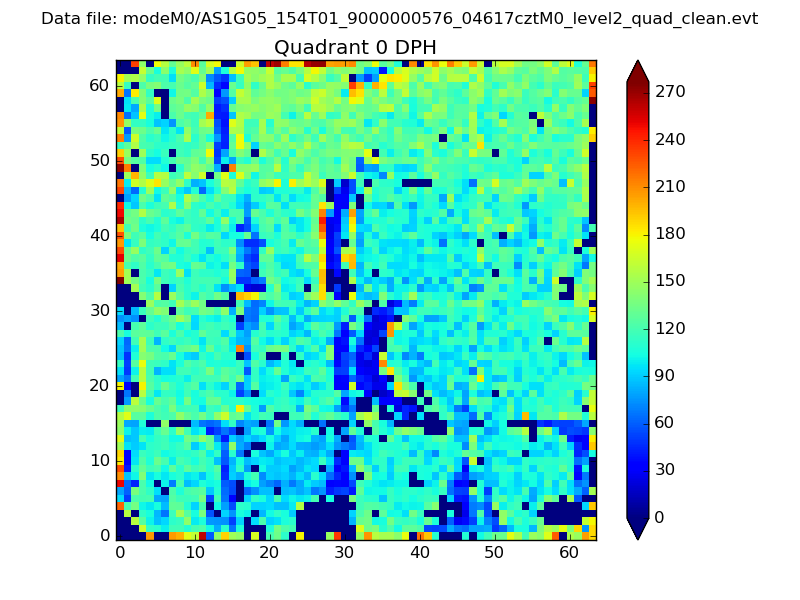 |
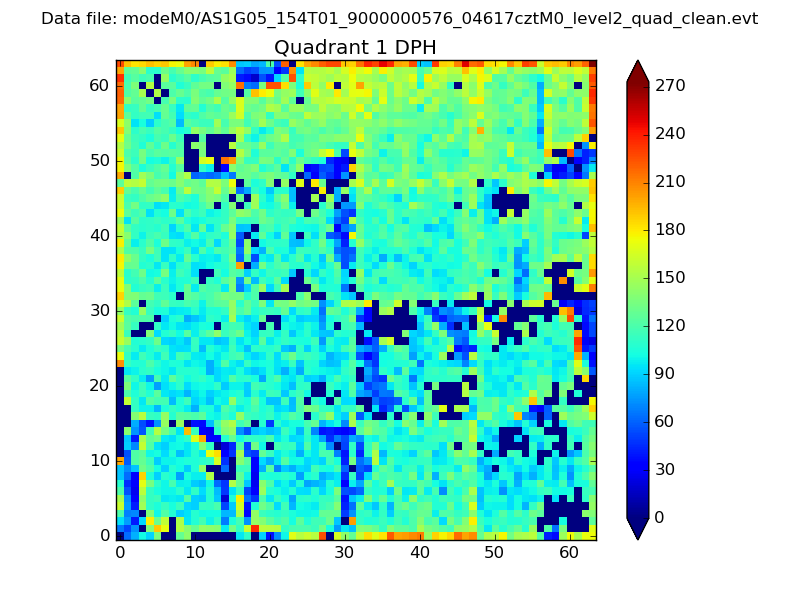 |
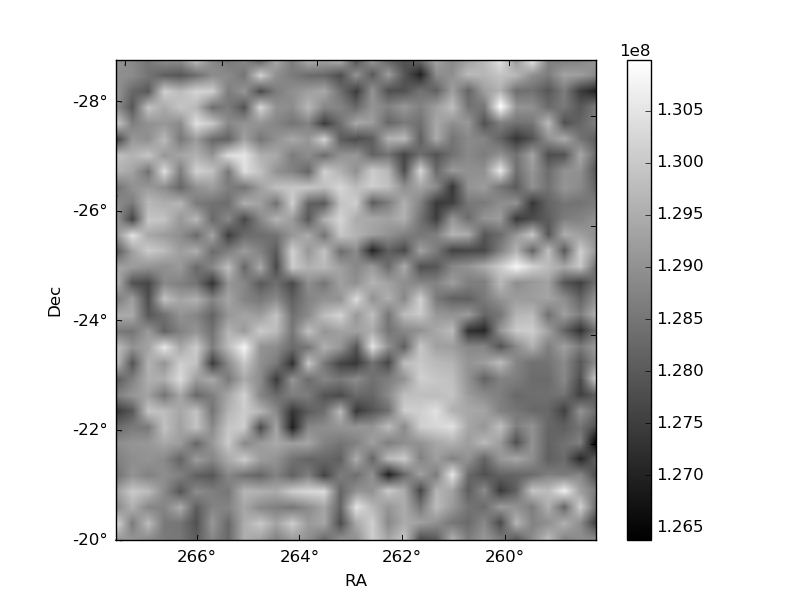
Quadrant B |
|---|---|---|---|
| Quadrant D | 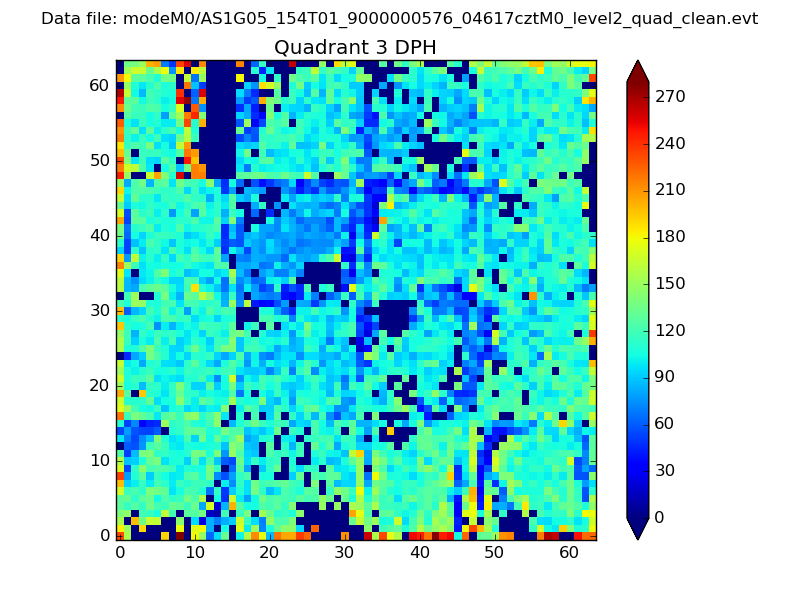 |
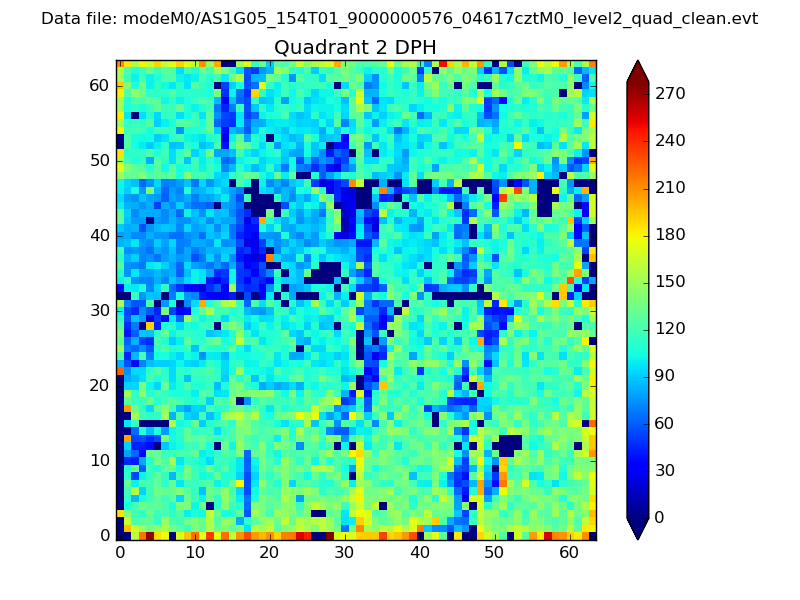 |
Quadrant C |
| Plot type | Count rate plots | Images |
|---|---|---|
| Comparison with Poisson distribution Blue bars denote a histogram of data divided into 1 sec bins. Red curve is a Poisson curve with rate = median count rate of data. |
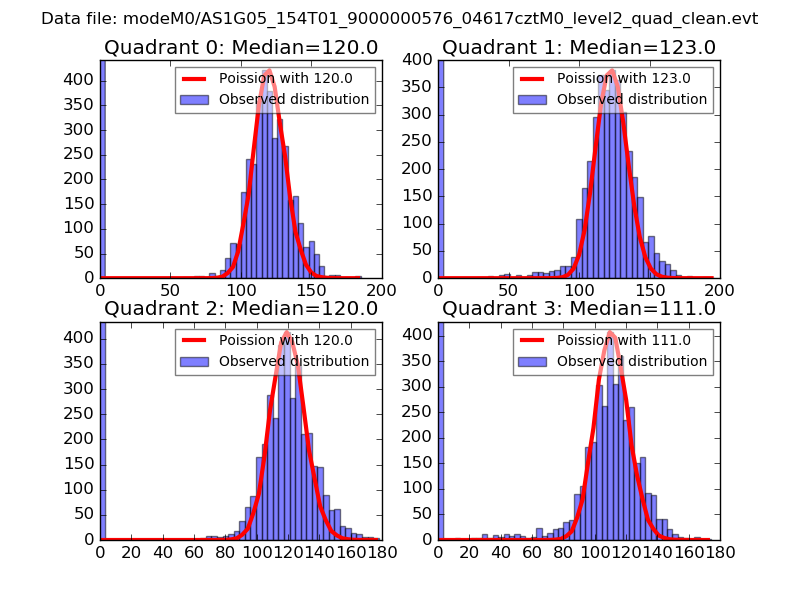 |
 |
| Quadrant-wise count rates Data is divided into 100 sec bins |
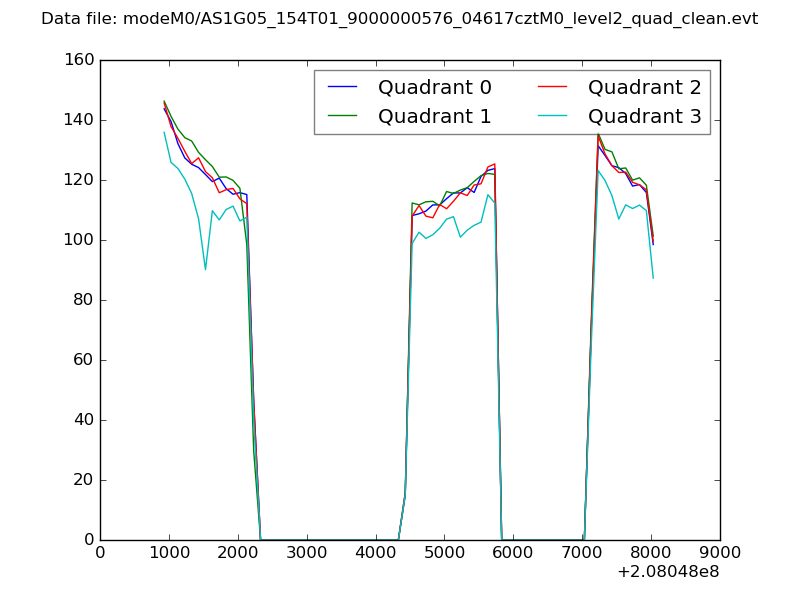 |
|
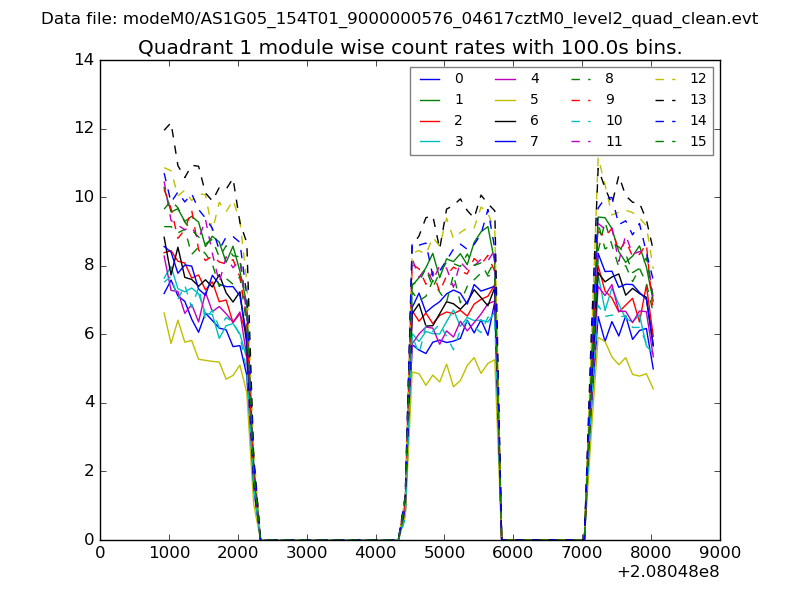
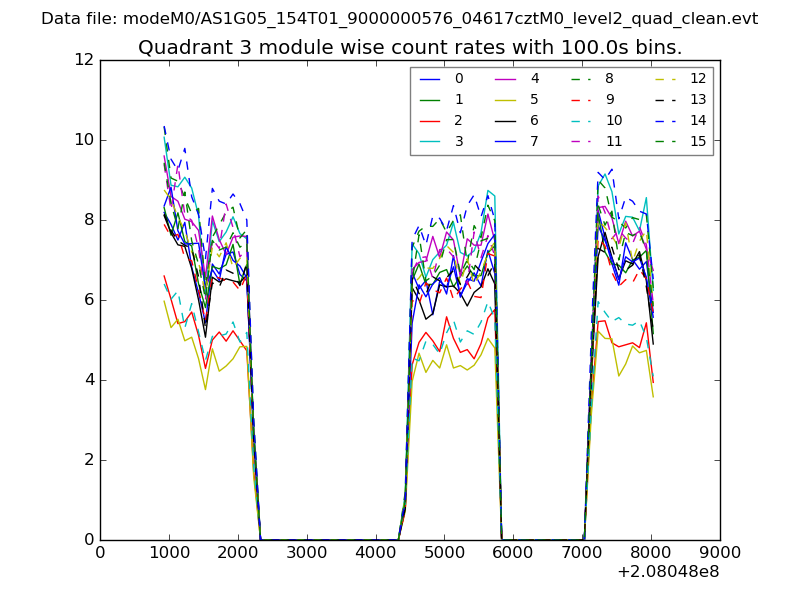
| Module-wise count rates for Quadrant A Data is divided into 100 sec bins |
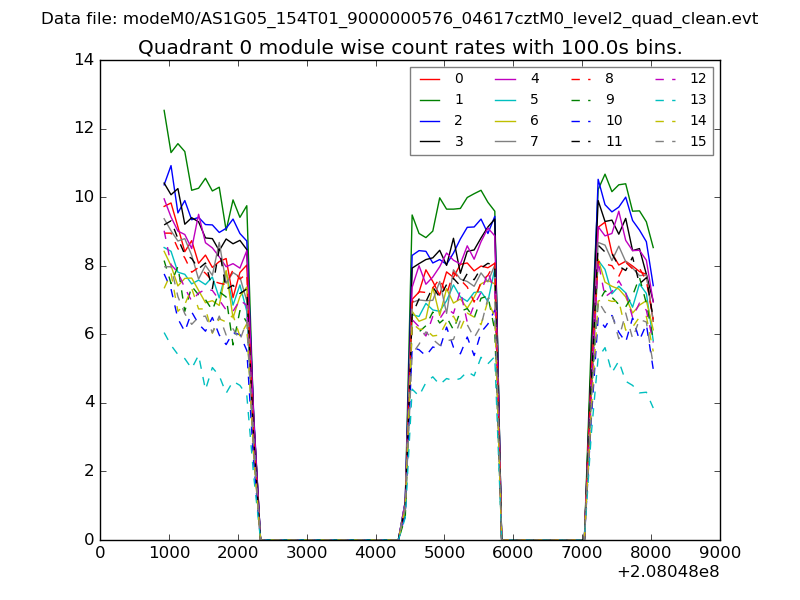 |
 |
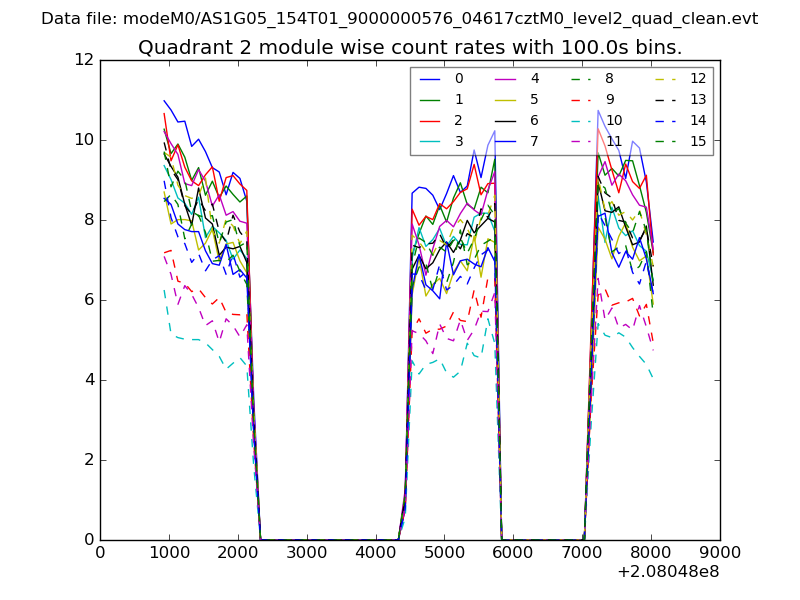
| Module-wise count rates for Quadrant B Data is divided into 100 sec bins |
 |
 |
| Module-wise count rates for Quadrant C Data is divided into 100 sec bins |
 |
 |
| Module-wise count rates for Quadrant D Data is divided into 100 sec bins |
 |
 |
| Parameter | Plot |
|---|---|
| CZT HV Monitor | 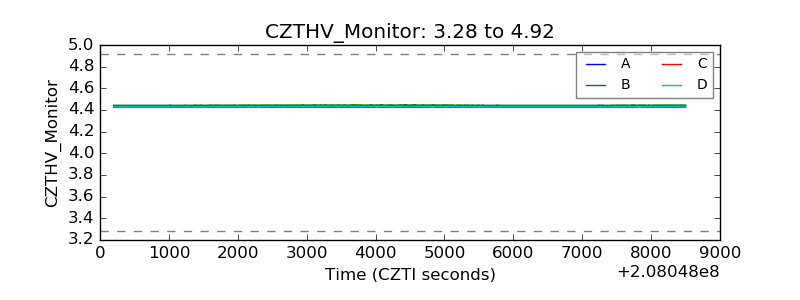 |
| D_VDD | 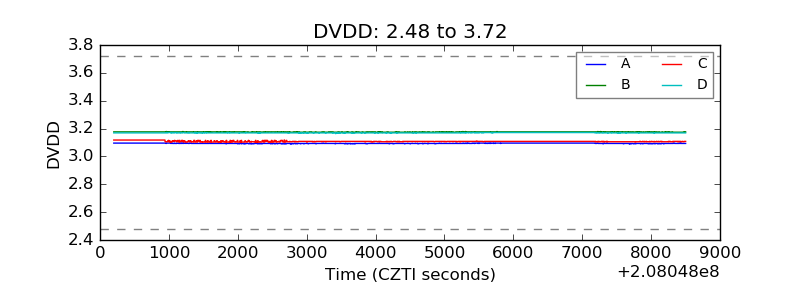 |
| Temperature 1 | 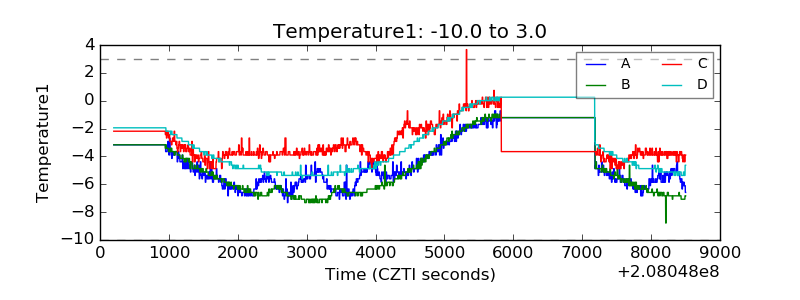 |
| Veto HV Monitor | 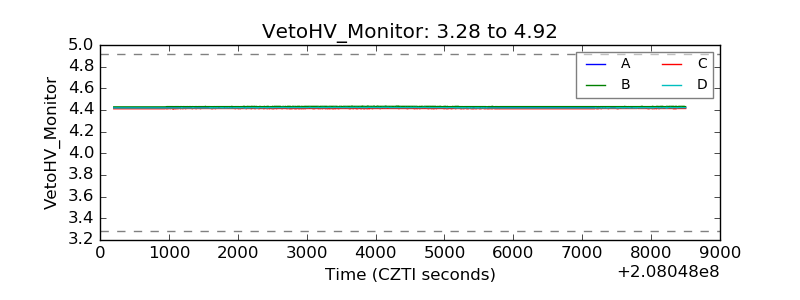 |
| Veto LLD | 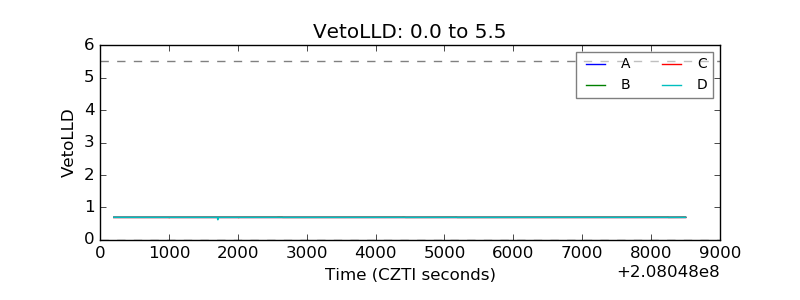 |
| Alpha Counter | 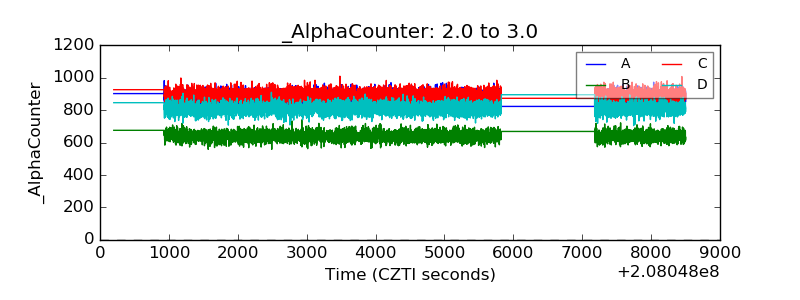 |
| _CPM_Rate | 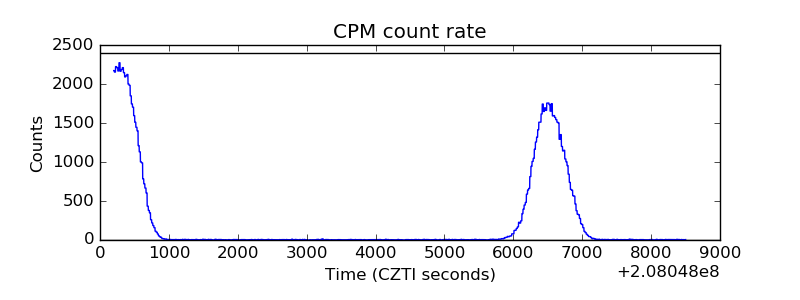 |
| CZT Counter | 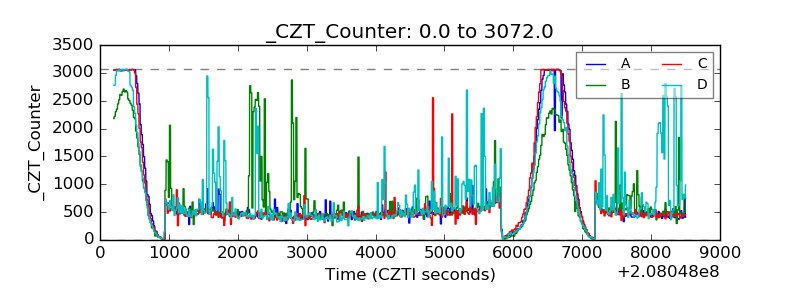 |
| +2.5 Volts monitor |  |
| +5 Volts monitor |  |
| _ROLL_ROT | 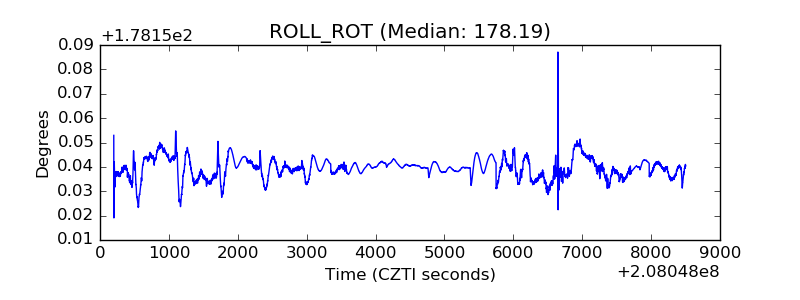 |
| _Roll_DEC | 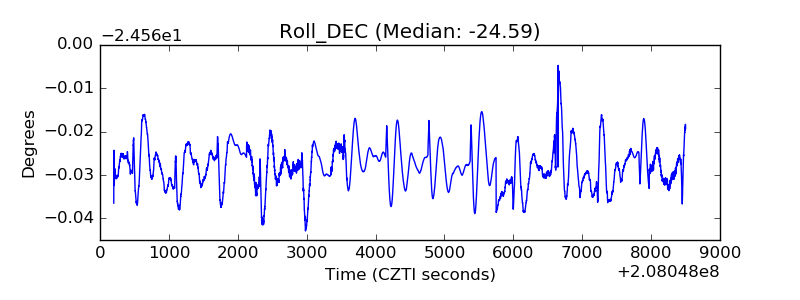 |
| _Roll_RA | 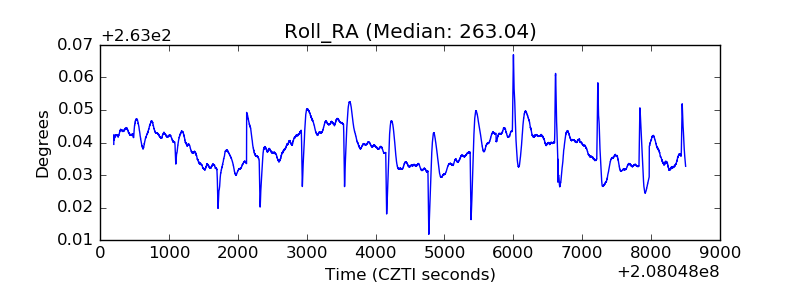 |
| Veto Counter | 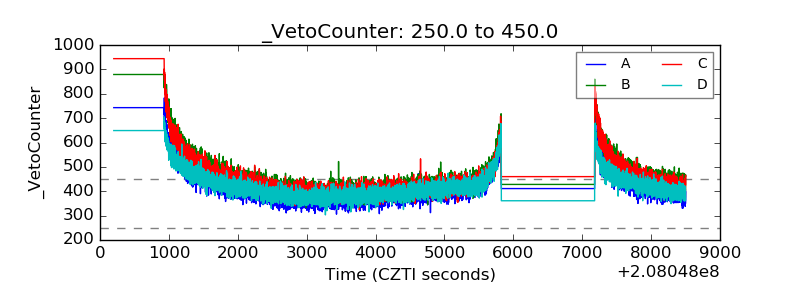 |