| Param | Original file | Final file |
|---|---|---|
| Filename | modeM0/AS1G05_154T01_9000000576_04619cztM0_level2.evt | modeM0/AS1G05_154T01_9000000576_04619cztM0_level2_quad_clean.evt |
| Size (bytes) | 637,597,440 | 60,946,560 |
| Size | 608.1 MB | 58.1 MB |
| Events in quadrant A | 3,420,888 | 349,299 |
| Events in quadrant B | 3,711,767 | 351,903 |
| Events in quadrant C | 3,137,814 | 354,657 |
| Events in quadrant D | 8,577,521 | 314,501 |
| Mode SS | |||
|---|---|---|---|
| Quadrant | BADHDUFLAG | Total packets | Discarded packets |
| A | 0 | 138 | 0 |
| B | 0 | 138 | 0 |
| C | 0 | 138 | 0 |
| D | 0 | 138 | 0 |
| Mode M9 | |||
|---|---|---|---|
| Quadrant | BADHDUFLAG | Total packets | Discarded packets |
| A | 0 | 12 | 0 |
| B | 0 | 12 | 0 |
| C | 0 | 12 | 0 |
| D | 0 | 13 | 0 |
| Mode M0 | |||
|---|---|---|---|
| Quadrant | BADHDUFLAG | Total packets | Discarded packets |
| A | 0 | 14757 | 3 |
| B | 0 | 15366 | 2 |
| C | 0 | 13982 | 2 |
| D | 0 | 30068 | 2 |
| Quadrant | Total seconds | Saturated seconds | Saturation percentage |
|---|---|---|---|
| A | 6809 | 102 | 1.498017% |
| B | 6809 | 120 | 1.762373% |
| C | 6809 | 41 | 0.602144% |
| D | 6809 | 2225 | 32.677339% |
Noise dominated data is calculated using 1-second bins in cleaned event files. If a bin has >2000 counts, and if more than 50% of those come from <1% of pixels, then it is considered to be noise-dominated and hence unusable.
| Quadrant | # 1 sec bins | Bins with >0 counts | Bins with >2000 counts | High rate bins dominated by noise | Noise dominated (total time) | Noise dominated (detector-on time) | Marked lightcurve |
|---|---|---|---|---|---|---|---|
| A | 7839 | 6810 | 33 | 33 | 0.42% | 0.48% | 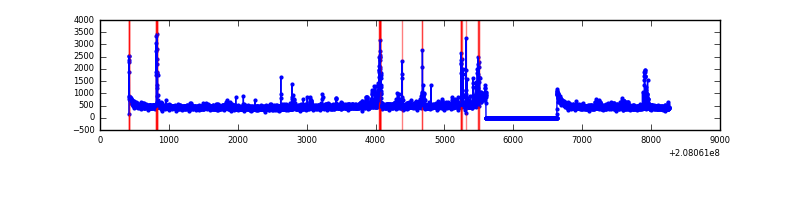 |
| B | 7839 | 6810 | 55 | 55 | 0.70% | 0.81% | 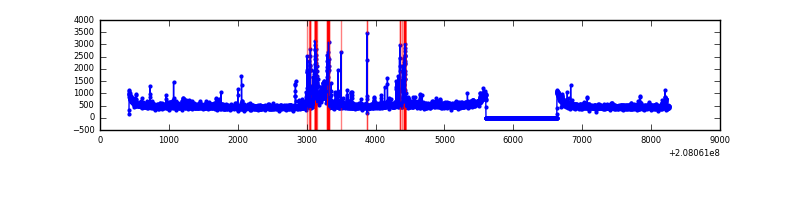 |
| C | 7839 | 6810 | 0 | 0 | 0.00% | 0.00% | 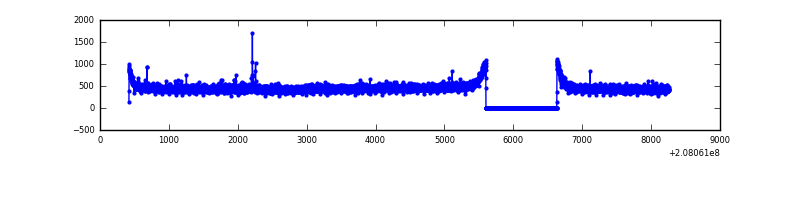 |
| D | 7839 | 6810 | 2106 | 2106 | 26.87% | 30.93% | 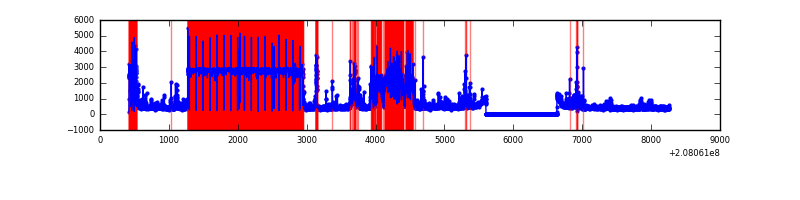 |
Top three noisy pixels from each quadrant. If the there are fewer than three noisy pixels in the level2.evt file, extra rows are filled as -1
| Pixel properties | Quadrant properties | ||||||
|---|---|---|---|---|---|---|---|
| Quadrant | DetID | PixID | Counts | Sigma | Mean | Median | Sigma |
| A | 8 | 15 | 127161 | 757.09 | 805 | 789 | 166.9 |
| A | 12 | 133 | 89893 | 533.82 | 805 | 789 | 166.9 |
| A | 0 | 118 | 56304 | 332.59 | 805 | 789 | 166.9 |
| B | 10 | 16 | 358412 | 2251.5 | 820 | 801 | 158.8 |
| B | 14 | 167 | 55729 | 345.82 | 820 | 801 | 158.8 |
| B | 4 | 48 | 30641 | 187.87 | 820 | 801 | 158.8 |
| C | 14 | 48 | 38674 | 204.69 | 789 | 792 | 185.1 |
| C | 9 | 54 | 11800 | 59.48 | 789 | 792 | 185.1 |
| C | 13 | 61 | 6508 | 30.89 | 789 | 792 | 185.1 |
| D | 13 | 235 | 5779127 | 38705.67 | 612 | 592 | 149.3 |
| D | 13 | 25 | 235582 | 1574.01 | 612 | 592 | 149.3 |
| D | 2 | 136 | 160853 | 1073.46 | 612 | 592 | 149.3 |
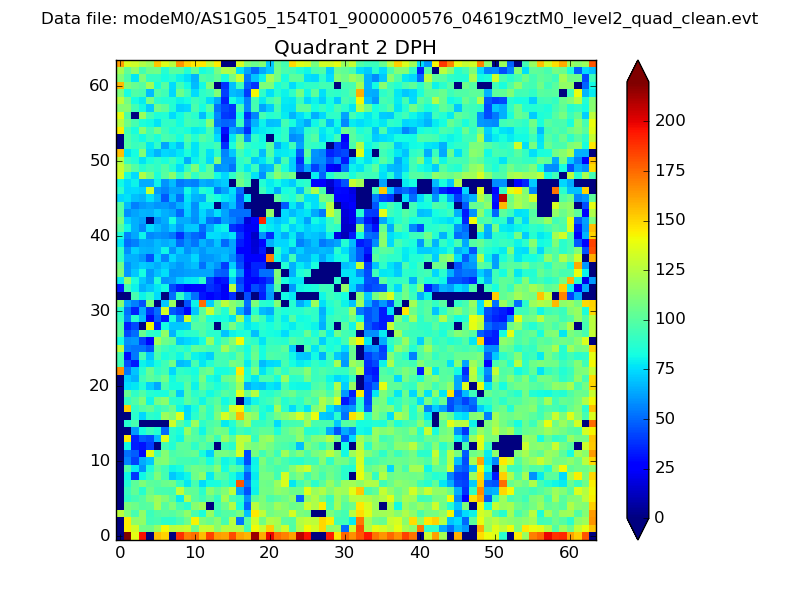
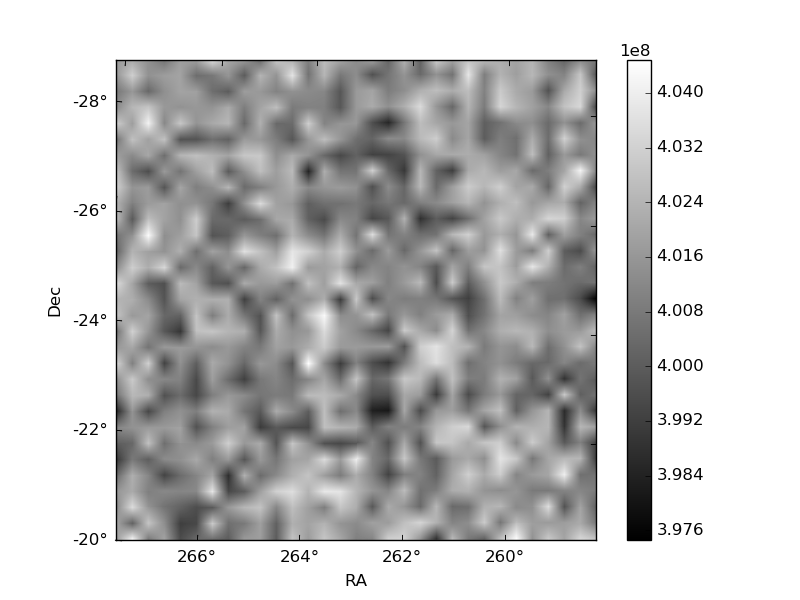
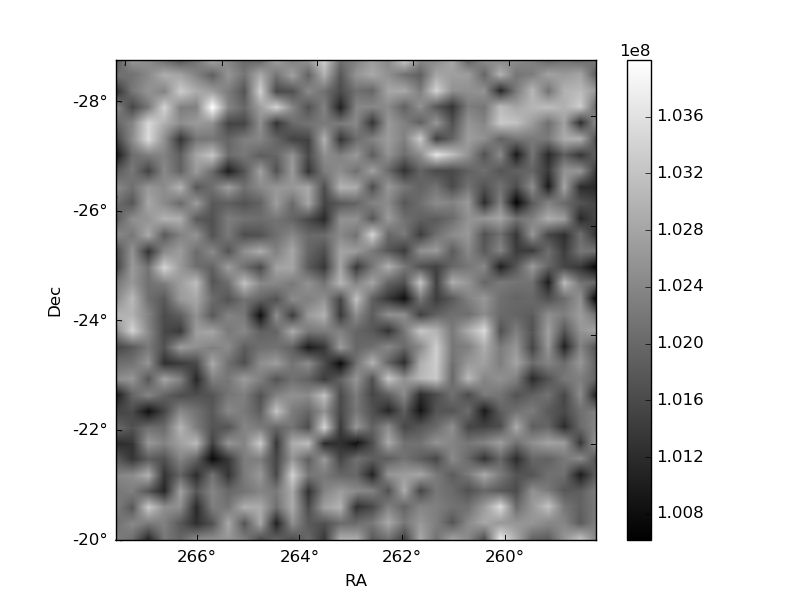
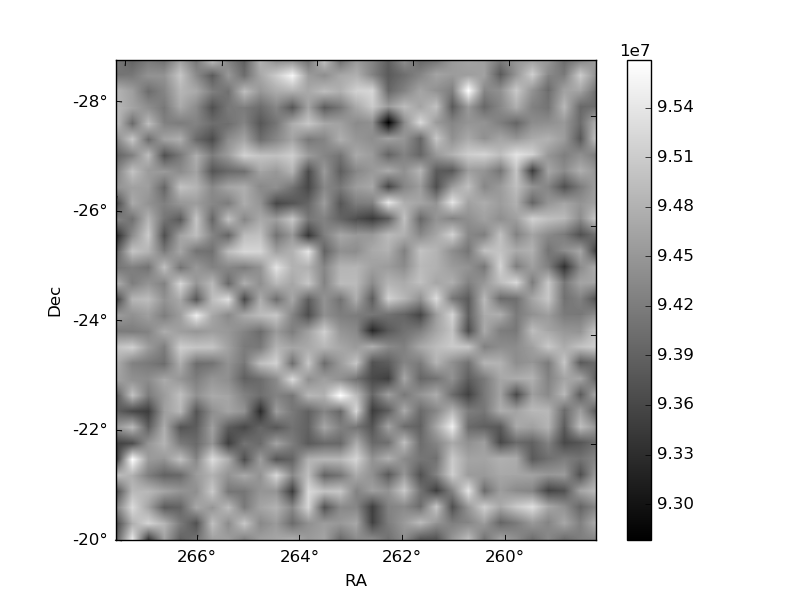
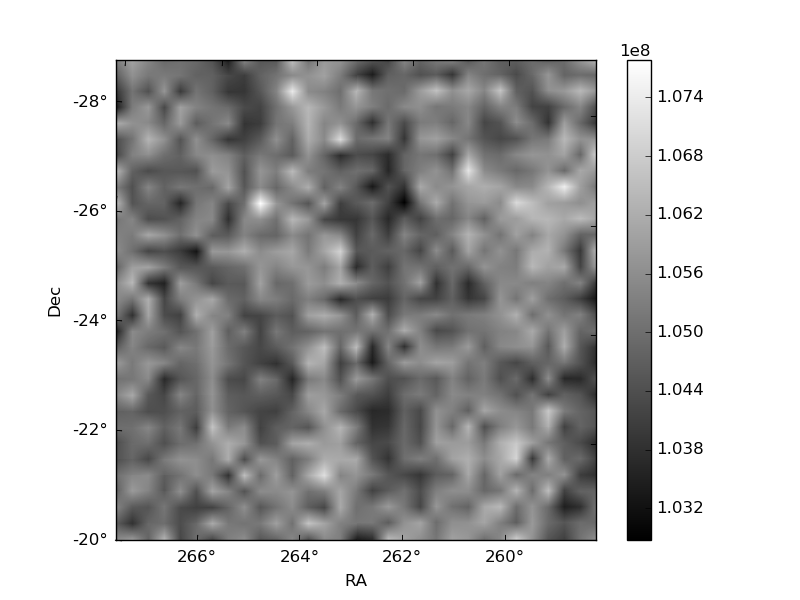
Histogram calculated using DETX and DETY for each event in the final _common_clean file
| Quadrant A | 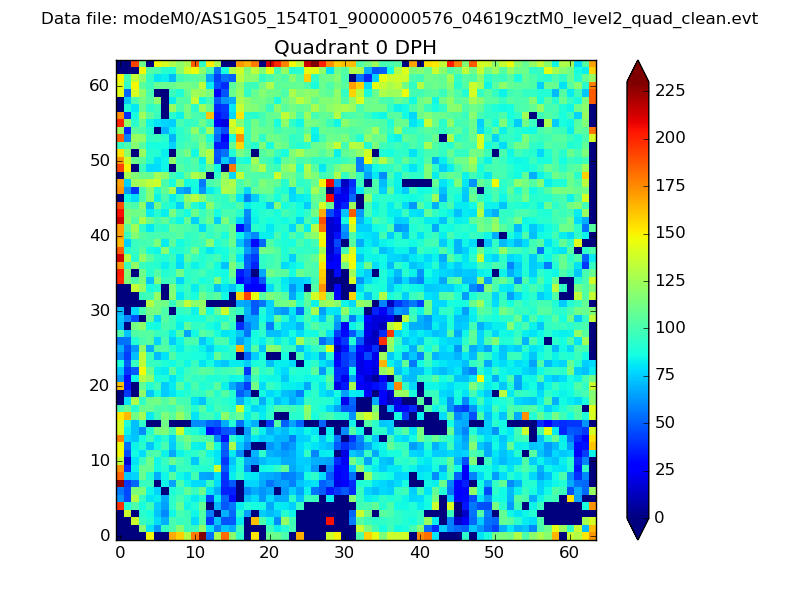 |
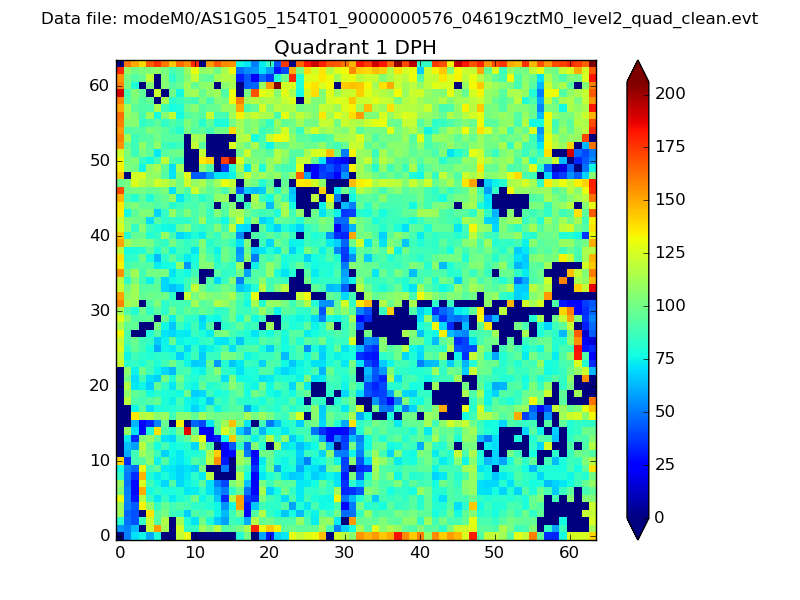 |
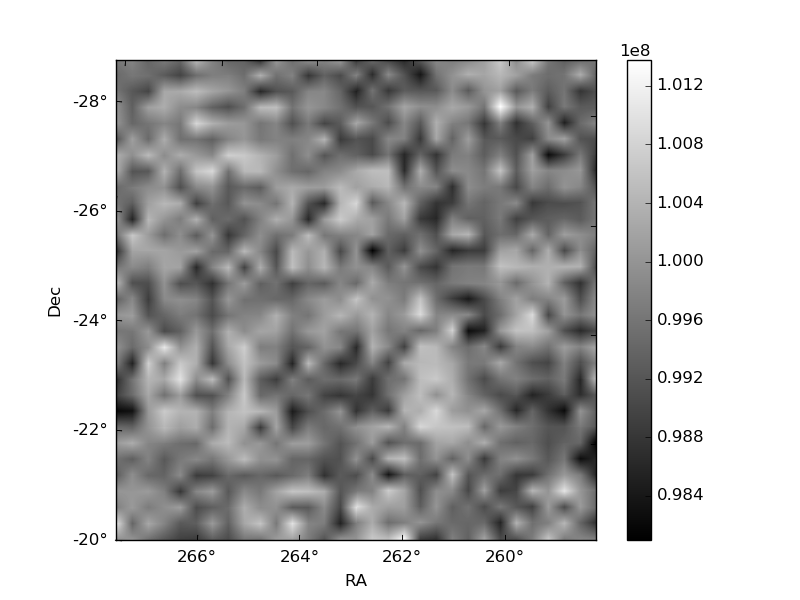
Quadrant B |
|---|---|---|---|
| Quadrant D | 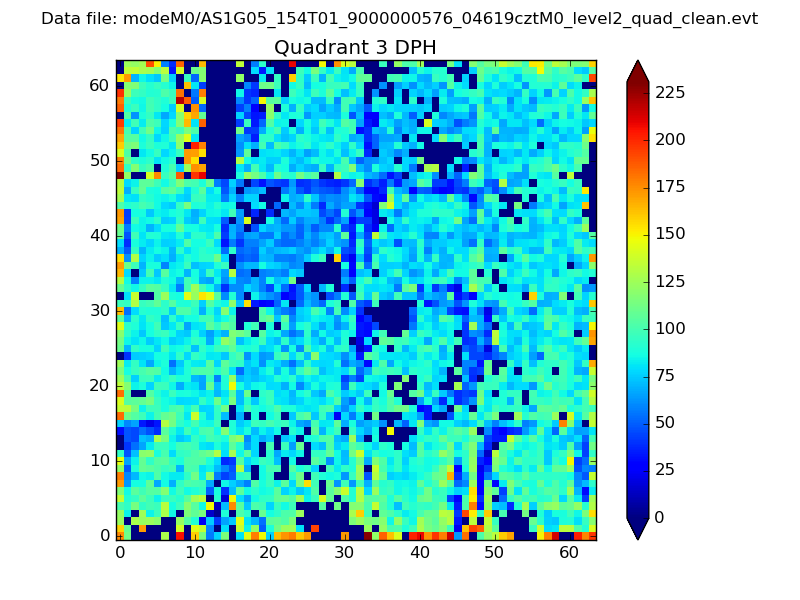 |
 |
Quadrant C |
| Plot type | Count rate plots | Images |
|---|---|---|
| Comparison with Poisson distribution Blue bars denote a histogram of data divided into 1 sec bins. Red curve is a Poisson curve with rate = median count rate of data. |
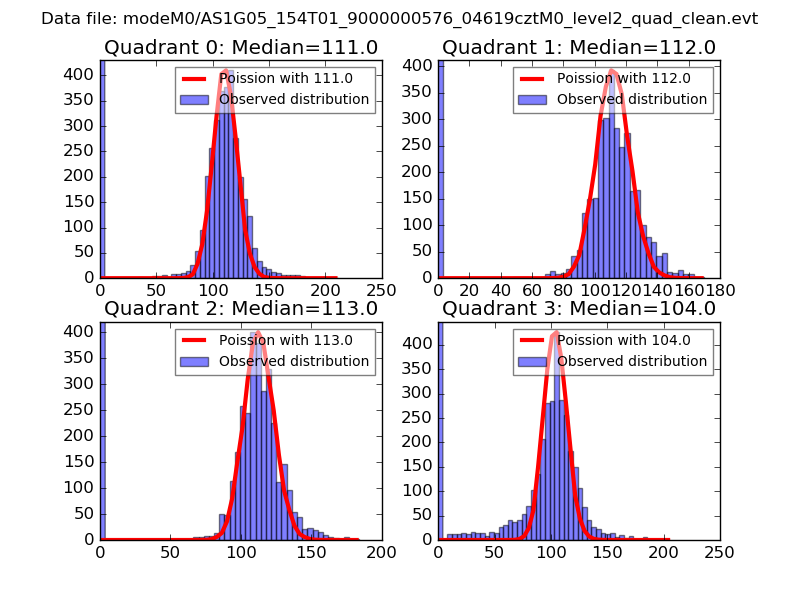 |
 |
| Quadrant-wise count rates Data is divided into 100 sec bins |
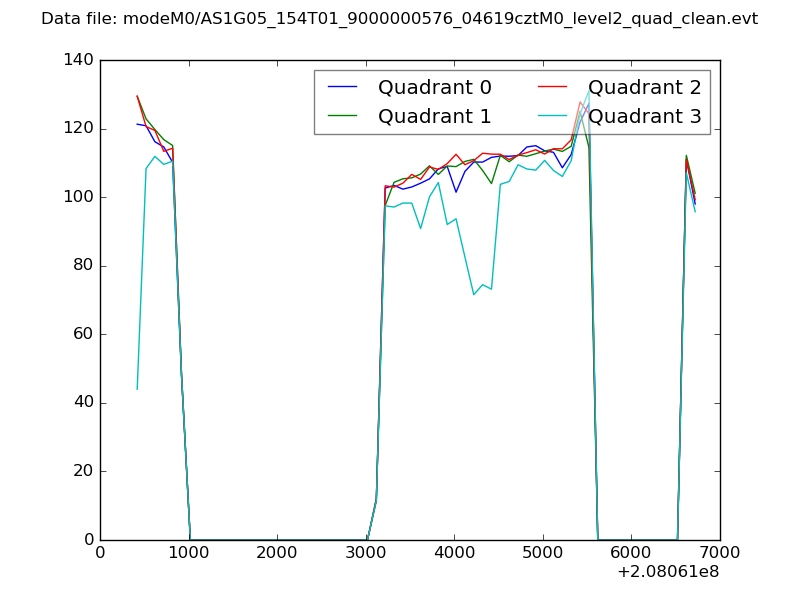 |
|
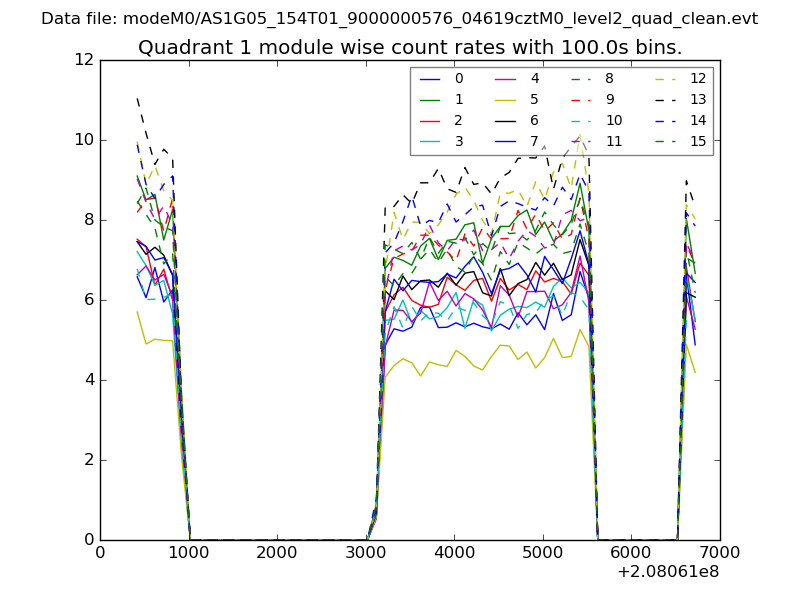
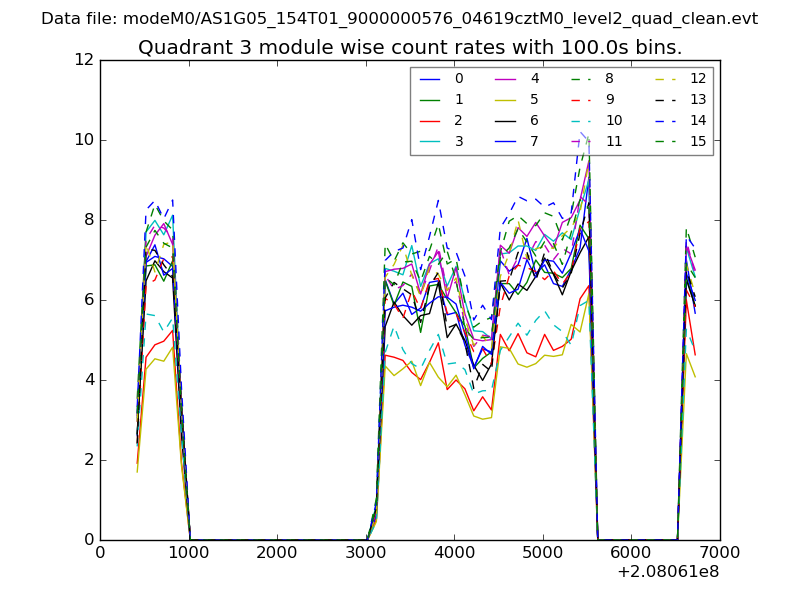
| Module-wise count rates for Quadrant A Data is divided into 100 sec bins |
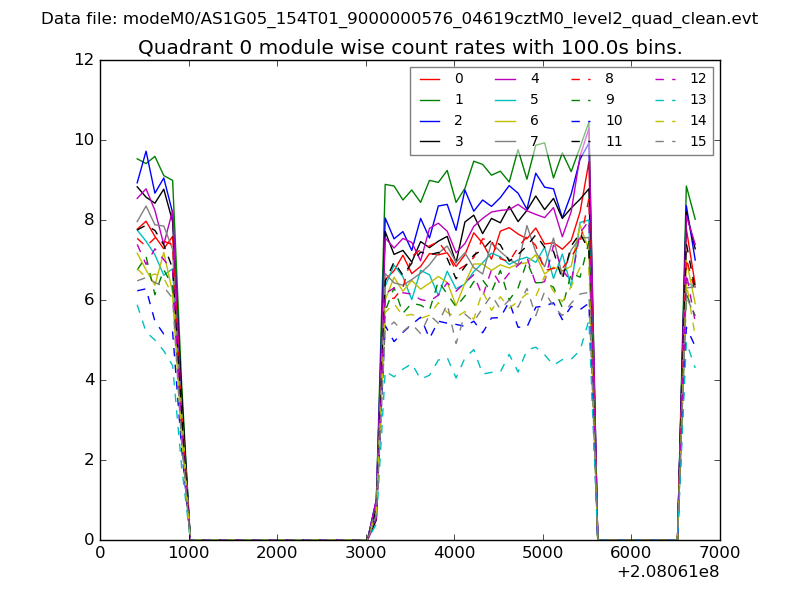 |
 |
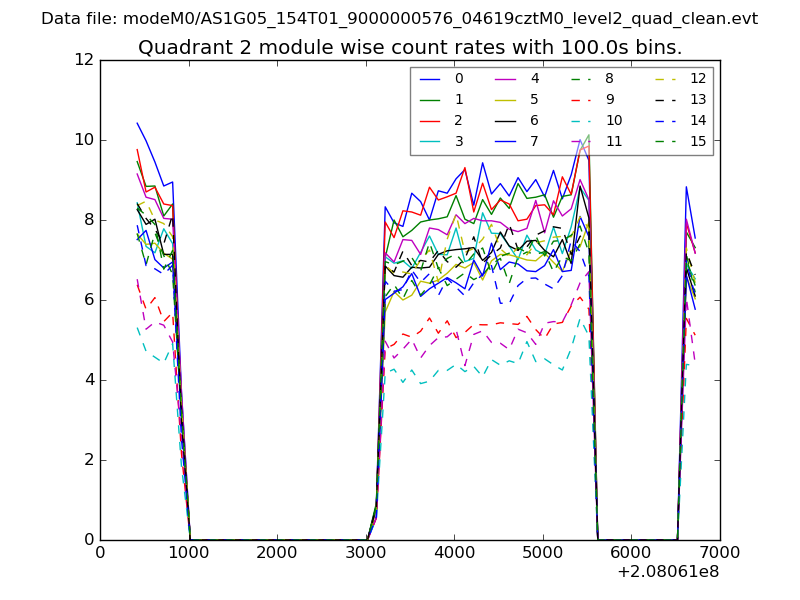
| Module-wise count rates for Quadrant B Data is divided into 100 sec bins |
 |
 |
| Module-wise count rates for Quadrant C Data is divided into 100 sec bins |
 |
 |
| Module-wise count rates for Quadrant D Data is divided into 100 sec bins |
 |
 |
| Parameter | Plot |
|---|---|
| CZT HV Monitor | 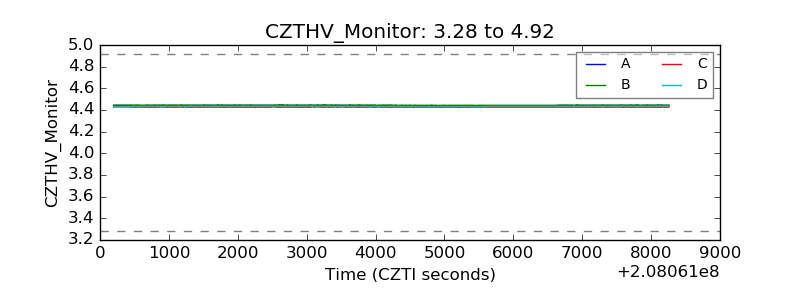 |
| D_VDD | 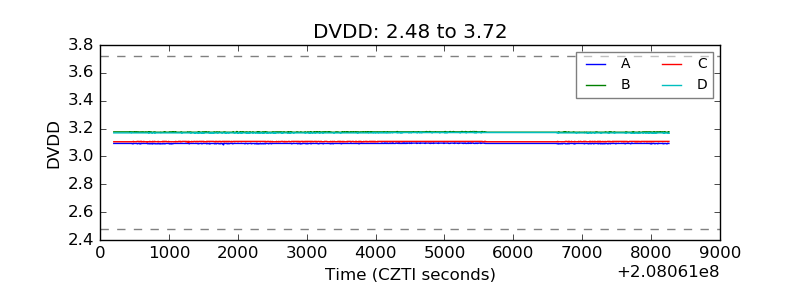 |
| Temperature 1 | 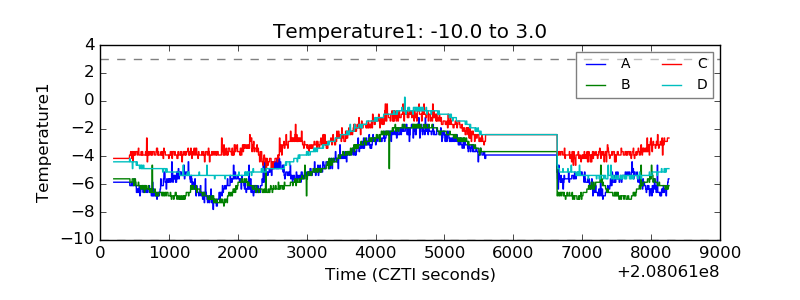 |
| Veto HV Monitor | 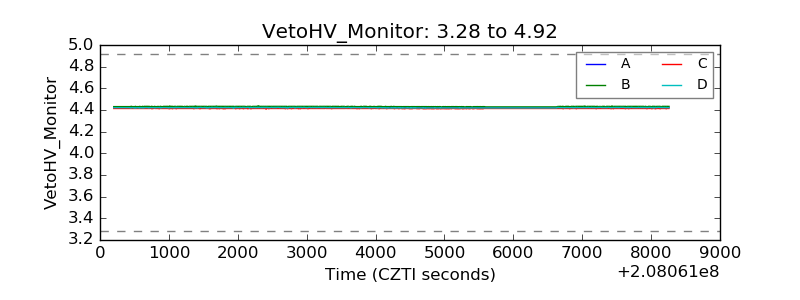 |
| Veto LLD | 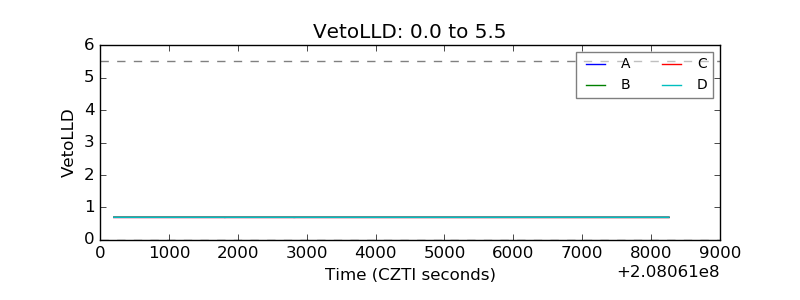 |
| Alpha Counter | 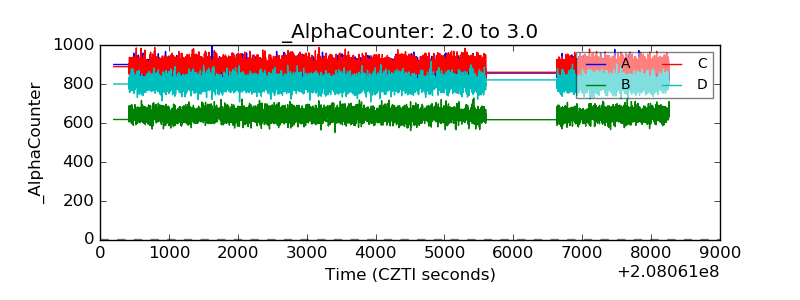 |
| _CPM_Rate | 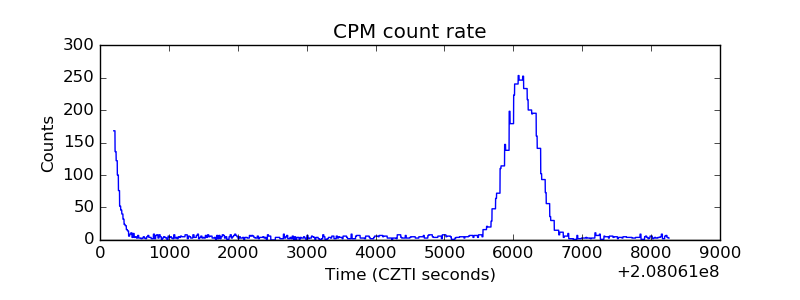 |
| CZT Counter | 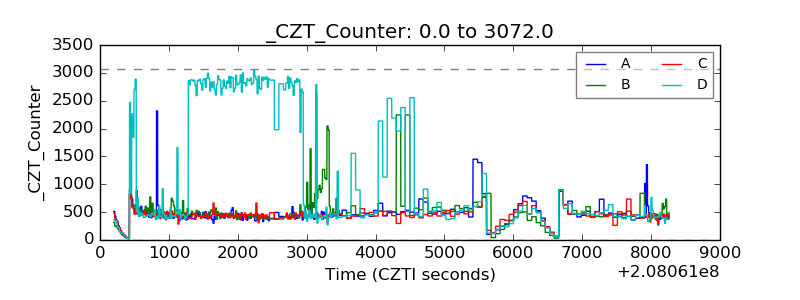 |
| +2.5 Volts monitor | 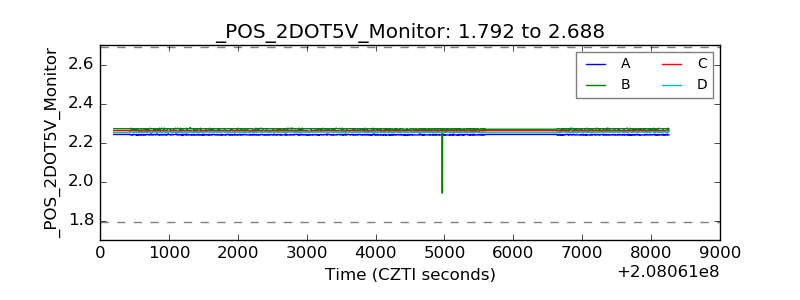 |
| +5 Volts monitor | 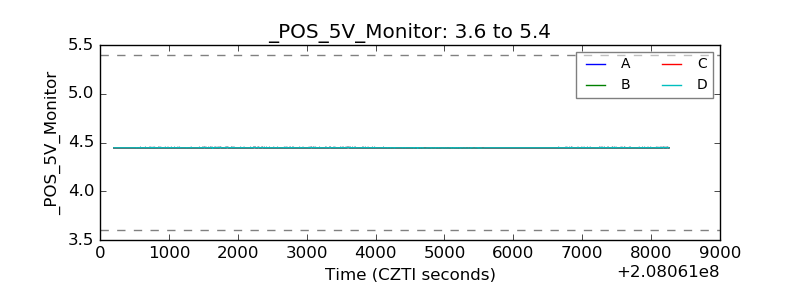 |
| _ROLL_ROT | 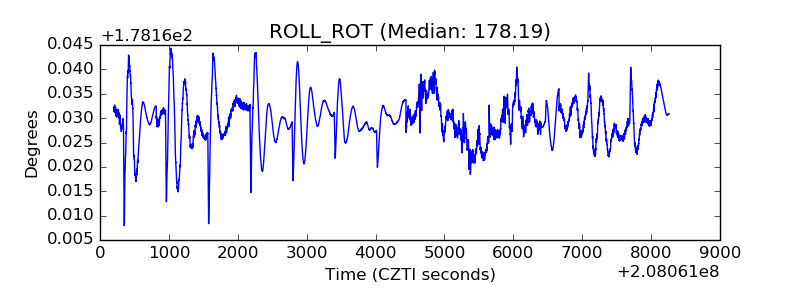 |
| _Roll_DEC | 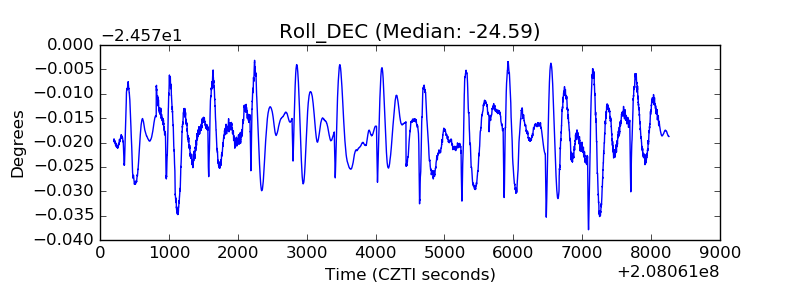 |
| _Roll_RA | 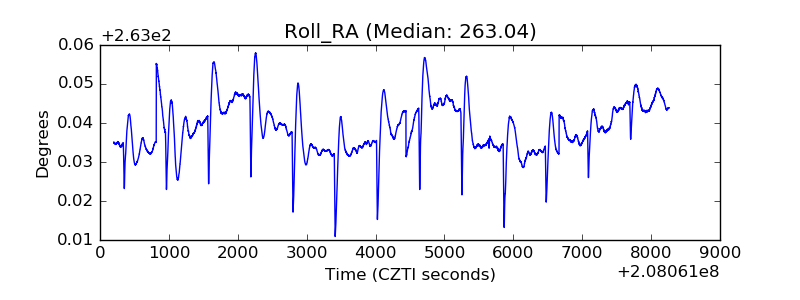 |
| Veto Counter | 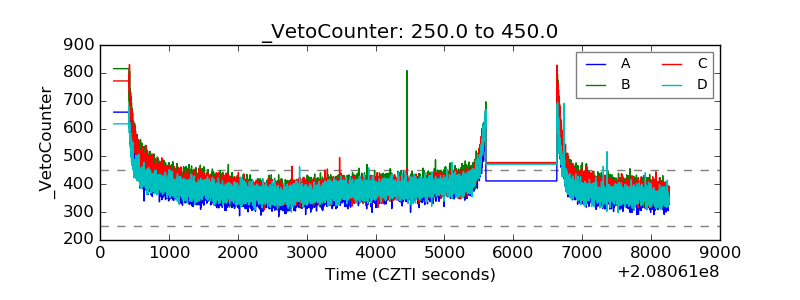 |