| Param | Original file | Final file |
|---|---|---|
| Filename | modeM0/AS1G05_154T01_9000000576_04620cztM0_level2.evt | modeM0/AS1G05_154T01_9000000576_04620cztM0_level2_quad_clean.evt |
| Size (bytes) | 501,376,320 | 64,252,800 |
| Size | 478.1 MB | 61.3 MB |
| Events in quadrant A | 3,545,056 | 361,151 |
| Events in quadrant B | 3,713,448 | 363,481 |
| Events in quadrant C | 3,360,801 | 364,399 |
| Events in quadrant D | 4,065,921 | 345,070 |
| Mode SS | |||
|---|---|---|---|
| Quadrant | BADHDUFLAG | Total packets | Discarded packets |
| A | 0 | 152 | 0 |
| B | 0 | 152 | 0 |
| C | 0 | 152 | 0 |
| D | 0 | 152 | 0 |
| Mode M9 | |||
|---|---|---|---|
| Quadrant | BADHDUFLAG | Total packets | Discarded packets |
| A | 0 | 5 | 0 |
| B | 0 | 5 | 0 |
| C | 0 | 5 | 0 |
| D | 0 | 6 | 0 |
| Mode M0 | |||
|---|---|---|---|
| Quadrant | BADHDUFLAG | Total packets | Discarded packets |
| A | 0 | 15588 | 4 |
| B | 0 | 15879 | 3 |
| C | 0 | 15207 | 3 |
| D | 0 | 17356 | 3 |
| Quadrant | Total seconds | Saturated seconds | Saturation percentage |
|---|---|---|---|
| A | 7333 | 135 | 1.840993% |
| B | 7333 | 178 | 2.427383% |
| C | 7333 | 103 | 1.404609% |
| D | 7333 | 208 | 2.836493% |
Noise dominated data is calculated using 1-second bins in cleaned event files. If a bin has >2000 counts, and if more than 50% of those come from <1% of pixels, then it is considered to be noise-dominated and hence unusable.
| Quadrant | # 1 sec bins | Bins with >0 counts | Bins with >2000 counts | High rate bins dominated by noise | Noise dominated (total time) | Noise dominated (detector-on time) | Marked lightcurve |
|---|---|---|---|---|---|---|---|
| A | 7888 | 7335 | 8 | 8 | 0.10% | 0.11% |  |
| B | 7888 | 7335 | 24 | 24 | 0.30% | 0.33% |  |
| C | 7888 | 7335 | 0 | 0 | 0.00% | 0.00% | 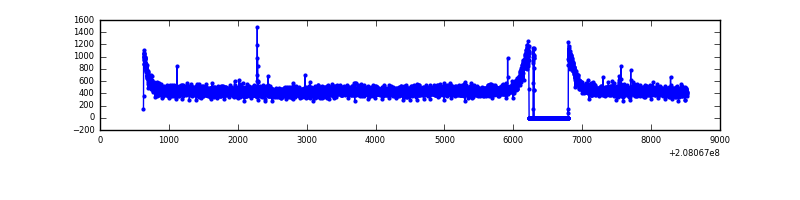 |
| D | 7888 | 7335 | 90 | 90 | 1.14% | 1.23% |  |
Top three noisy pixels from each quadrant. If the there are fewer than three noisy pixels in the level2.evt file, extra rows are filled as -1
| Pixel properties | Quadrant properties | ||||||
|---|---|---|---|---|---|---|---|
| Quadrant | DetID | PixID | Counts | Sigma | Mean | Median | Sigma |
| A | 8 | 15 | 88786 | 493.32 | 869 | 850 | 178.3 |
| A | 13 | 251 | 56850 | 314.16 | 869 | 850 | 178.3 |
| A | 12 | 133 | 32403 | 177.01 | 869 | 850 | 178.3 |
| B | 10 | 16 | 137629 | 791.22 | 883 | 861 | 172.9 |
| B | 4 | 48 | 44726 | 253.76 | 883 | 861 | 172.9 |
| B | 15 | 204 | 28285 | 158.65 | 883 | 861 | 172.9 |
| C | 14 | 48 | 26746 | 129.33 | 850 | 855 | 200.2 |
| C | 13 | 61 | 7152 | 31.45 | 850 | 855 | 200.2 |
| C | 5 | 250 | 5566 | 23.53 | 850 | 855 | 200.2 |
| D | 2 | 234 | 399038 | 1941.13 | 835 | 810 | 205.2 |
| D | 2 | 136 | 164768 | 799.2 | 835 | 810 | 205.2 |
| D | 13 | 235 | 126206 | 611.23 | 835 | 810 | 205.2 |
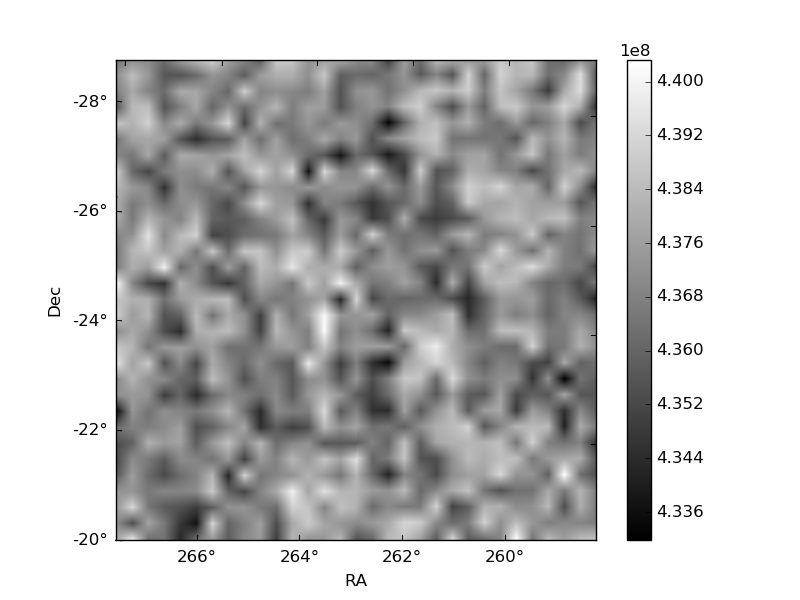
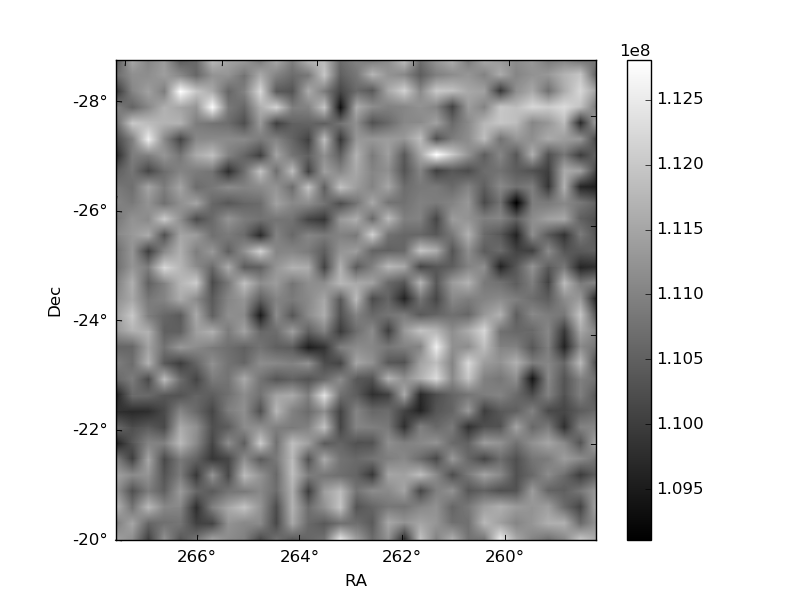
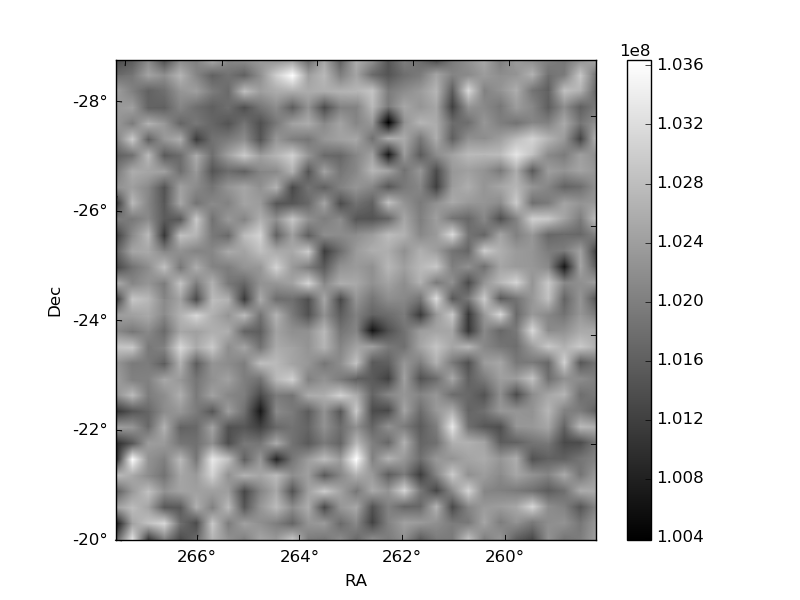
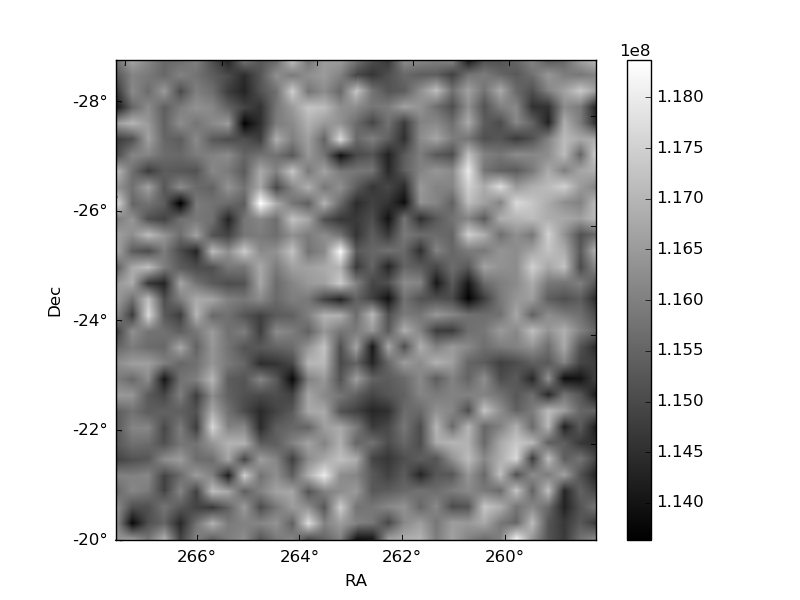
Histogram calculated using DETX and DETY for each event in the final _common_clean file
| Quadrant A | 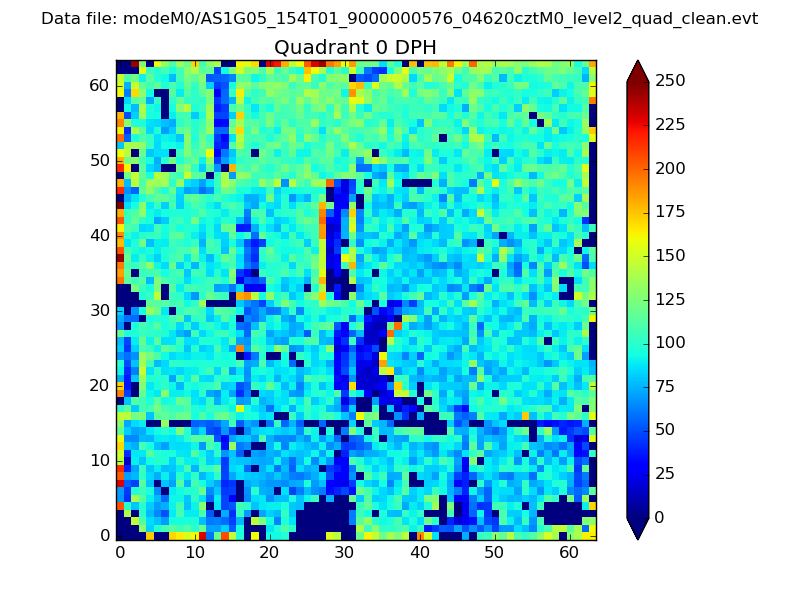 |
 |
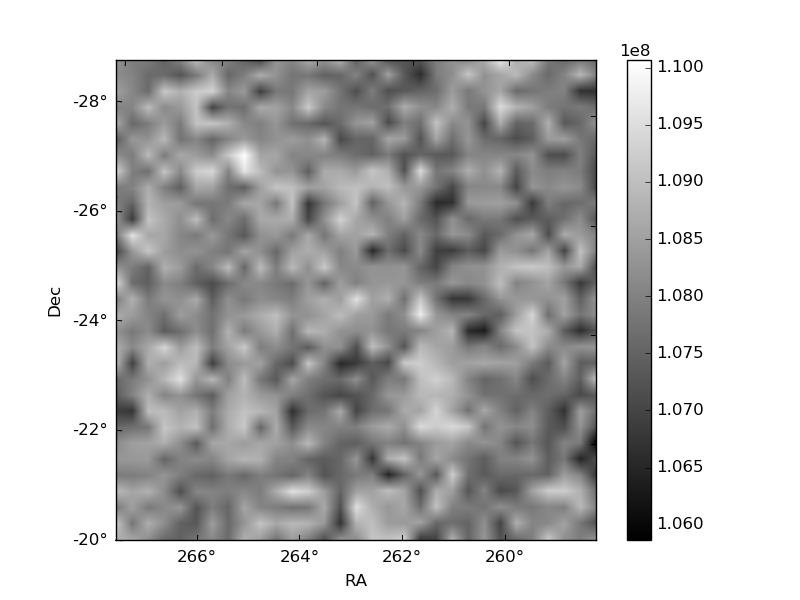
Quadrant B |
|---|---|---|---|
| Quadrant D | 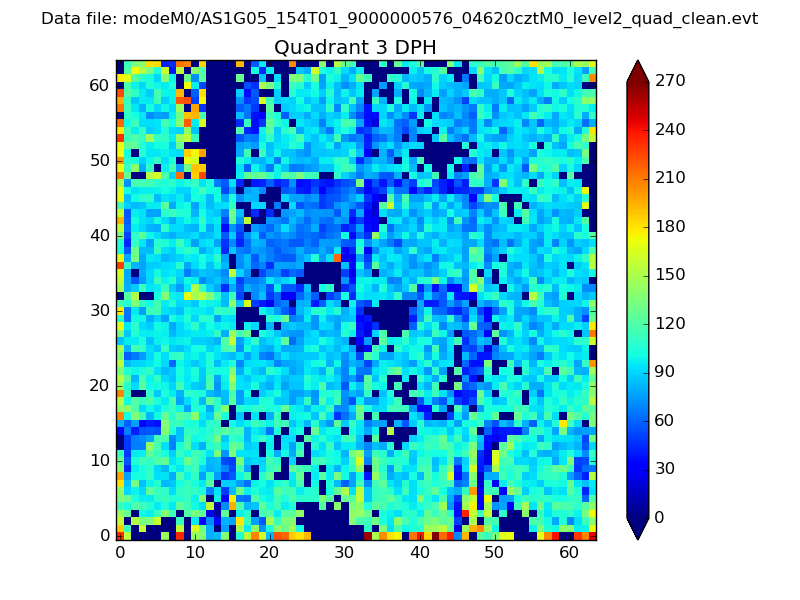 |
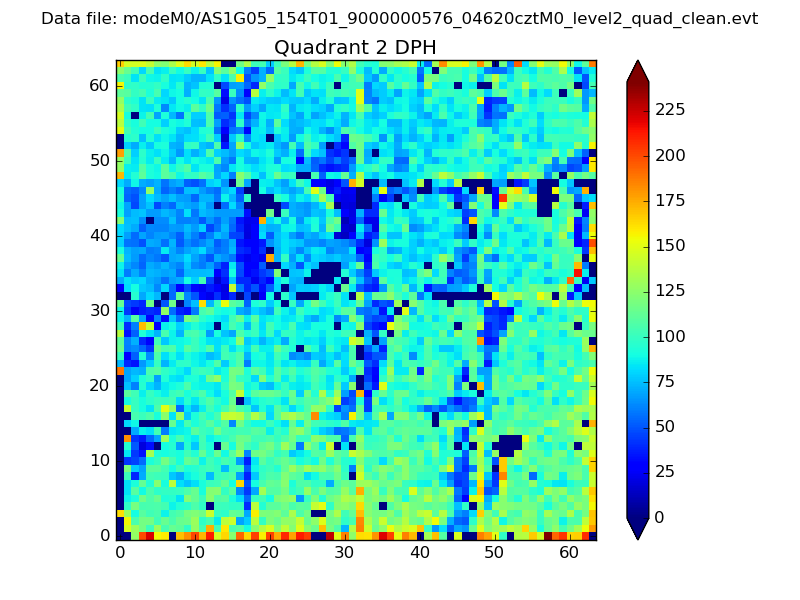 |
Quadrant C |
| Plot type | Count rate plots | Images |
|---|---|---|
| Comparison with Poisson distribution Blue bars denote a histogram of data divided into 1 sec bins. Red curve is a Poisson curve with rate = median count rate of data. |
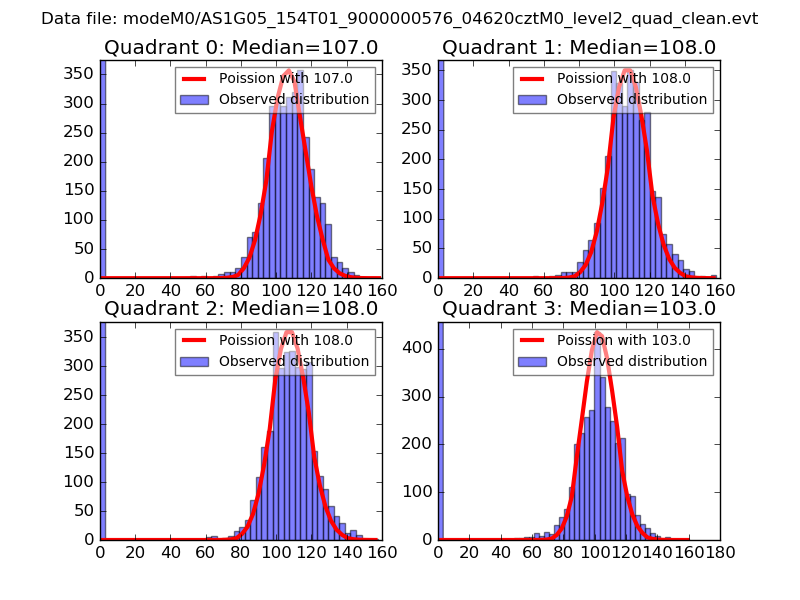 |
 |
| Quadrant-wise count rates Data is divided into 100 sec bins |
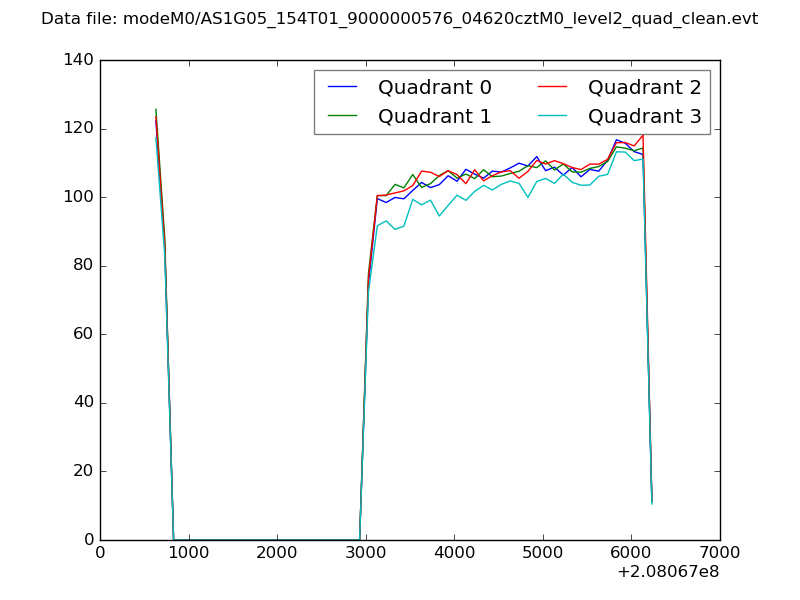 |
|
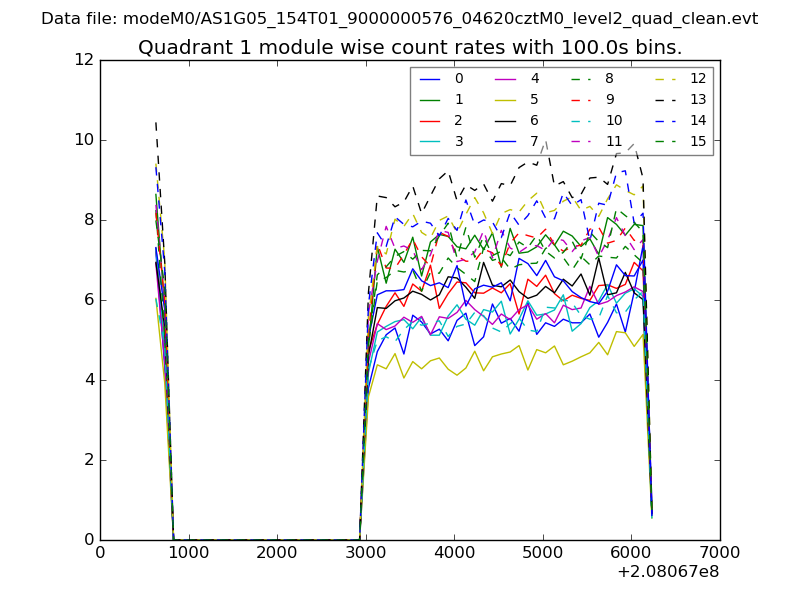
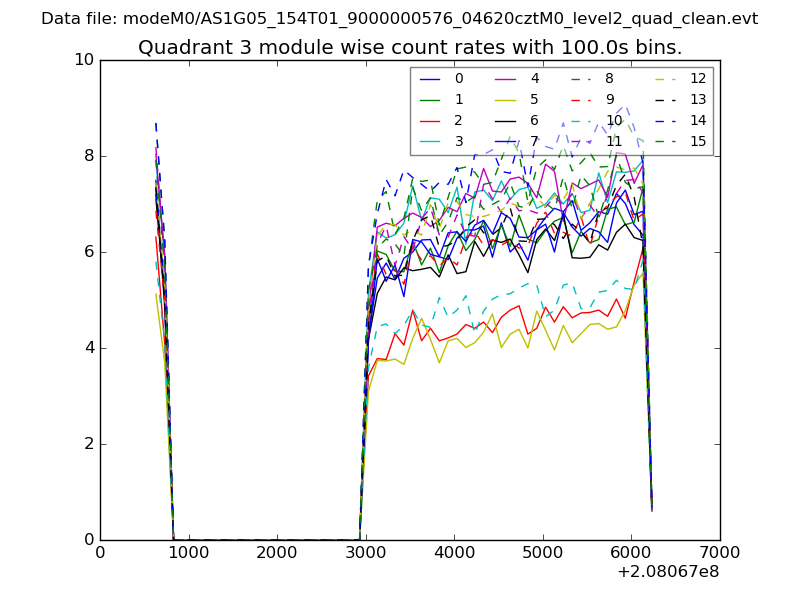
| Module-wise count rates for Quadrant A Data is divided into 100 sec bins |
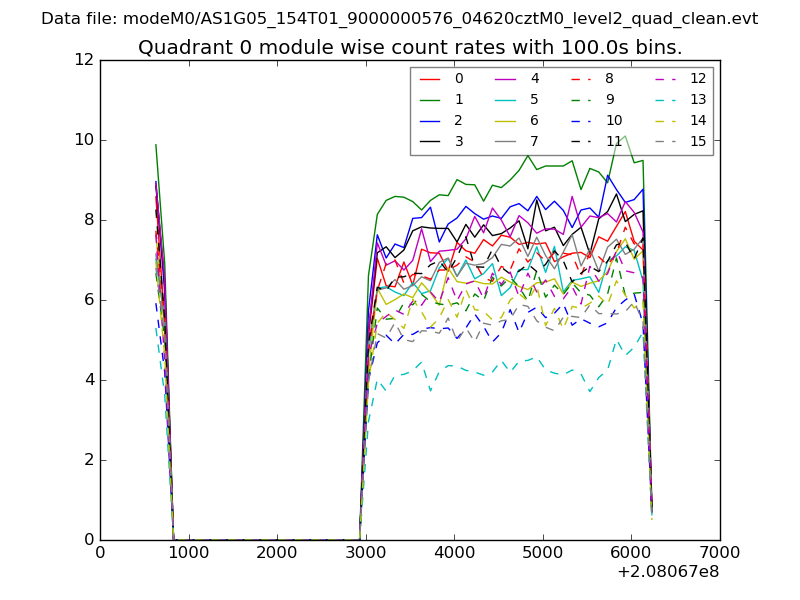 |
 |
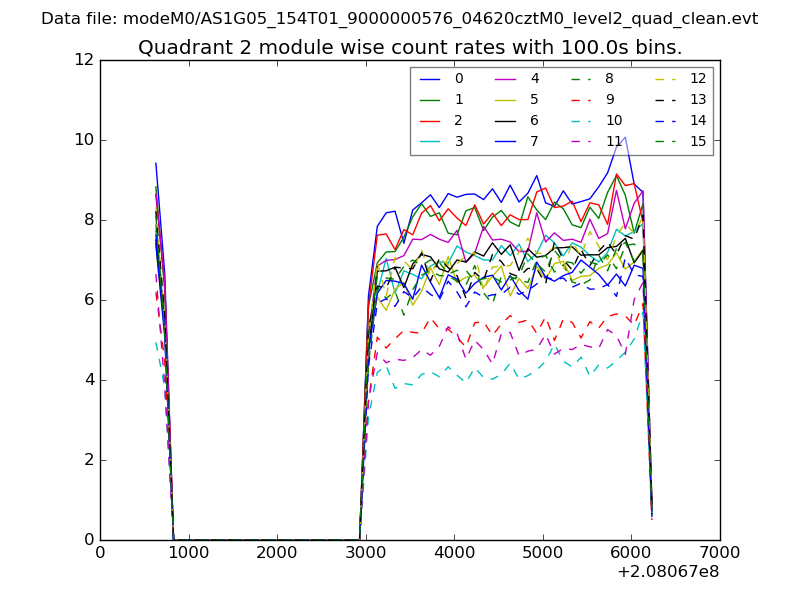
| Module-wise count rates for Quadrant B Data is divided into 100 sec bins |
 |
 |
| Module-wise count rates for Quadrant C Data is divided into 100 sec bins |
 |
 |
| Module-wise count rates for Quadrant D Data is divided into 100 sec bins |
 |
 |
| Parameter | Plot |
|---|---|
| CZT HV Monitor | 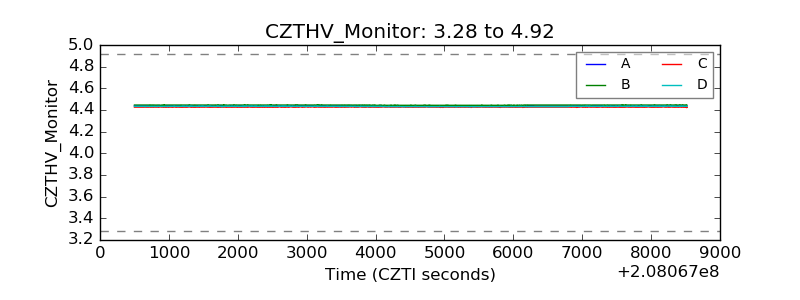 |
| D_VDD | 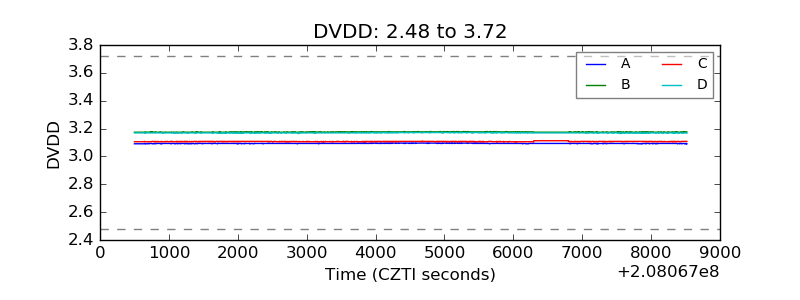 |
| Temperature 1 | 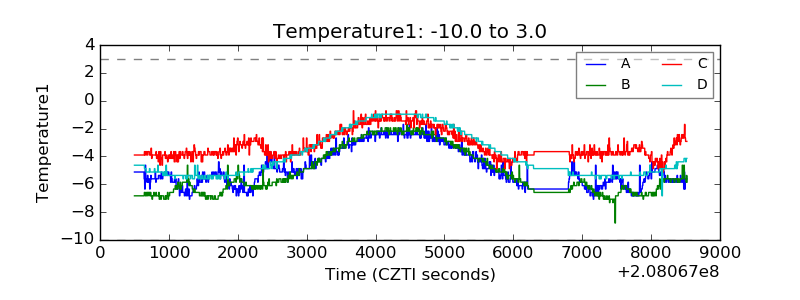 |
| Veto HV Monitor | 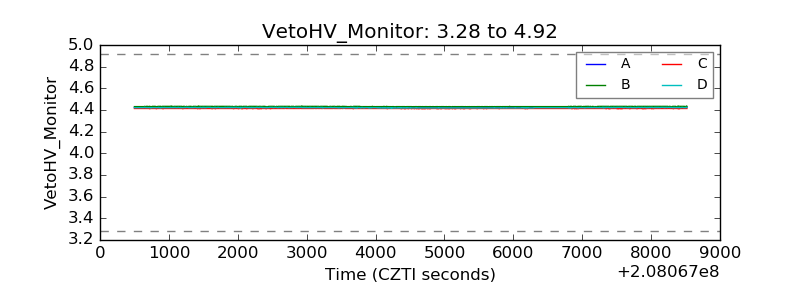 |
| Veto LLD | 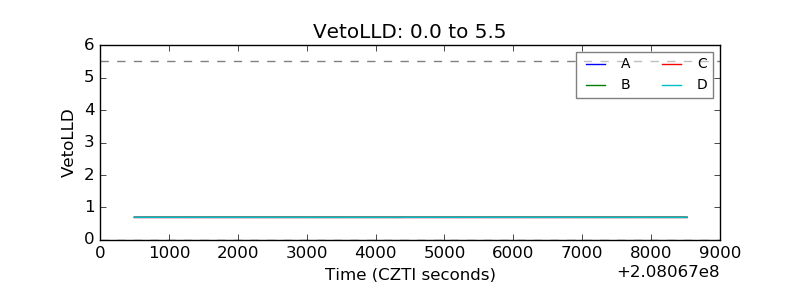 |
| Alpha Counter | 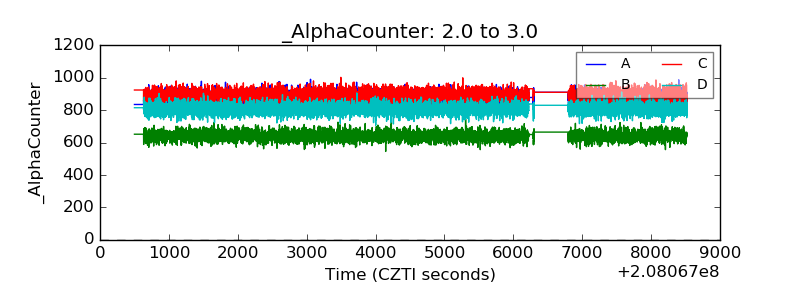 |
| _CPM_Rate | 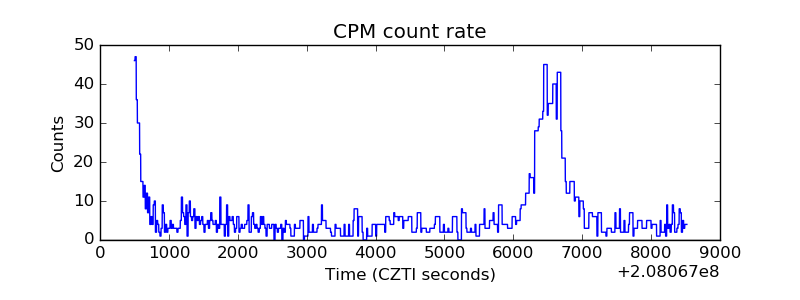 |
| CZT Counter | 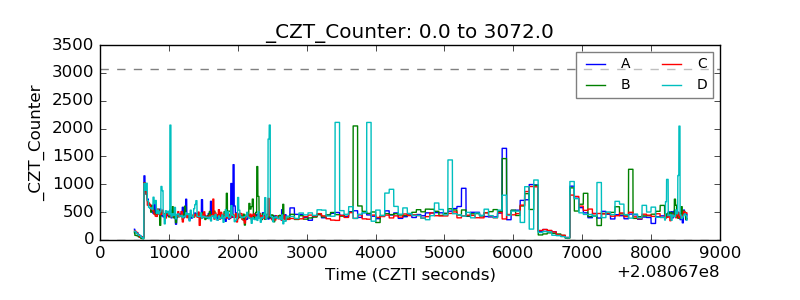 |
| +2.5 Volts monitor | 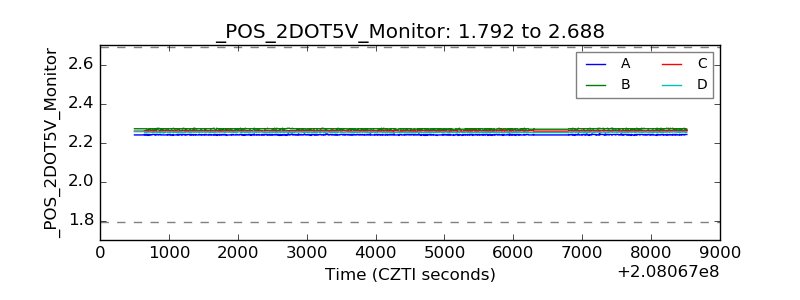 |
| +5 Volts monitor |  |
| _ROLL_ROT | 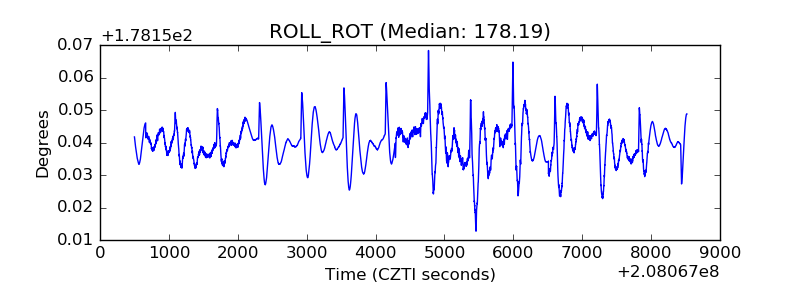 |
| _Roll_DEC | 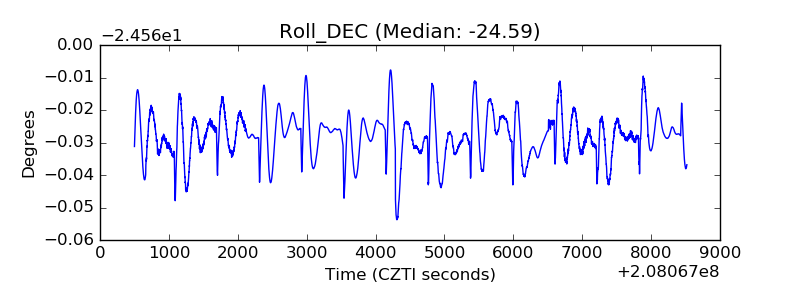 |
| _Roll_RA | 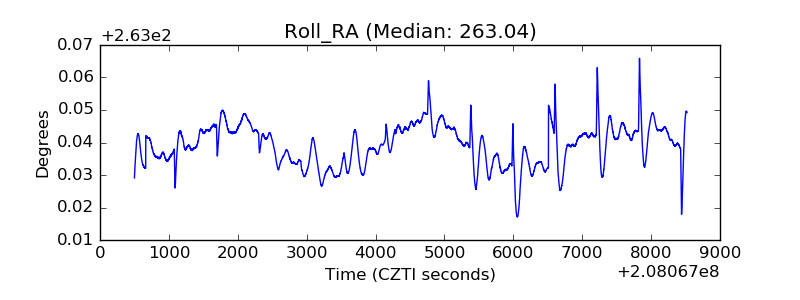 |
| Veto Counter | 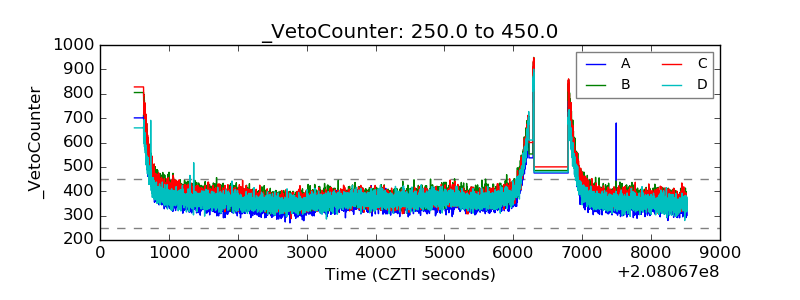 |