| Param | Original file | Final file |
|---|---|---|
| Filename | modeM0/AS1G05_154T01_9000000576_04622cztM0_level2.evt | modeM0/AS1G05_154T01_9000000576_04622cztM0_level2_quad_clean.evt |
| Size (bytes) | 552,830,400 | 70,727,040 |
| Size | 527.2 MB | 67.5 MB |
| Events in quadrant A | 3,540,754 | 410,723 |
| Events in quadrant B | 3,745,998 | 411,090 |
| Events in quadrant C | 3,460,882 | 413,041 |
| Events in quadrant D | 5,483,397 | 382,303 |
| Mode SS | |||
|---|---|---|---|
| Quadrant | BADHDUFLAG | Total packets | Discarded packets |
| A | 0 | 150 | 0 |
| B | 0 | 150 | 0 |
| C | 0 | 150 | 0 |
| D | 0 | 150 | 0 |
| Mode M0 | |||
|---|---|---|---|
| Quadrant | BADHDUFLAG | Total packets | Discarded packets |
| A | 0 | 15649 | 1 |
| B | 0 | 16124 | 0 |
| C | 0 | 15567 | 0 |
| D | 0 | 21640 | 0 |
| Quadrant | Total seconds | Saturated seconds | Saturation percentage |
|---|---|---|---|
| A | 7535 | 235 | 3.118779% |
| B | 7535 | 254 | 3.370936% |
| C | 7535 | 157 | 2.083610% |
| D | 7535 | 600 | 7.962840% |
Noise dominated data is calculated using 1-second bins in cleaned event files. If a bin has >2000 counts, and if more than 50% of those come from <1% of pixels, then it is considered to be noise-dominated and hence unusable.
| Quadrant | # 1 sec bins | Bins with >0 counts | Bins with >2000 counts | High rate bins dominated by noise | Noise dominated (total time) | Noise dominated (detector-on time) | Marked lightcurve |
|---|---|---|---|---|---|---|---|
| A | 7535 | 7535 | 6 | 6 | 0.08% | 0.08% | 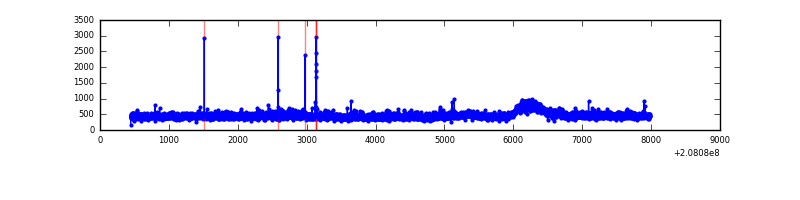 |
| B | 7535 | 7535 | 16 | 16 | 0.21% | 0.21% | 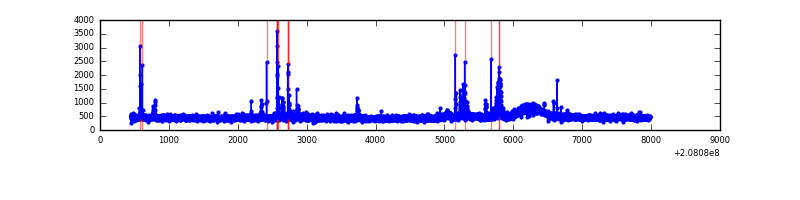 |
| C | 7535 | 7535 | 1 | 1 | 0.01% | 0.01% | 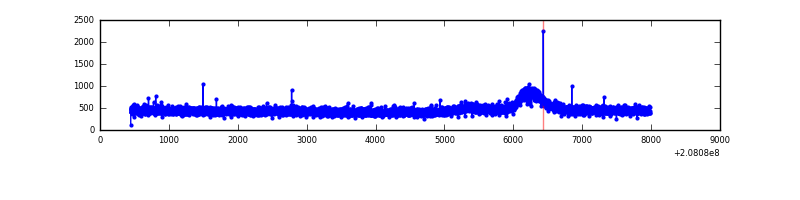 |
| D | 7535 | 7535 | 300 | 300 | 3.98% | 3.98% | 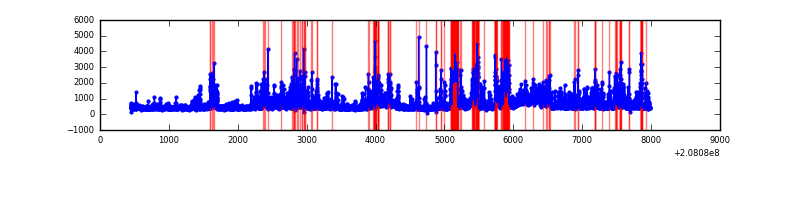 |
Top three noisy pixels from each quadrant. If the there are fewer than three noisy pixels in the level2.evt file, extra rows are filled as -1
| Pixel properties | Quadrant properties | ||||||
|---|---|---|---|---|---|---|---|
| Quadrant | DetID | PixID | Counts | Sigma | Mean | Median | Sigma |
| A | 8 | 15 | 59043 | 314.07 | 891 | 869 | 185.2 |
| A | 15 | 174 | 30463 | 159.77 | 891 | 869 | 185.2 |
| A | 12 | 133 | 10170 | 50.21 | 891 | 869 | 185.2 |
| B | 10 | 16 | 157603 | 902.39 | 899 | 876 | 173.7 |
| B | 4 | 48 | 29953 | 167.42 | 899 | 876 | 173.7 |
| B | 14 | 167 | 22368 | 123.74 | 899 | 876 | 173.7 |
| C | 14 | 48 | 52614 | 252.9 | 871 | 871 | 204.6 |
| C | 13 | 61 | 7330 | 31.57 | 871 | 871 | 204.6 |
| C | 12 | 4 | 4358 | 17.04 | 871 | 871 | 204.6 |
| D | 8 | 112 | 824922 | 3993.94 | 841 | 814 | 206.3 |
| D | 13 | 235 | 790873 | 3828.93 | 841 | 814 | 206.3 |
| D | 2 | 234 | 225547 | 1089.14 | 841 | 814 | 206.3 |
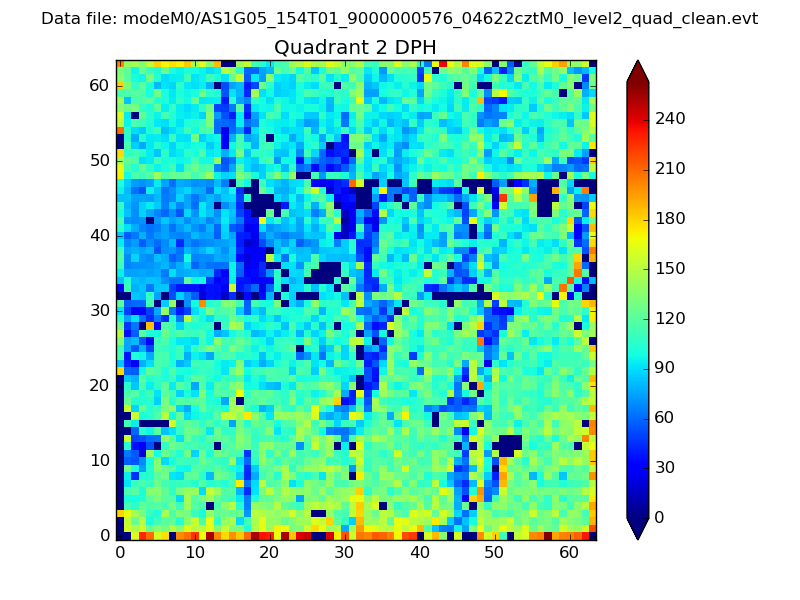
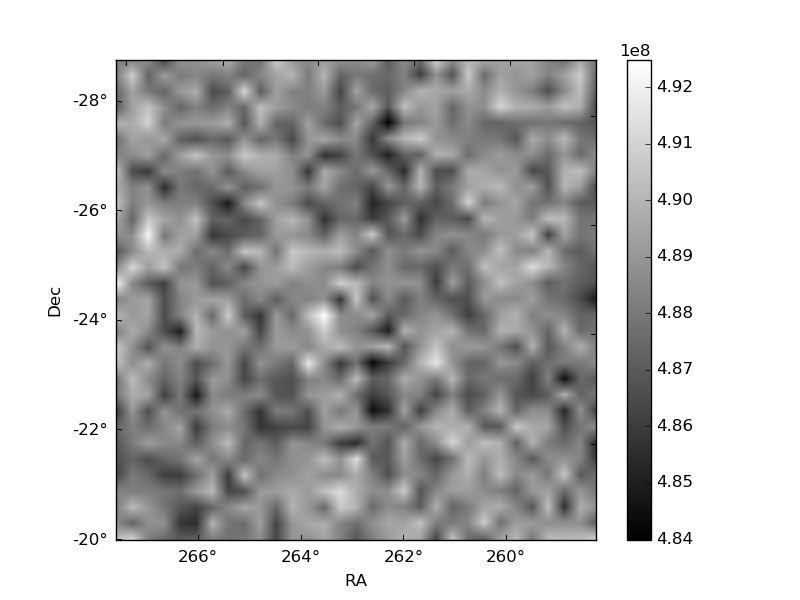
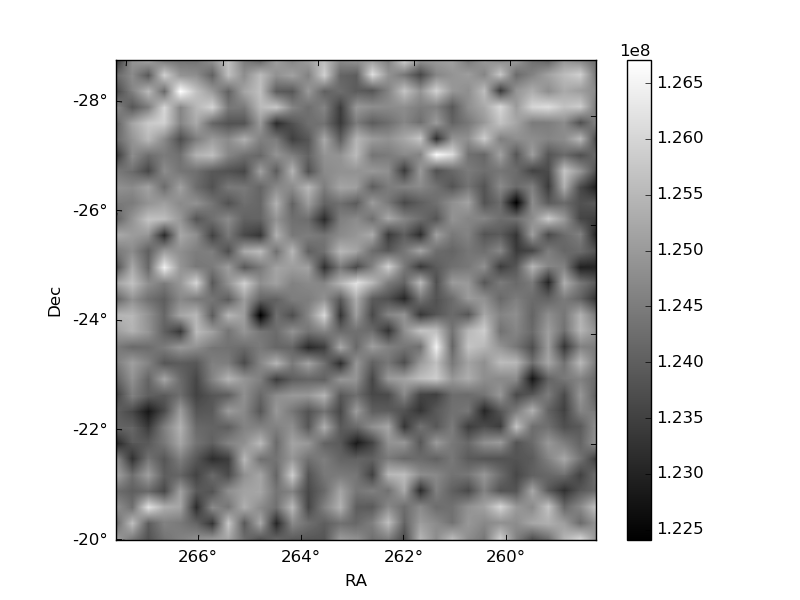
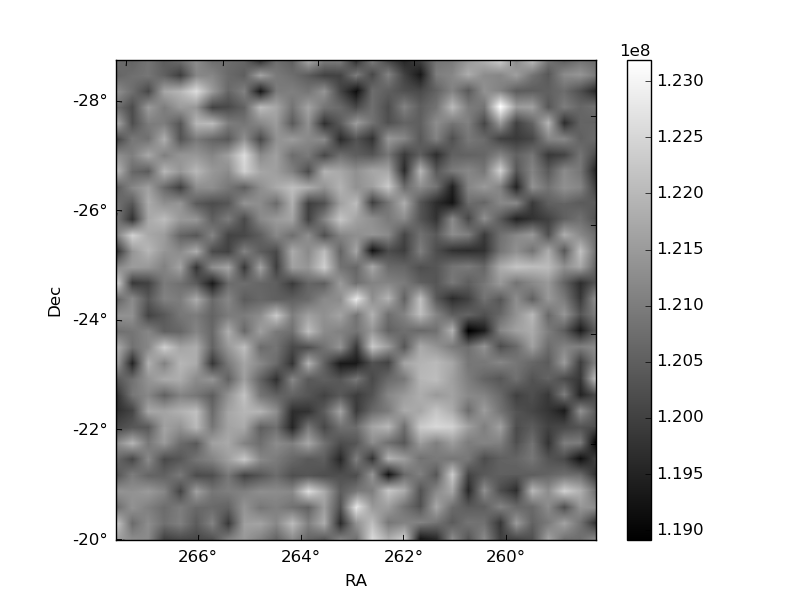
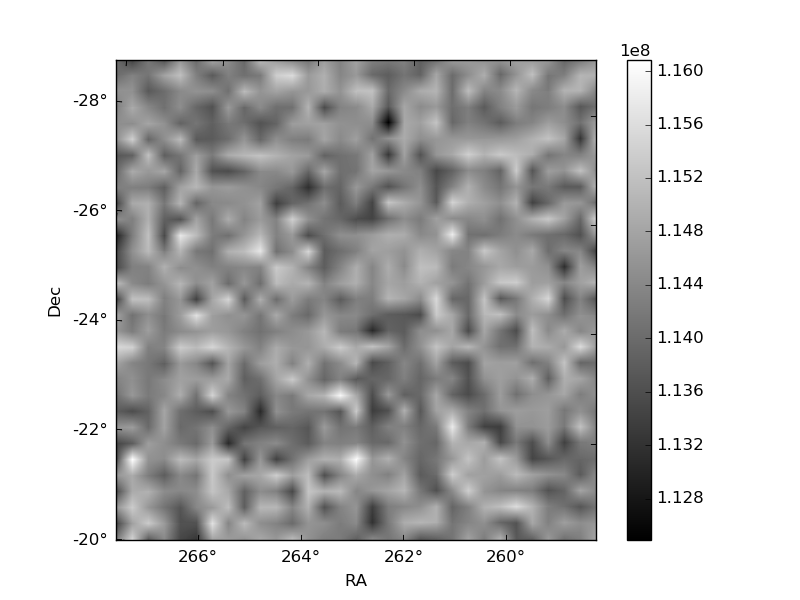
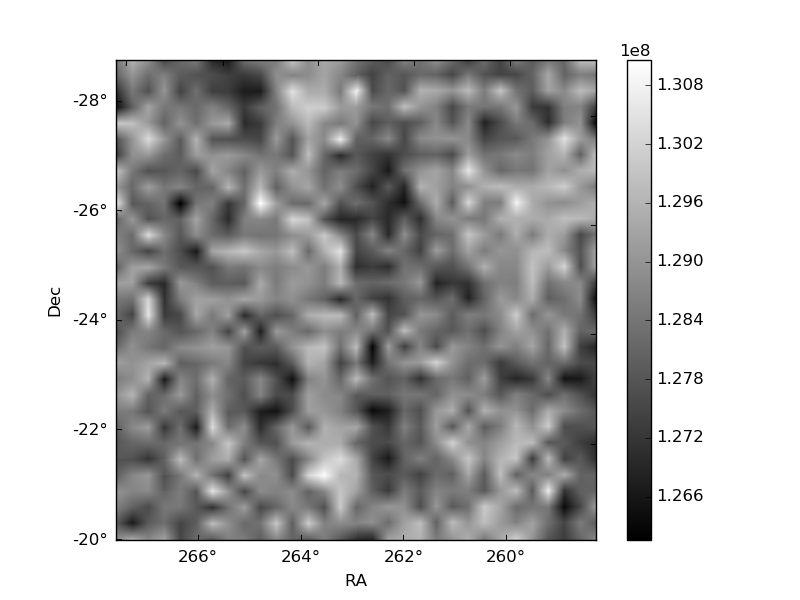
Histogram calculated using DETX and DETY for each event in the final _common_clean file
| Quadrant A | 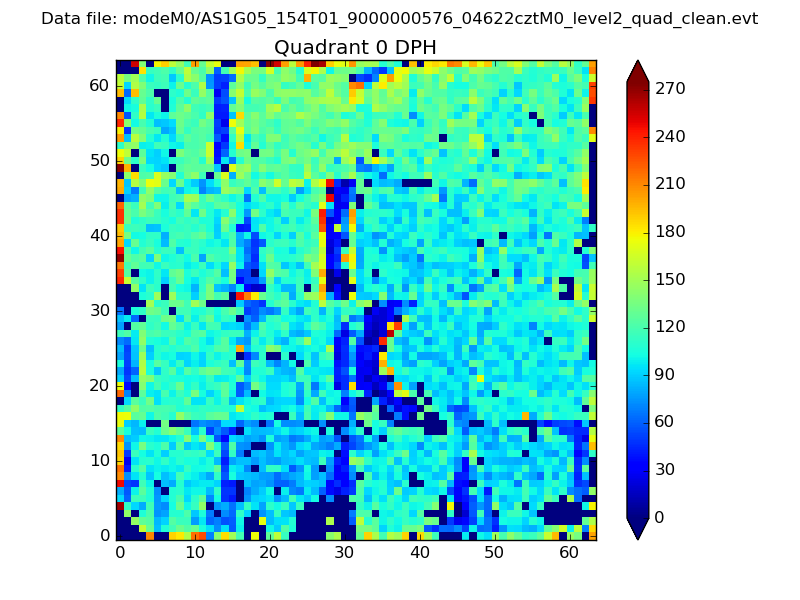 |
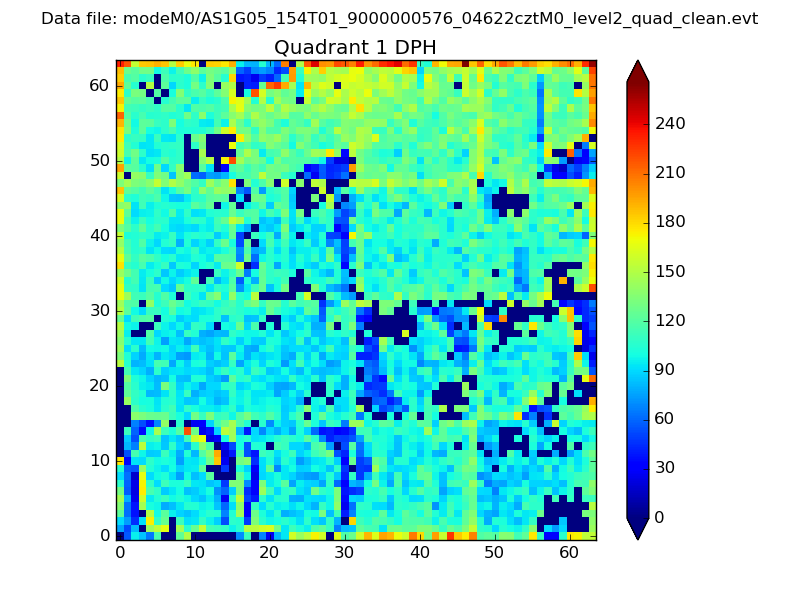 |
Quadrant B |
|---|---|---|---|
| Quadrant D | 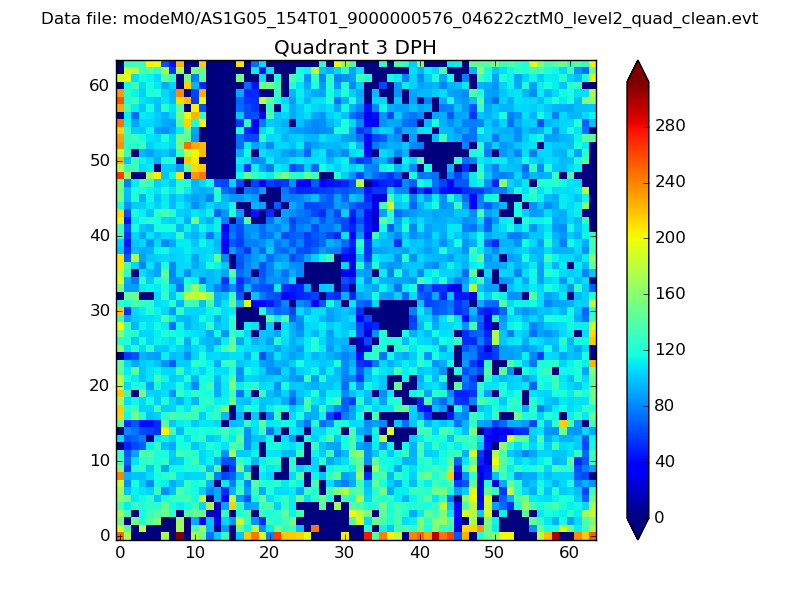 |
 |
Quadrant C |
| Plot type | Count rate plots | Images |
|---|---|---|
| Comparison with Poisson distribution Blue bars denote a histogram of data divided into 1 sec bins. Red curve is a Poisson curve with rate = median count rate of data. |
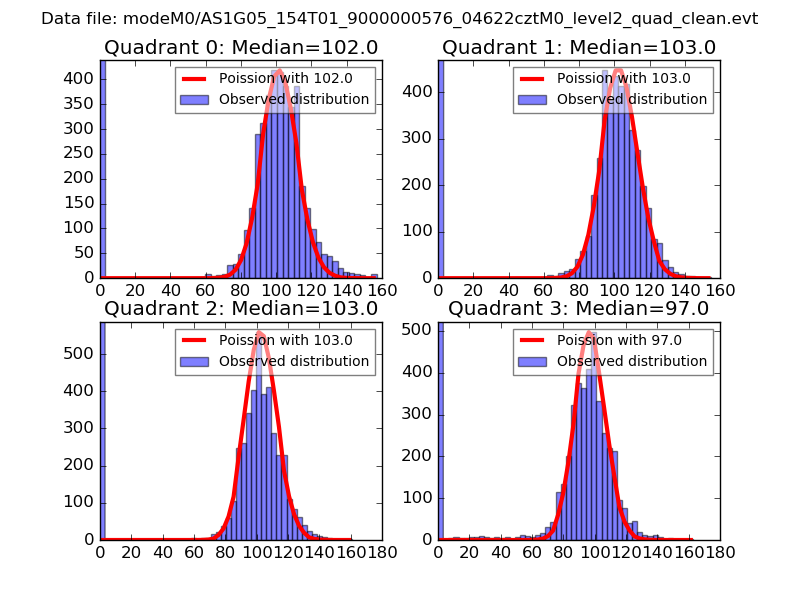 |
 |
| Quadrant-wise count rates Data is divided into 100 sec bins |
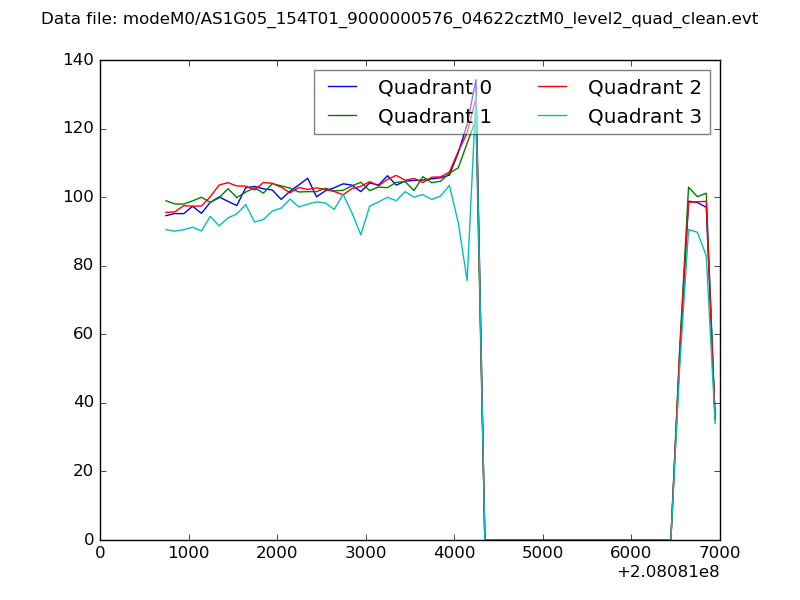 |
|
| Module-wise count rates for Quadrant A Data is divided into 100 sec bins |
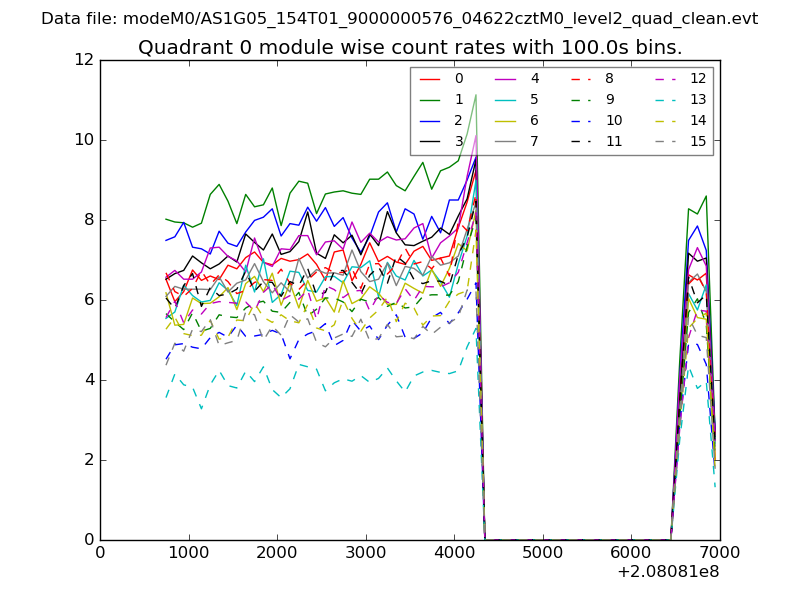 |
 |
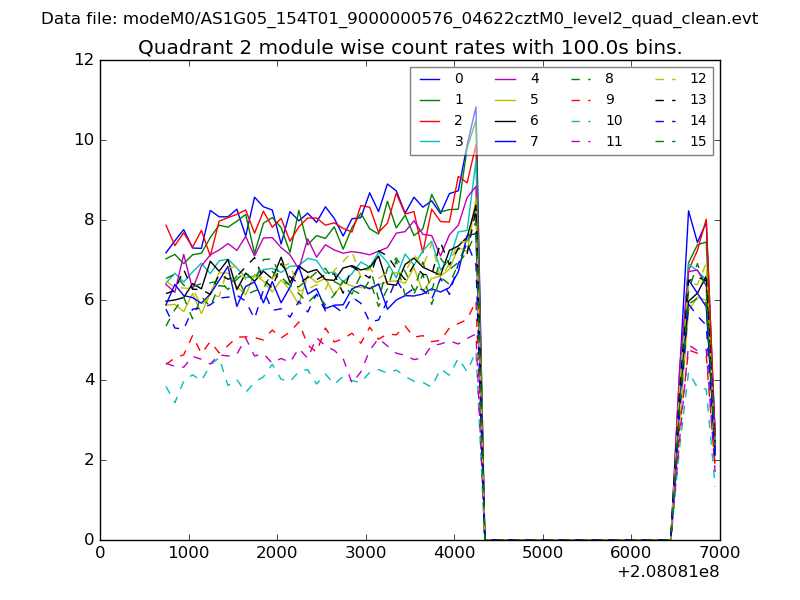
| Module-wise count rates for Quadrant B Data is divided into 100 sec bins |
 |
 |
| Module-wise count rates for Quadrant C Data is divided into 100 sec bins |
 |
 |
| Module-wise count rates for Quadrant D Data is divided into 100 sec bins |
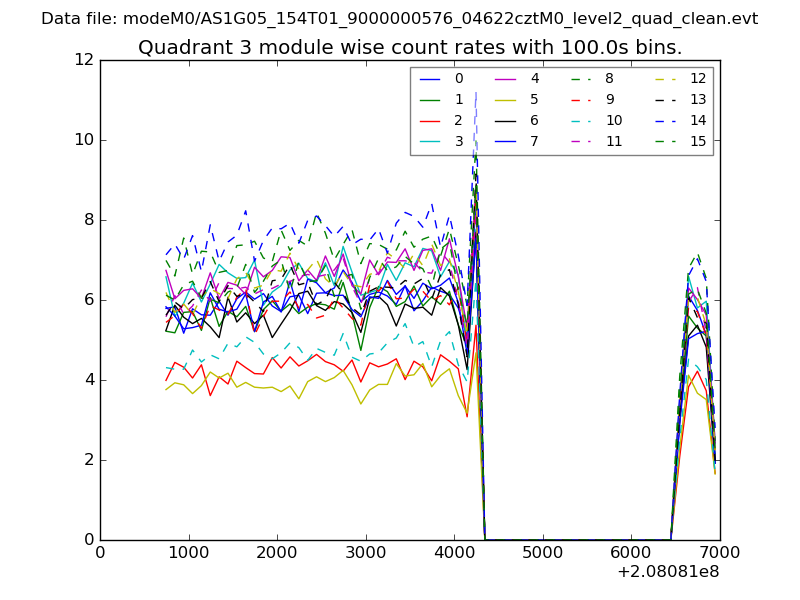 |
 |
| Parameter | Plot |
|---|---|
| CZT HV Monitor | 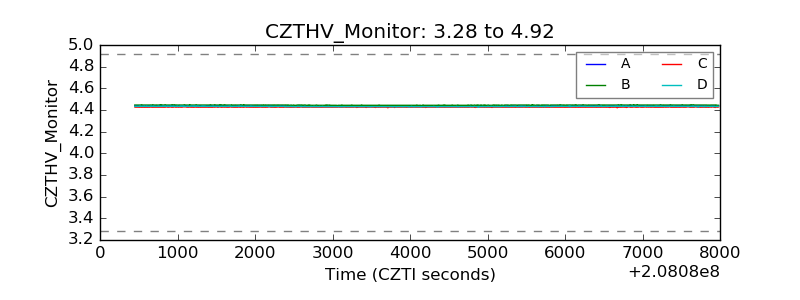 |
| D_VDD | 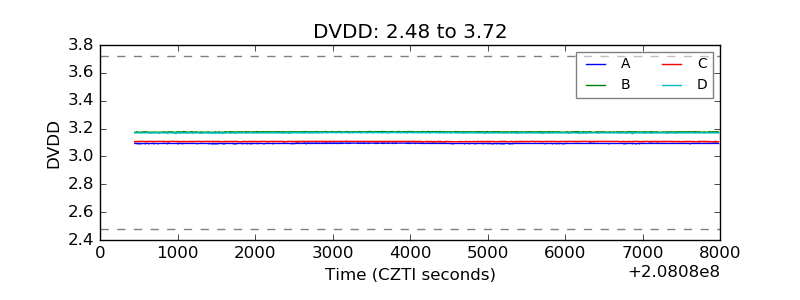 |
| Temperature 1 | 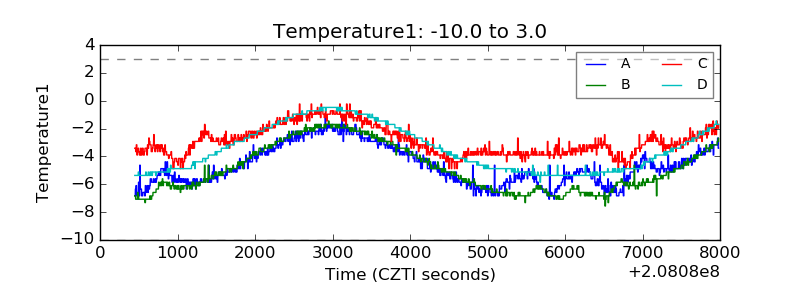 |
| Veto HV Monitor | 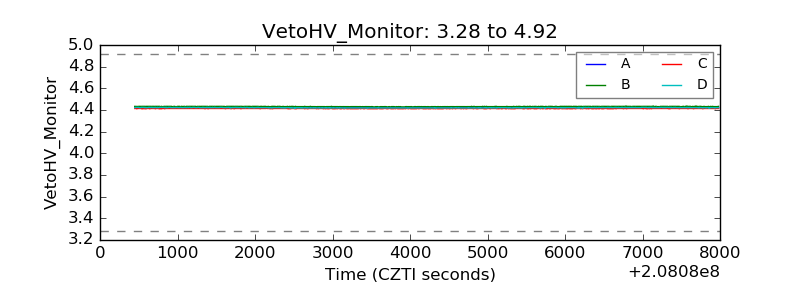 |
| Veto LLD | 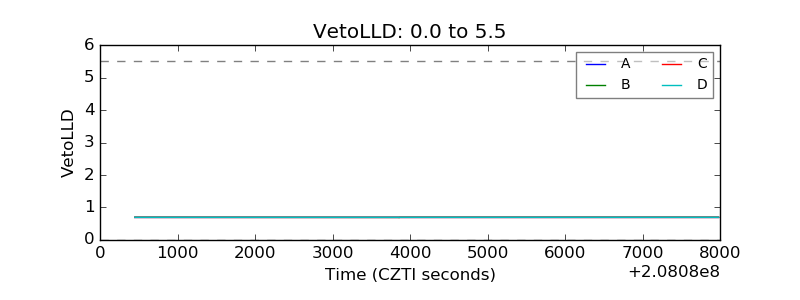 |
| Alpha Counter | 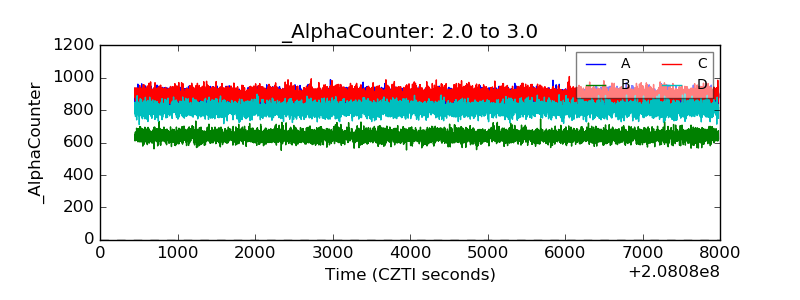 |
| _CPM_Rate | 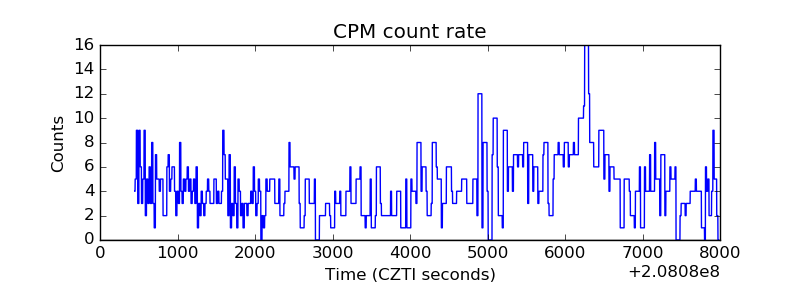 |
| CZT Counter | 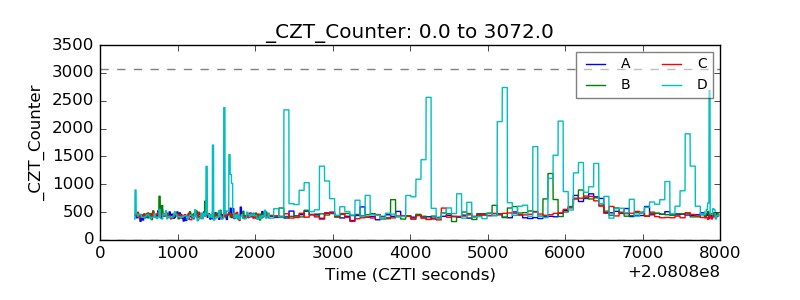 |
| +2.5 Volts monitor |  |
| +5 Volts monitor |  |
| _ROLL_ROT | 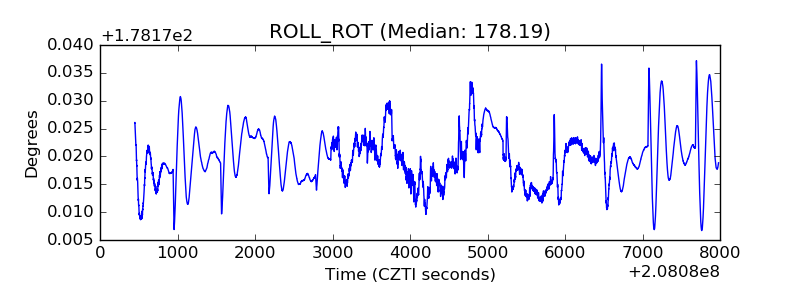 |
| _Roll_DEC | 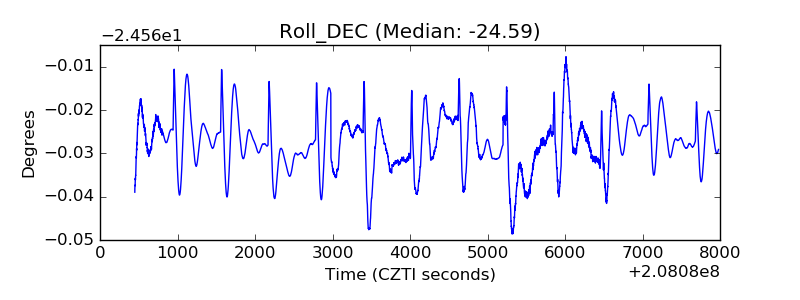 |
| _Roll_RA | 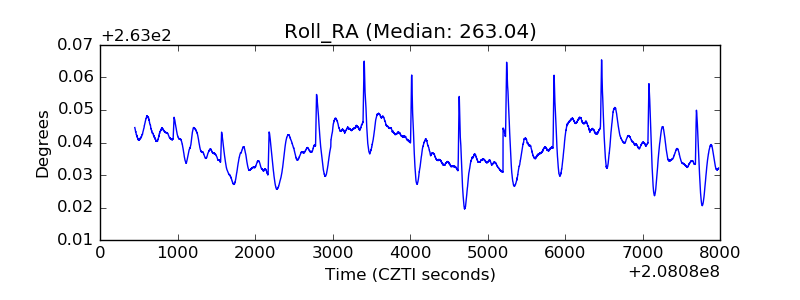 |
| Veto Counter | 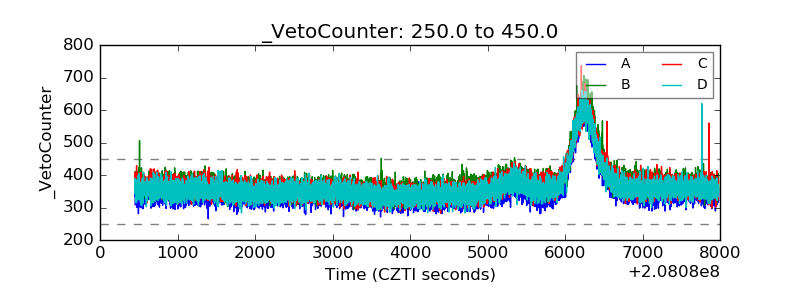 |