| Param | Original file | Final file |
|---|---|---|
| Filename | modeM0/AS1G05_154T01_9000000576_04623cztM0_level2.evt | modeM0/AS1G05_154T01_9000000576_04623cztM0_level2_quad_clean.evt |
| Size (bytes) | 423,915,840 | 59,546,880 |
| Size | 404.3 MB | 56.8 MB |
| Events in quadrant A | 2,438,549 | 363,412 |
| Events in quadrant B | 2,491,586 | 365,845 |
| Events in quadrant C | 2,376,820 | 364,552 |
| Events in quadrant D | 5,158,296 | 325,065 |
| Mode SS | |||
|---|---|---|---|
| Quadrant | BADHDUFLAG | Total packets | Discarded packets |
| A | 0 | 110 | 0 |
| B | 0 | 110 | 0 |
| C | 0 | 110 | 0 |
| D | 0 | 110 | 0 |
| Mode M0 | |||
|---|---|---|---|
| Quadrant | BADHDUFLAG | Total packets | Discarded packets |
| A | 0 | 11078 | 15 |
| B | 0 | 11077 | 12 |
| C | 0 | 11049 | 12 |
| D | 0 | 19190 | 56 |
| Quadrant | Total seconds | Saturated seconds | Saturation percentage |
|---|---|---|---|
| A | 5480 | 2 | 0.036496% |
| B | 5482 | 6 | 0.109449% |
| C | 5482 | 6 | 0.109449% |
| D | 5480 | 679 | 12.390511% |
Noise dominated data is calculated using 1-second bins in cleaned event files. If a bin has >2000 counts, and if more than 50% of those come from <1% of pixels, then it is considered to be noise-dominated and hence unusable.
| Quadrant | # 1 sec bins | Bins with >0 counts | Bins with >2000 counts | High rate bins dominated by noise | Noise dominated (total time) | Noise dominated (detector-on time) | Marked lightcurve |
|---|---|---|---|---|---|---|---|
| A | 5481 | 5481 | 0 | 0 | 0.00% | 0.00% | 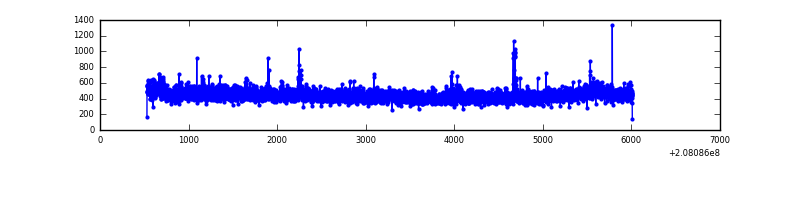 |
| B | 5482 | 5482 | 1 | 1 | 0.02% | 0.02% | 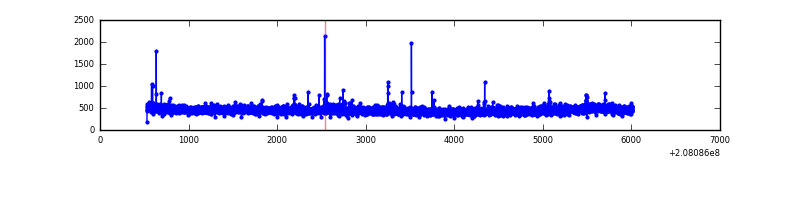 |
| C | 5482 | 5482 | 1 | 1 | 0.02% | 0.02% | 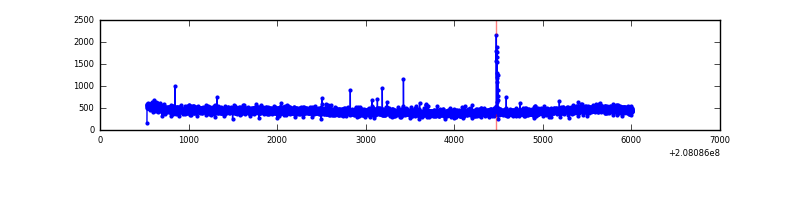 |
| D | 5480 | 5479 | 626 | 626 | 11.42% | 11.43% | 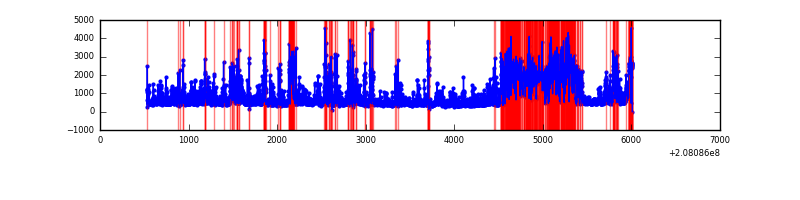 |
Top three noisy pixels from each quadrant. If the there are fewer than three noisy pixels in the level2.evt file, extra rows are filled as -1
| Pixel properties | Quadrant properties | ||||||
|---|---|---|---|---|---|---|---|
| Quadrant | DetID | PixID | Counts | Sigma | Mean | Median | Sigma |
| A | 8 | 15 | 41054 | 316.91 | 615 | 602 | 127.6 |
| A | 15 | 174 | 8322 | 60.48 | 615 | 602 | 127.6 |
| A | 13 | 251 | 7840 | 56.7 | 615 | 602 | 127.6 |
| B | 15 | 54 | 22585 | 181.48 | 624 | 609 | 121.1 |
| B | 10 | 16 | 14813 | 117.3 | 624 | 609 | 121.1 |
| B | 15 | 204 | 12736 | 100.14 | 624 | 609 | 121.1 |
| C | 0 | 239 | 21196 | 146.91 | 599 | 603 | 140.2 |
| C | 14 | 48 | 12972 | 88.24 | 599 | 603 | 140.2 |
| C | 13 | 61 | 5028 | 31.57 | 599 | 603 | 140.2 |
| D | 8 | 112 | 1685509 | 12237.9 | 561 | 543 | 137.7 |
| D | 13 | 235 | 851573 | 6181.03 | 561 | 543 | 137.7 |
| D | 2 | 234 | 287782 | 2086.22 | 561 | 543 | 137.7 |
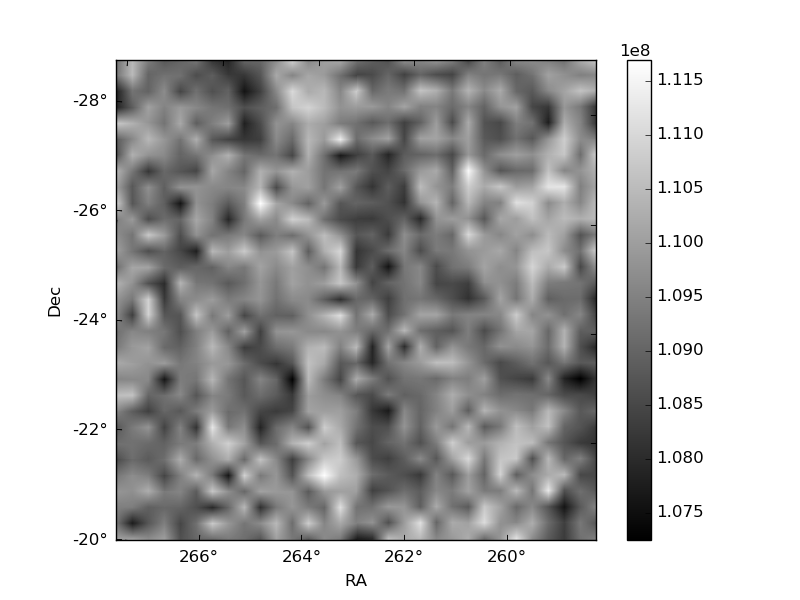
Histogram calculated using DETX and DETY for each event in the final _common_clean file
| Quadrant A | 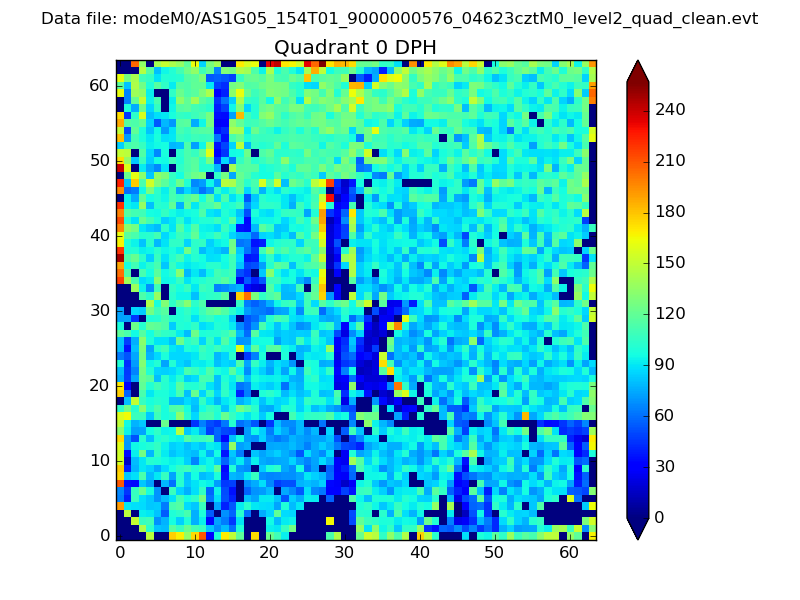 |
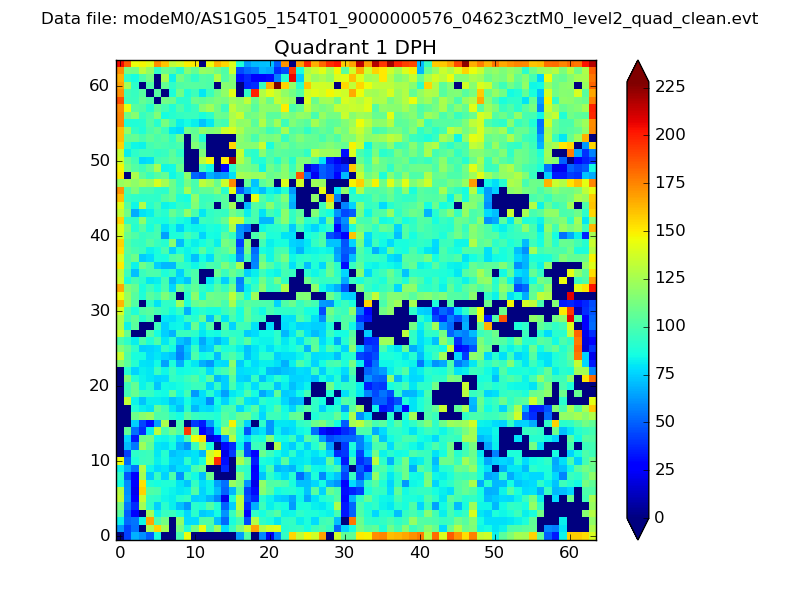 |
Quadrant B |
|---|---|---|---|
| Quadrant D | 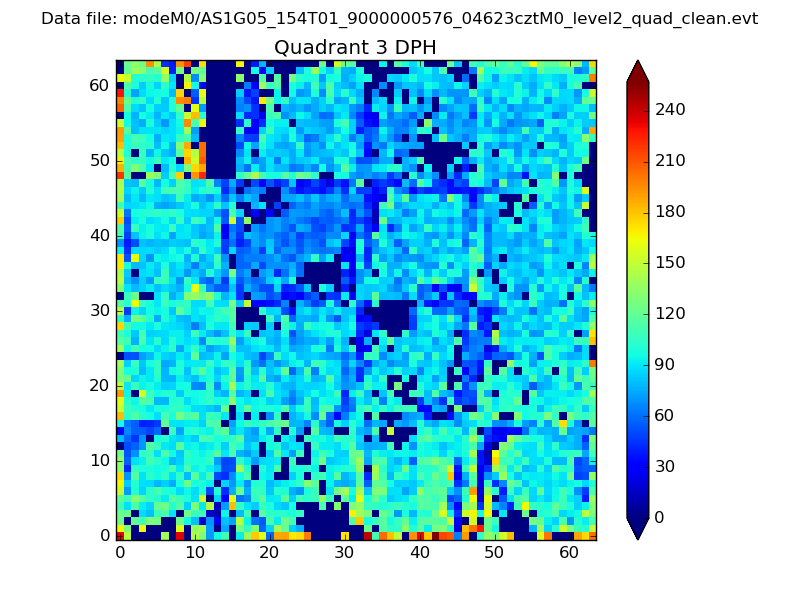 |
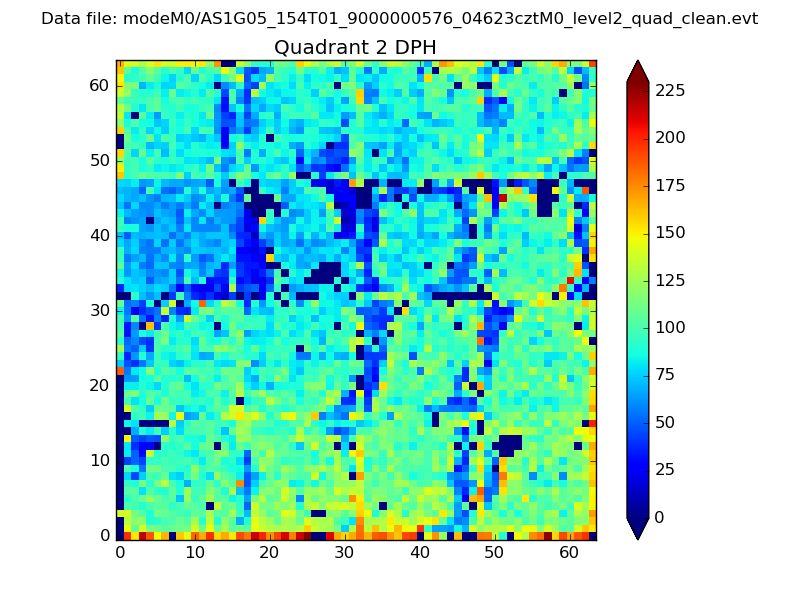 |
Quadrant C |
| Plot type | Count rate plots | Images |
|---|---|---|
| Comparison with Poisson distribution Blue bars denote a histogram of data divided into 1 sec bins. Red curve is a Poisson curve with rate = median count rate of data. |
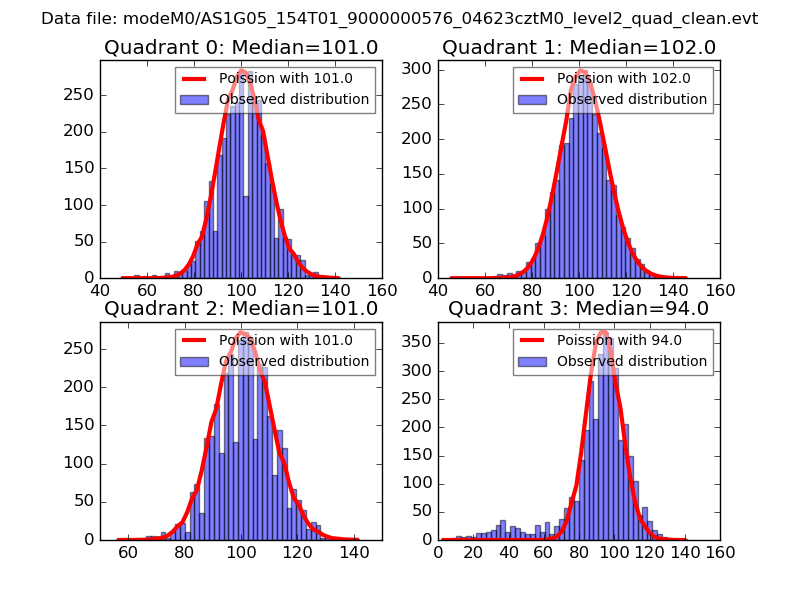 |
 |
| Quadrant-wise count rates Data is divided into 100 sec bins |
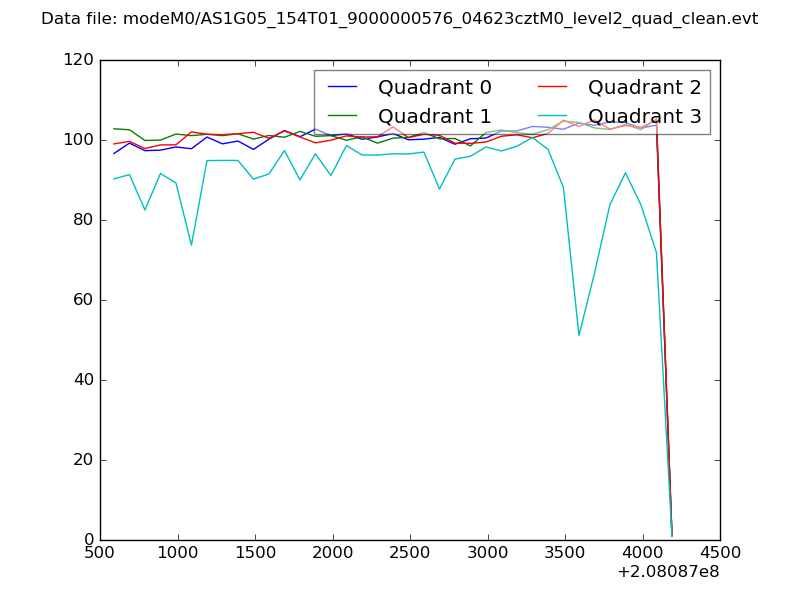 |
|
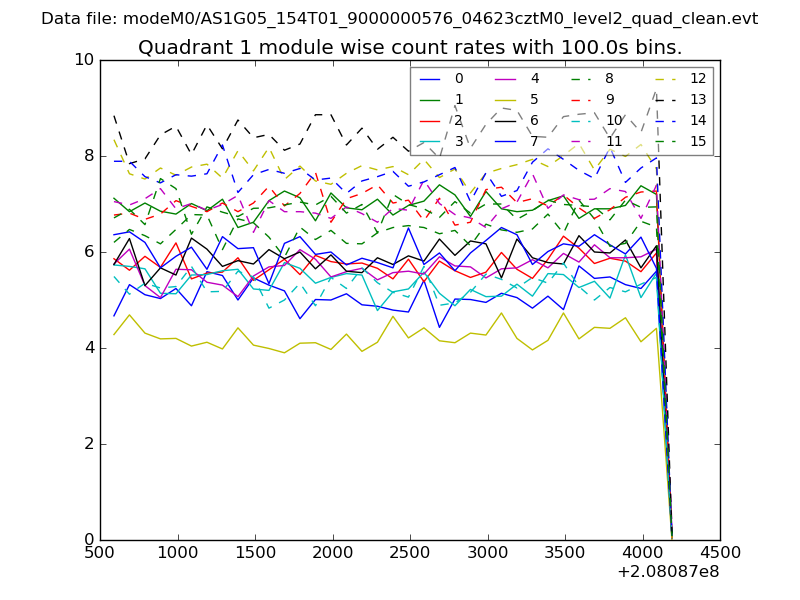
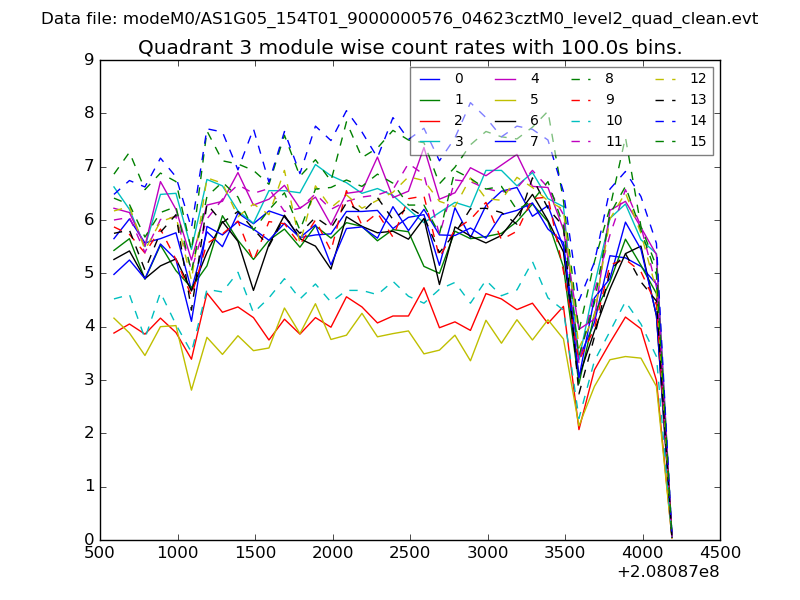
| Module-wise count rates for Quadrant A Data is divided into 100 sec bins |
 |
 |
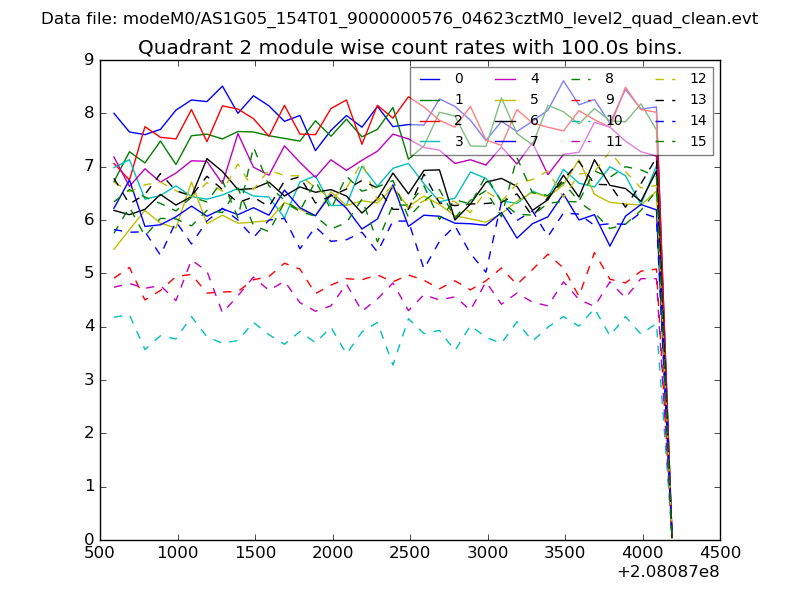
| Module-wise count rates for Quadrant B Data is divided into 100 sec bins |
 |
 |
| Module-wise count rates for Quadrant C Data is divided into 100 sec bins |
 |
 |
| Module-wise count rates for Quadrant D Data is divided into 100 sec bins |
 |
 |
| Parameter | Plot |
|---|---|
| CZT HV Monitor | 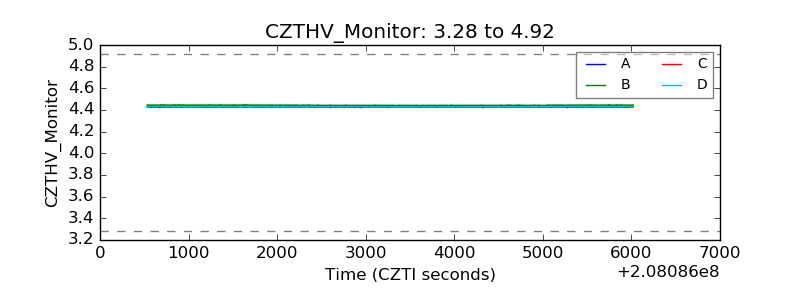 |
| D_VDD | 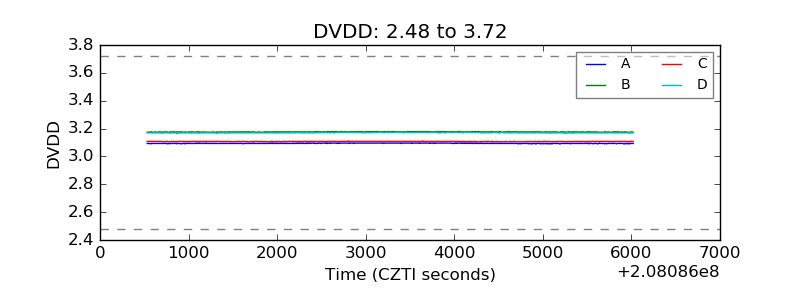 |
| Temperature 1 | 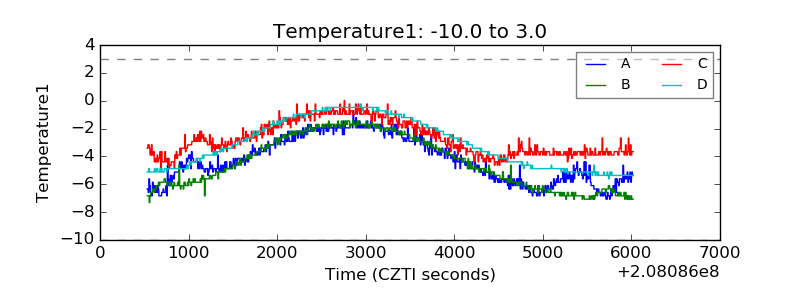 |
| Veto HV Monitor | 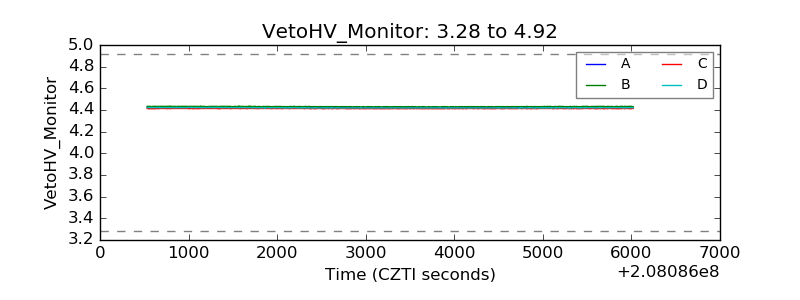 |
| Veto LLD | 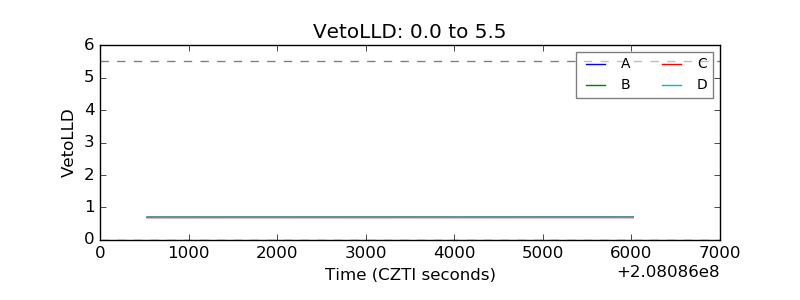 |
| Alpha Counter | 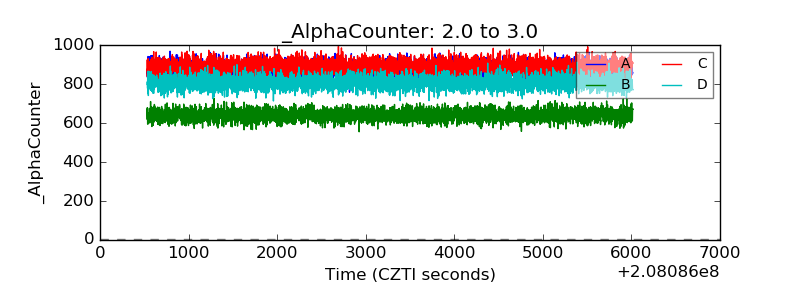 |
| _CPM_Rate | 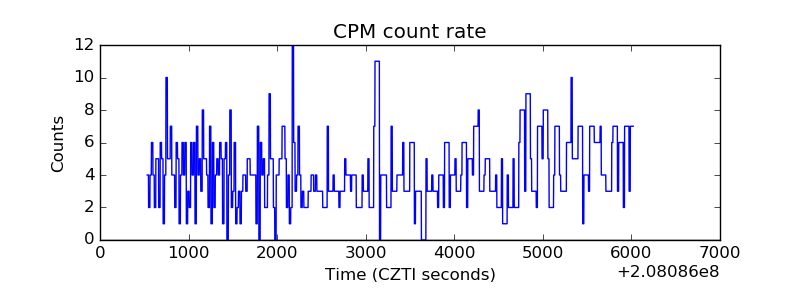 |
| CZT Counter | 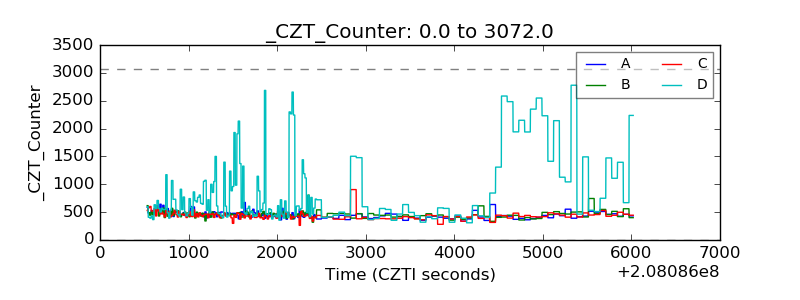 |
| +2.5 Volts monitor | 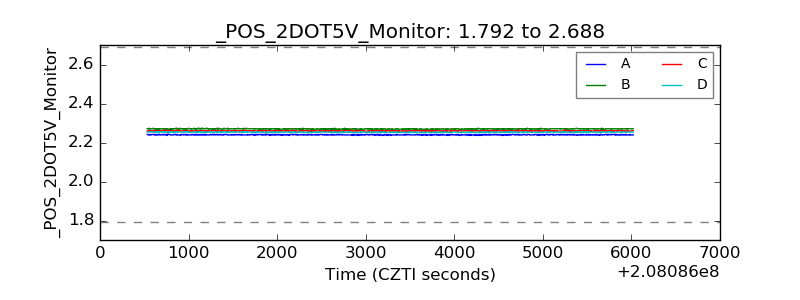 |
| +5 Volts monitor | 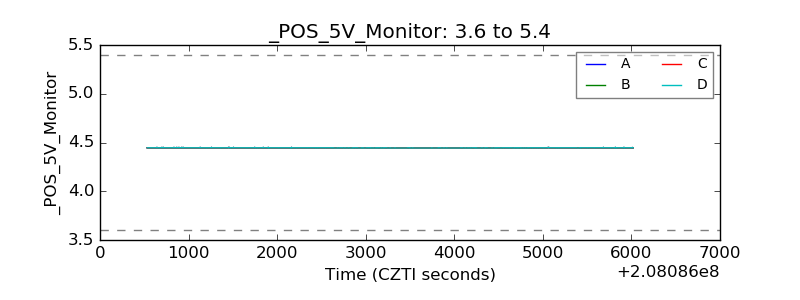 |
| _ROLL_ROT | 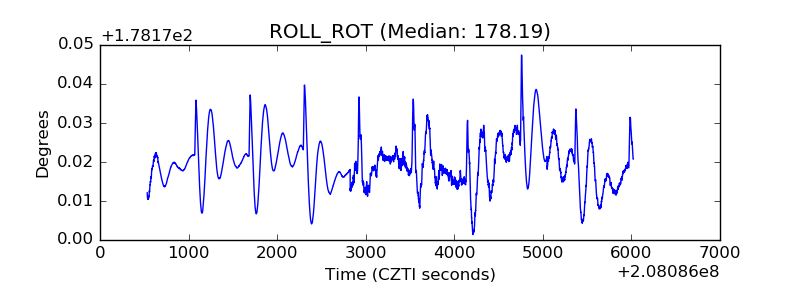 |
| _Roll_DEC | 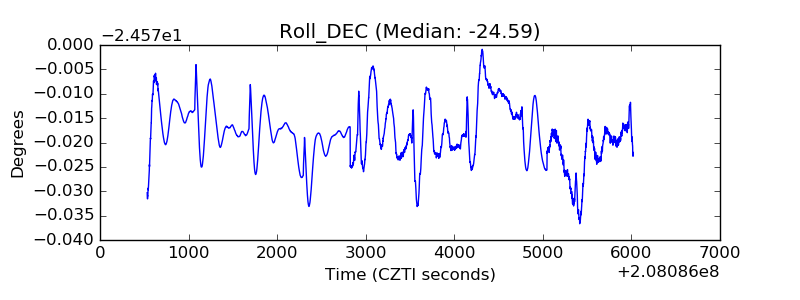 |
| _Roll_RA | 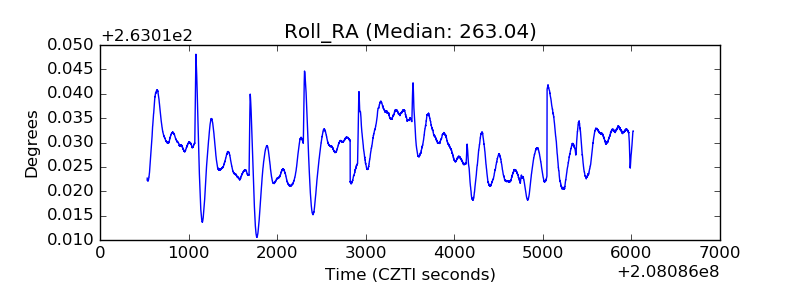 |
| Veto Counter | 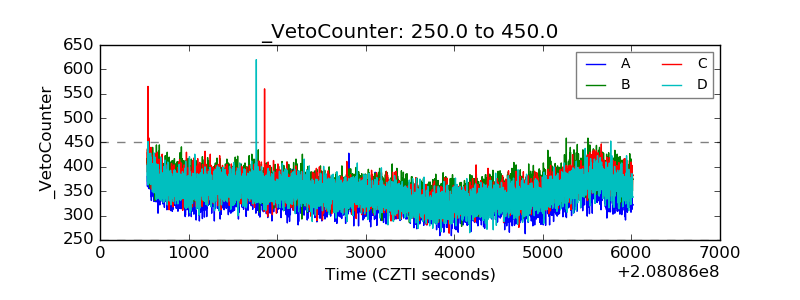 |